Explore
 Validate
 Learn
Learn Flow cytometry
Antibody data
- Antibody Data
- Antigen structure
- References [0]
- Comments [0]
- Validations
- Flow cytometry [1]
- Other assay [10]
Submit
Validation data
Reference
Comment
Report error
- Product number
- 16-0039-81 - Provider product page

- Provider
- Invitrogen Antibodies
- Product name
- CD3 Monoclonal Antibody (HIT3a), Functional Grade, eBioscience™
- Antibody type
- Monoclonal
- Antigen
- Other
- Description
- Description: The HIT3a monoclonal antibody reacts with human CD3e, a 20 kDa subunit of the TCR complex. Along with the other CD3 subunits gamma and delta, the epsilon chain is required for proper assembly, trafficking and surface expression of the TCR complex. CD3 is expressed by thymocytes in a developmentally regulated manner and by all mature T cells. Crosslinking of TCR with HIT3a initiates an intracellular biochemical pathway resulting in cellular activation and proliferation. Applications Reported: The HIT3a antibody has been reported for use in flow cytometric analysis. Applications Tested: The HIT3a antibody has been tested by flow cytometric analysis of normal human peripheral blood cells. This can be used at less than or equal to 0.25 µg per test. A test is defined as the amount (µg) of antibody that will stain a cell sample in a final volume of 100 µL. Cell number should be determined empirically but can range from 10^5 to 10^8 cells/test. It is recommended that the antibody be carefully titrated for optimal performance in the assay of interest. Storage and handling: Use in a sterile environment. Filtration: 0.2 µm post-manufacturing filtered. Purity: Greater than 90%, as determined by SDS-PAGE. Endotoxin Level: Less than 0.001 ng/µg antibody, as determined by LAL assay. Aggregation: Less than 10%, as determined by HPLC.
- Reactivity
- Human
- Host
- Mouse
- Isotype
- IgG
- Antibody clone number
- HIT3a
- Vial size
- 50 µg
- Concentration
- 1 mg/mL
- Storage
- 4° C
No comments: Submit comment
Supportive validation
- Submitted by
- Invitrogen Antibodies (provider)
- Main image

- Experimental details
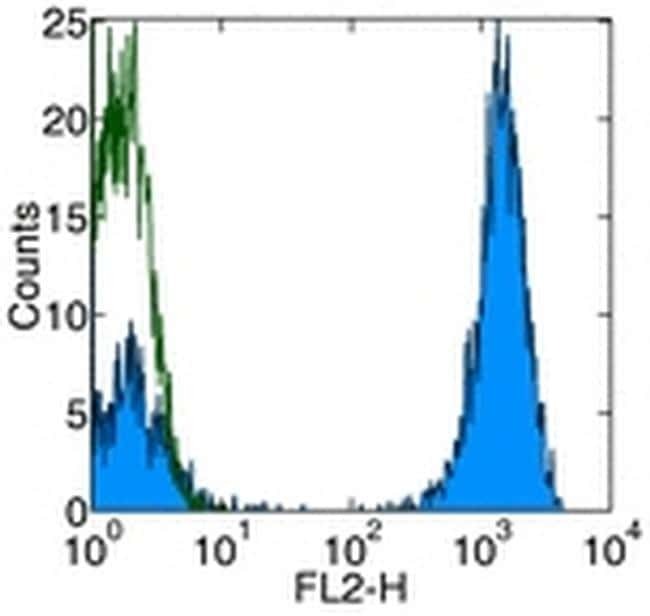
- Staining of normal human peripheral blood cells with Anti-Human CD3 PE.Autofluorescence is indicated by open histogram.Cells in the lymphocyte population were used for analysis.
Supportive validation
- Submitted by
- Invitrogen Antibodies (provider)
- Main image
- Experimental details
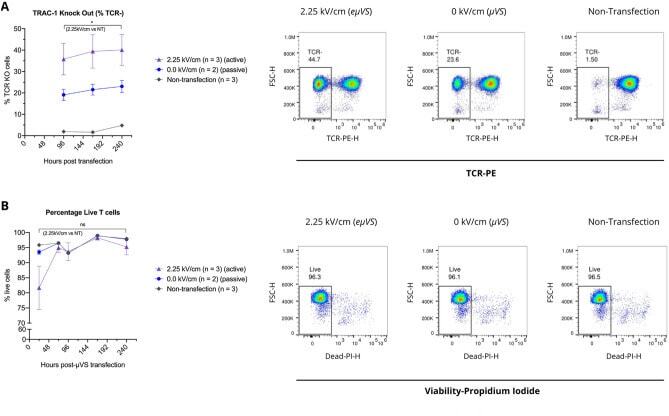
- Figure 6 Application of electric field with uVS (e uVS ) promotes intracellular delivery and TRAC-1 knockout. TRAC-1-targeting Cas9-RNPs were delivered to activated primary human CD3 + T cells via e uVS with an applied electrical field. Quantification of ( A ) percentages of TCR knockout cells and ( B ) viable T cells were quantified via flow cytometry at multiple timepoints post-transfection. TCR knockout levels were measured via TCRalpha/beta staining and quantified as a percentage of TCRalpha/beta-negative cells and the total number of live cells. e uVS with no applied electric field (0 kV cm -1 ) and non-transfection samples served as controls. Data represent the mean +- SD of n >= 2 samples per condition and >= 2 independent experiments. Statistical analysis performed between groups indicated on graphs. Dot plots representative of replicate samples. P < 0.05 by unpaired, two-tailed, heteroscedastic t tests. Figure generated using Adobe Illustrator Creative Cloud (adobe.com/products/illustrator.html) and GraphPad Prism 9 (graphpad.com/scientific-software/prism/).
- Submitted by
- Invitrogen Antibodies (provider)
- Main image
- Experimental details
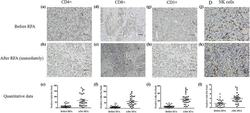
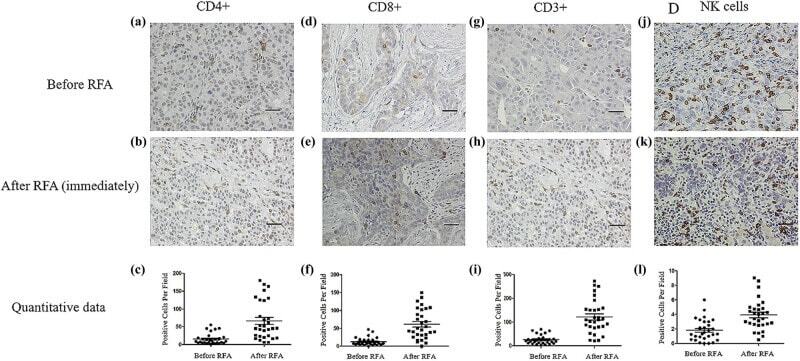
- Figure 2 Immunohistochemical assay of immune cells in tumor tissues before and immediately after RFA. Before RFA: (a) CD4+ cells, (d) CD8+ cells, (g) CD3+ cells, and (j) NK cells. Immediately after RFA: (b) CD4+ cells, (e) CD8+ cells, (h) CD3+ cells, and (k) NK cells. Quantitative data: (c) CD4+ cells, (f) CD8+ cells, (i) CD3+ cells, and (l) NK cells. Data are presented as mean +- SEM. The brown cells are positive cells. Bar = 100 mum. RFA: radiofrequency ablation, CD: cluster of differentiation, NK: natural killer, SEM: standard error of the mean.
- Submitted by
- Invitrogen Antibodies (provider)
- Main image
- Experimental details
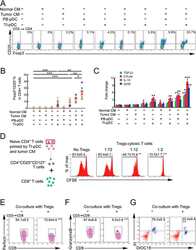
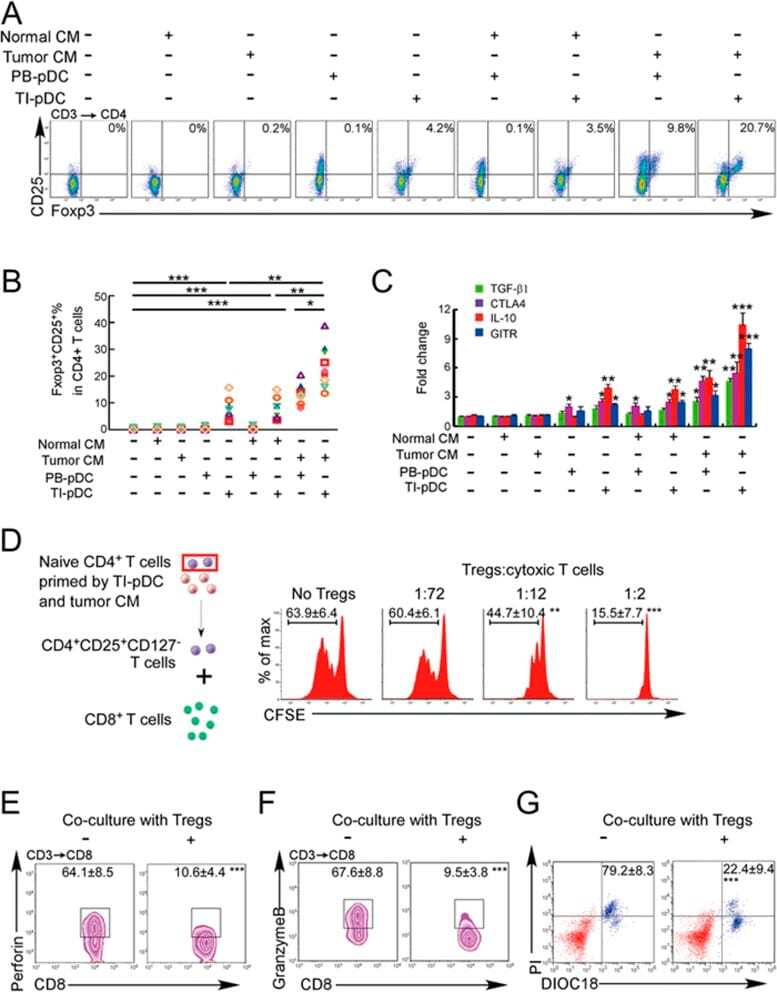
- Figure 3 Naive CD4 + T cells are converted to functional Tregs by tumor-infiltrating DCs and tumor conditioned medium (CM). (A-C) Naive CD4 + T cells from peripheral blood of patients with invasive breast carcinoma were co-cultured with or without autologous pDCs isolated from tumor (TI) or peripheral blood (PB) for 9 days in the presence or absence of 30% CM from autologous tumor slices or adjacent normal tissue slices. (A , B) Non-adherent cells from co-cultures were stained for CD3, CD4, CD25 and intracellular Foxp3, and analyzed by flow cytometry. Representative plots of gated CD3 + CD4 + cells (A) and quantification of percentage of Foxp3 + CD25 + cells among CD3 + CD4 + cells (B) are shown (mean +- SEM, n = 19; * P < 0.05, ** P < 0.01, *** P < 0.001 by Student's t -test). (C) Expression of Treg-associated genes, assessed by qRT-PCR normalized to GAPDH , in sorted CD4 + T cells, relative to expression in cultures without DCs or CM (mean +- SEM, n = 19; * P < 0.05, ** P < 0.01, *** P < 0.001 compared with naive CD4 + T cells cultured alone by Student's t -test). (D-G) Effect of naive CD4 + T cell-derived Tregs, obtained by co-culture with TI pDCs and tumor CM as above, on function of autologous tumor-specific CD8 + T cells. Tumor-specific CD8 + T cells were generated for each subject by stimulating autologous PB CD8 + T cells with autologous tumor lysate-pulsed autologous DCs. Tregs were recovered from co-cultures by magnetic sorting. (D) CFSE-labeled CD8 + T ce
- Submitted by
- Invitrogen Antibodies (provider)
- Main image

- Experimental details
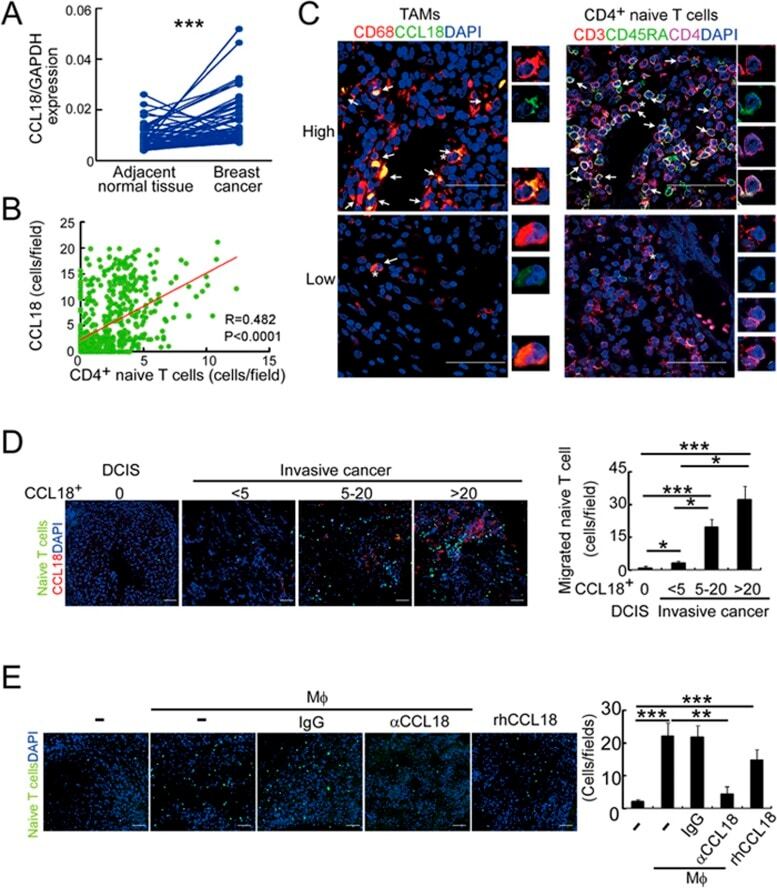
- Figure 4 Naive CD4 + T cells are recruited to breast tumors by TAM-secreted CCL18. (A) CCL18 expression in breast cancer tissues and paired adjacent normal breast tissues detected by qRT-PCR relative to GAPDH ( n = 52; *** P < 0.001 by Student's t -test). (B) Correlation of numbers of CCL18 + TAM (CD68 + CCL18 + ) and naive CD4 + T (CD3 + CD4 + CD45RA + ) cells in breast cancer samples ( n = 626, Pearson's correlation coefficient R and P -value are shown). (C) Representative immunofluorescent staining for CD68 and CCL18 and CD3, CD45RA and CD4 from CCL18-high (upper panel) and CCL18-low (lower panel) breast cancer samples. CCL18 + TAMs and naive CD4 + T cells are indicated by arrows. Asterisk indicates the location of higher magnification images at right. Scale bar, 50 mum. (D) Naive PB CD4 + T cells labeled with CFSE (green) were overlaid on autologous breast tumor slices that were then fixed and stained for CCL18 (red). Representative images (left) and quantification of number of adherent CFSE + T cells (mean +- SEM; right) are shown (ductal carcinoma in situ (DCIS), n = 4; invasive cancer with CCL18 + cell count < 5, n = 9; 5-20, n = 6; > 20, n = 4; * P < 0.05; *** P < 0.001 by Student's t -test). Scale bar, 50 mum. (E) CFSE-labeled PB naive CD4 + T cells from healthy donors were intravenously injected via tail vein, with or without control IgG or CCL18-neutralizing antibody, into NOD/scid mice bearing subcutaneous MDA-MB-231 breast cancers that were implant
- Submitted by
- Invitrogen Antibodies (provider)
- Main image
- Experimental details
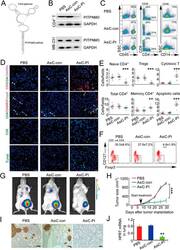
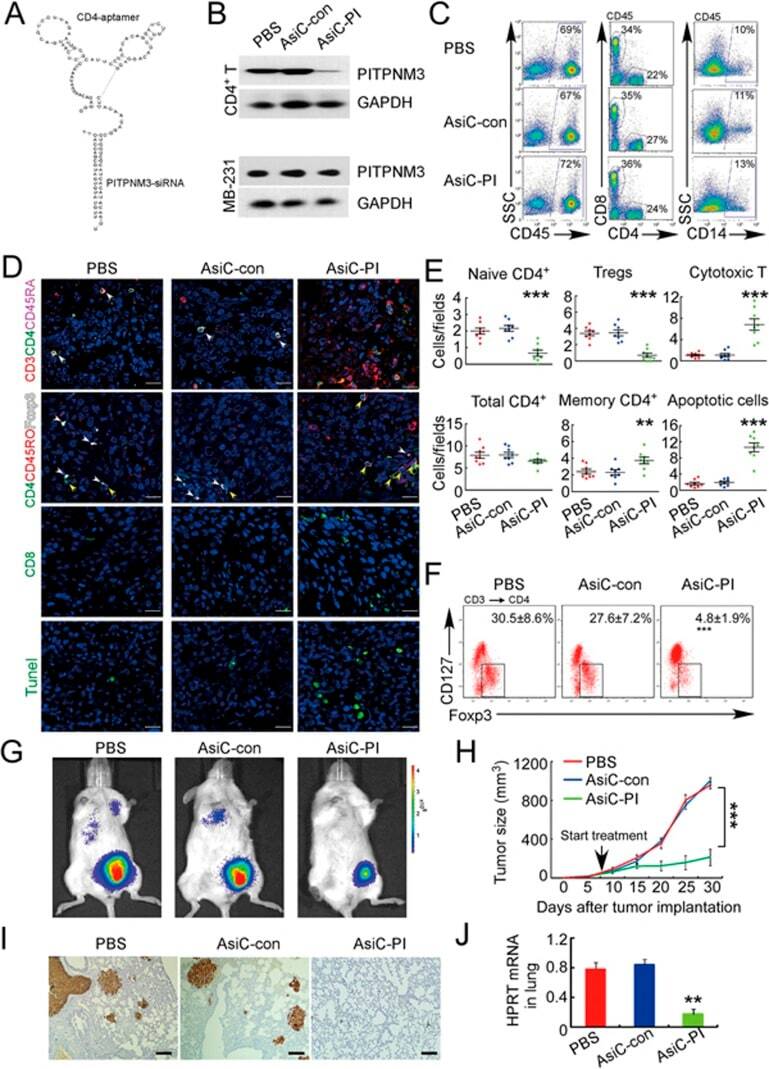
- Figure 6 In vivo knockdown of PITPNM3 in CD4 + T cells reverses immunosuppression and inhibits tumor progression in humanized mice. (A) Humanized mice bearing palpable MDA-MB-231 orthotopic xenografts were intraperitoneally injected daily for 14 days with PBS, 1 nmol CD4-aptamer-control siRNA (AsiC-con) or CD4-aptamer-siRNA targeting PITPNM3 (sequence in A , AsiC-PI) to assess the role of PITPNM3 in TI Tregs, and other T cells and tumor control. Experimental schematic is provided in Supplementary information, Figure S9A . (B) Representative immunoblots showing selective knockdown of PITPNM3 protein in PB CD4 + T cells, but not tumor xenografts ( n = 3). (C) PITPNM3 knockdown did not affect the distribution of human CD45 + hematopoietic cells, CD4 + and CD8 + T cells, and CD14 + monocytes in the peripheral blood of humanized mice. Representative flow plots are shown ( n = 3). (D , E) Effect of PITPNM3 knockdown on TI naive CD4 + , Tregs and CD8 + T cell numbers, and apoptosis by TUNEL assay in xenografts. D shows representative immunofluorescence microscopy images. Top row indicates CD4 + naive T cells by arrows; the second row indicates CD4 + CD45RO + Foxp3 - CD4 + memory T cells (yellow arrows) and Foxp3 + Tregs (white arrows). Scale bar, 50 mum. E shows number of cells of each subtype/high power field in eight mice ( ** P < 0.01, *** P < 0.001 compared to PBS group by Student's t -test). (F) Flow cytometry analysis of gated human CD3 + CD4 + cells isolated from xenogra
- Submitted by
- Invitrogen Antibodies (provider)
- Main image
- Experimental details
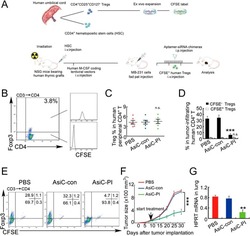
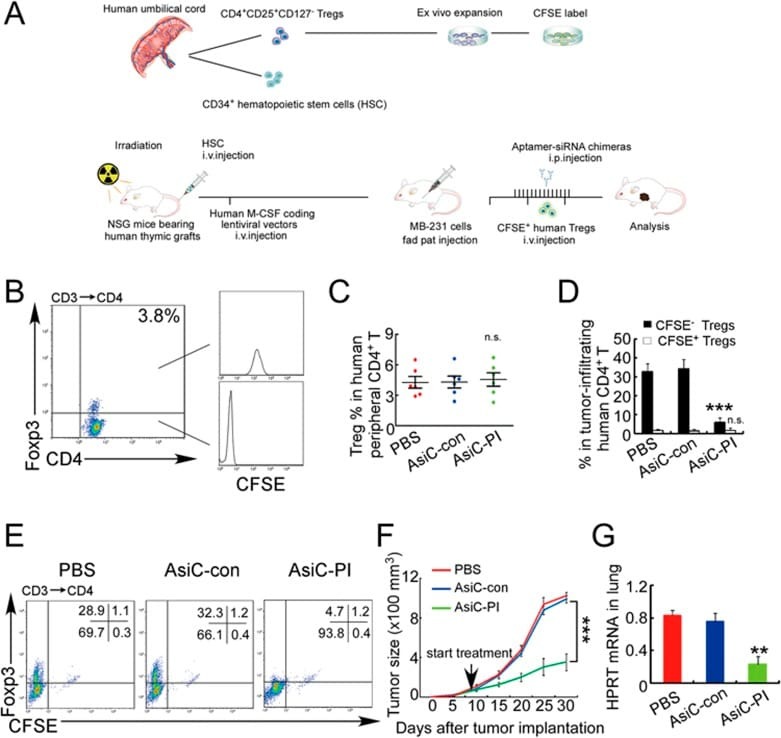
- Figure 7 CD4-aptamer-siRNA targeting PITPNM3 reduces TI Tregs and inhibits tumor progression in humanized mice with circulating human Tregs. Humanized mice, implanted with MDA-MB-231 tumors and concurrently injected intravenously with autologous Tregs, were intraperitoneally injected daily for 14 days after tumors became palpable with PBS, 1 nmol CD4-aptamer-control siRNA (AsiC-con) or CD4-aptamer-siRNA targeting PITPNM3 to assess the role of PITPNM3 in TI Tregs, and other T cells and tumor control. Tregs were administered every 10 days after the initial injection and mice were sacrificed 30 days after tumor cell inoculation. (A) Experimental schematic. (B , C) Peripheral blood cells of humanized mice were stained for human CD3, CD4 and Foxp3, and analyzed by flow cytometry. A representative flow plot (B) and the percentage (mean +- SEM) of PB CD4 + cells that are CFSE + Tregs in six mice per group (C) are shown. (D , E) Isolated cells from xenografts were stained for human CD3, CD4 and Foxp3. The percentage (mean +- SEM) of six mice per group (D) and representative flow plot (E) of FoxP3 + Tregs are shown. Most Tregs were CFSE - (i.e., did not come from infused Tregs) and the number of TI Tregs was reduced by knocking down PITPNM3 in CD4 + T cells ( *** P < 0.001 compared to the PBS group by Student's t -test). (F) Tumor size (mean +- SEM, n = 6 per group; *** P < 0.001 by two-way ANOVA with Bonferroni multiple comparison tests). (G) Lung metastases assessed by qRT-PCR
- Submitted by
- Invitrogen Antibodies (provider)
- Main image
- Experimental details
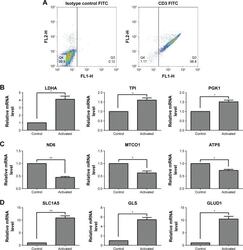
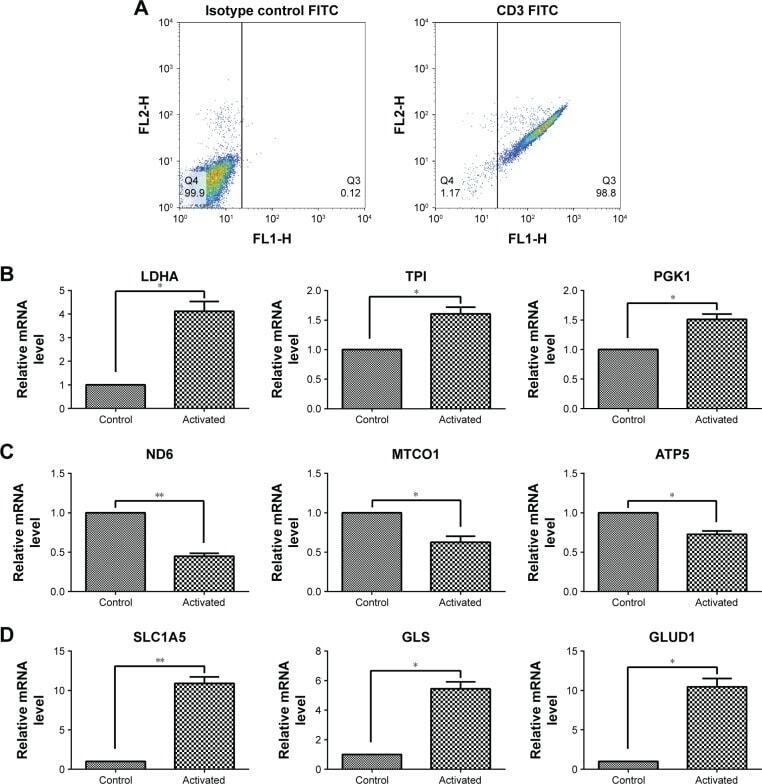
- Figure 1 Gene expression associated with glycolysis, oxidative phosphorylation, and glutaminolysis in T cells after activation by PMA/Iono for 5 hours. Notes: ( A ) T cell purity confirmed by flow cytometry using an anti-CD3-FITC antibody compared with a mouse isotype control. ( B , C , D ) The mRNA level of glycolysis-(LDHA, TPI, and PGK1), oxidative phosphorylation- (ND6, MTCO1, and ATP5), and glutaminolysis-related genes (SLC1A5, GLS, and GLUD1) in T cells after activation. * P
- Submitted by
- Invitrogen Antibodies (provider)
- Main image
- Experimental details
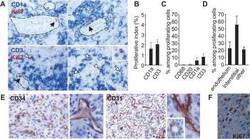
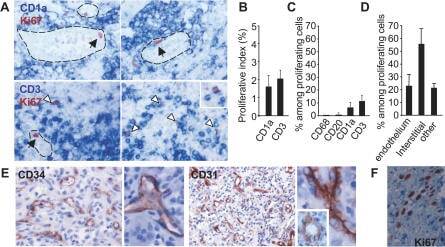
- Figure 1 Proliferating Cells in LCH Granuloma are Mostly Endothelial Cells, Fibroblasts, and T Cells Paraffin-embedded and frozen sections were stained with antibodies against Ki-67 (which label proliferating cells), CD1a (LCs), CD3 (T cells), CD20 (B cells), CD68, CD31, and CD34 (endothelial cells). (A) Double immunostaining of paraffin-embedded section from LCH eosinophilic granulomas with anti-Ki-67 Ab, (brown nuclear staining) and with anti-CD1a Ab (upper images, blue staining) or anti-CD3 Ab (lower images, blue staining). Open arrowheads indicate double-stained cells, black arrowheads indicate Ki-67 + cells with an endothelial morphology. (B) Histogram represents percentage of CD1a + cells and of CD3 + cells labeled with Ki-67 ( n = 15). (C) Histogram represents percentage of proliferating cells (Ki-67 + ) that express CD1a, CD3, CD20, or CD68 ( n = 15). (D) Histogram represents percentage of proliferating cells (Ki-67 + ) that are endothelial cells, interstitial cells (fibroblasts), and other types based on morphological examination. (E) Immunolabeling of blood vessels on paraffin-embedded section from LCH eosinophilic granulomas with CD34 (left) and CD31 (right) antibodies. (F) Proliferating Ki-67 + cells (brown nuclear staining) with a fibroblast-cell morphology in an eosinophilic granuloma.
- Submitted by
- Invitrogen Antibodies (provider)
- Main image
- Experimental details
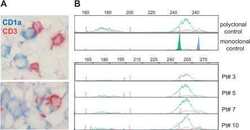
- Figure 3 Polyclonal T Cells Infiltrate LCH Granuloma in Close Contact with LCs (A) Double immunohistochemical labeling of frozen sections from an eosinophilic granuloma with anti-CD3 (brown) and anti-CD1a antibodies (blue). (B) T cell receptor gamma rearrangement was determined on the DNA extracted from frozen biopsies from four patients. Fluorescent profiles for Vgfl/Vg10 PCR using fluorescent Jg primers (JgP, red; Jg1/2, green; JgP1/2, blue) are shown; all the biopsies display a polyclonal profile in comparison to polyclonal and monoclonal positive controls.

- Submitted by
- Invitrogen Antibodies (provider)
- Main image
- Experimental details
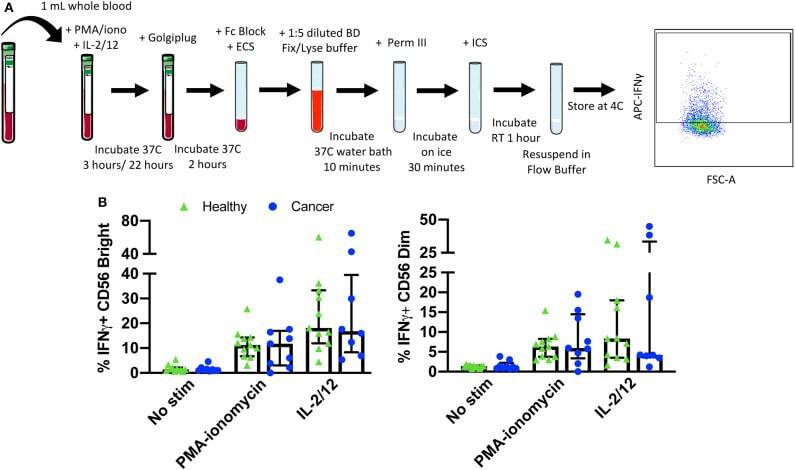
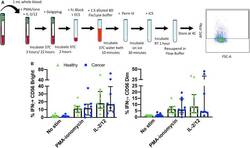
- Figure 5 Whole blood secretory cytokine methodology, gating strategy, and quantification. Whole blood was collected from patients and 1 mL was aliquoted per stimulatory condition. Whole blood was stimulated for 24 h in the presence of PMA-ionomycin or IL-2/12. At 22 h post-stimulation, Golgiplug was added to whole blood and incubated for an additional 2 h. At 24 h post-stimulation, whole blood was incubated for 15 min with an extracellular staining mix. Lyse/fix buffer was then added and incubated for 10 min before blood was spun down. Cells were washed, resuspended in Perm III Buffer, and incubated on ice for 30 min before being spun down and resuspended in an intracellular staining mix. Cells were then incubated for an additional 30 min at 4degC prior to being resuspended and assessed by flow cytometry (A) . The lymphocyte population was gated on before excluding doublets and dead cells. CD45 + CD14 - CD56 Bright/Dim CD3 - cells were gated on to assess intracellular IFNgamma based on unstimulated controls. The percentage of CD56 Bright/Dim CD3 - cells expressing INFgamma after stimulation was assessed in healthy donors ( n = 11) and cancer patients ( n = 9) (B) . Shown are the median values +- IQR.