 Explore
 Validate
 Learn
Learn Western blot
 Immunocytochemistry
 Immunohistochemistry
Antibody data
- Antibody Data
- Antigen structure
- References [24]
- Comments [0]
- Validations
- Immunocytochemistry [2]
- Flow cytometry [1]
- Other assay [15]
Submit
Validation data
Reference
Comment
Report error
- Product number
- PA1-823A - Provider product page

- Provider
- Invitrogen Antibodies
- Product name
- PPAR delta Polyclonal Antibody
- Antibody type
- Polyclonal
- Antigen
- Synthetic peptide
- Description
- PA1-823A detects peroxisome proliferator activated receptor (PPAR) delta from rat, human and mouse cells. This antibody does not detect PPAR alpha or PPAR gamma. PA1-823A has been successfully used in Western blot and immunohistochemical and immunofluoresence procedures. By Western blot, this antibody detects an ~49 kDa protein representing PPAR delta from NIH-3T3 cell lysate. Immunolocalization yeilds predominant nuclear staining. The PA1-823A immunogen is a synthetic peptide corresponding to residues M(1) E Q P Q E E T P E A R E E(14) C of mouse PPAR delta. This sequence is 86% conserved in human PPAR delta. PA1-823A immunizing peptide (Cat. # PEP-026) is available for use in neutralization and control experiments.
- Reactivity
- Human, Mouse, Rat
- Host
- Rabbit
- Isotype
- IgG
- Vial size
- 100 μL
- Concentration
- 1 mg/mL
- Storage
- -20°C, Avoid Freeze/Thaw Cycles
Submitted references Oxidative Stress, Inflammation, and Activators of Mitochondrial Biogenesis: Tempol Targets in the Diaphragm Muscle of Exercise Trained-mdx Mice.
β-RA Targets Mitochondrial Metabolism and Adipogenesis, Leading to Therapeutic Benefits against CoQ Deficiency and Age-Related Overweight.
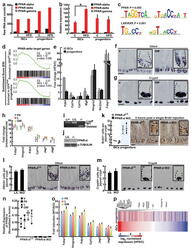
N(1)-methyladenosine methylation in tRNA drives liver tumourigenesis by regulating cholesterol metabolism.
ACOX2 is a prognostic marker and impedes the progression of hepatocellular carcinoma via PPARα pathway.
Towards understanding leydigioma: do G protein-coupled estrogen receptor and peroxisome proliferator-activated receptor regulate lipid metabolism and steroidogenesis in Leydig cell tumors?
Induction of LEF1 by MYC activates the WNT pathway and maintains cell proliferation.
Fatty Acid Synthesis and Degradation Interplay to Regulate the Oxidative Stress in Cancer Cells.
Non-proteolytic ubiquitin modification of PPARγ by Smurf1 protects the liver from steatosis.
Fasting Imparts a Switch to Alternative Daily Pathways in Liver and Muscle.
MiR-132 regulates osteogenic differentiation via downregulating Sirtuin1 in a peroxisome proliferator-activated receptor β/δ-dependent manner.
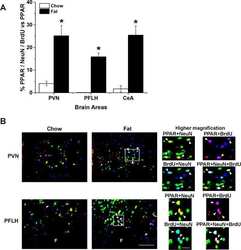
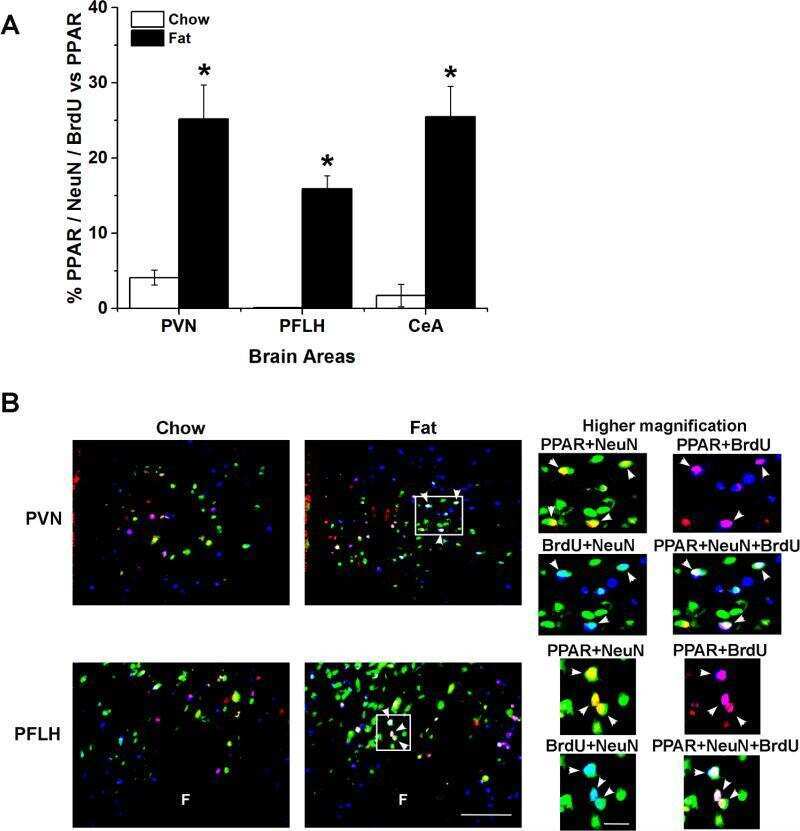
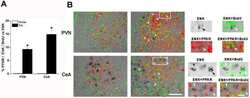
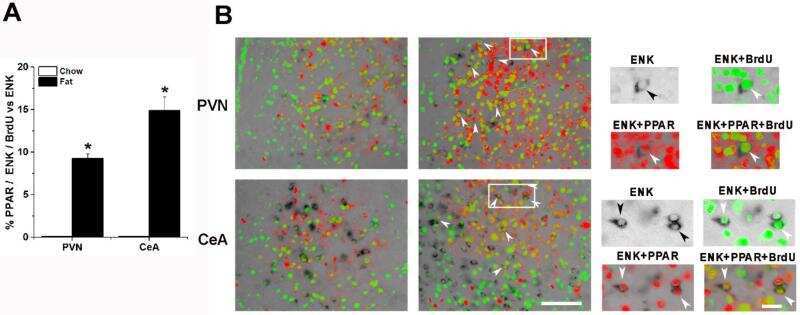
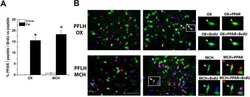
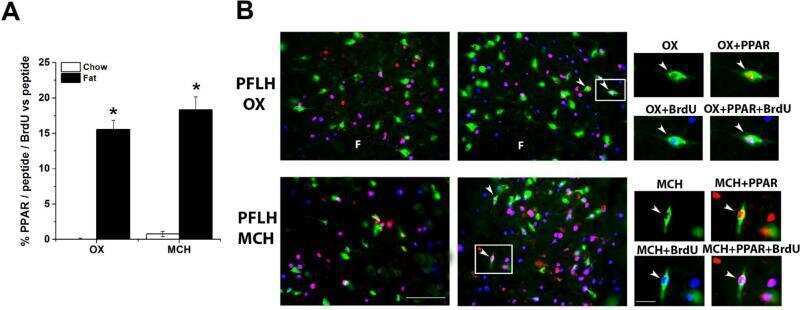
Prenatal fat exposure and hypothalamic PPAR β/δ: Possible relationship to increased neurogenesis of orexigenic peptide neurons.
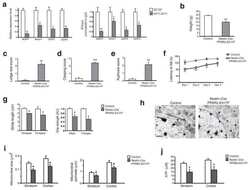
High-fat diet enhances stemness and tumorigenicity of intestinal progenitors.
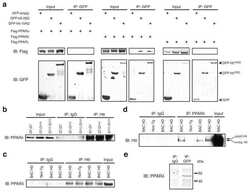
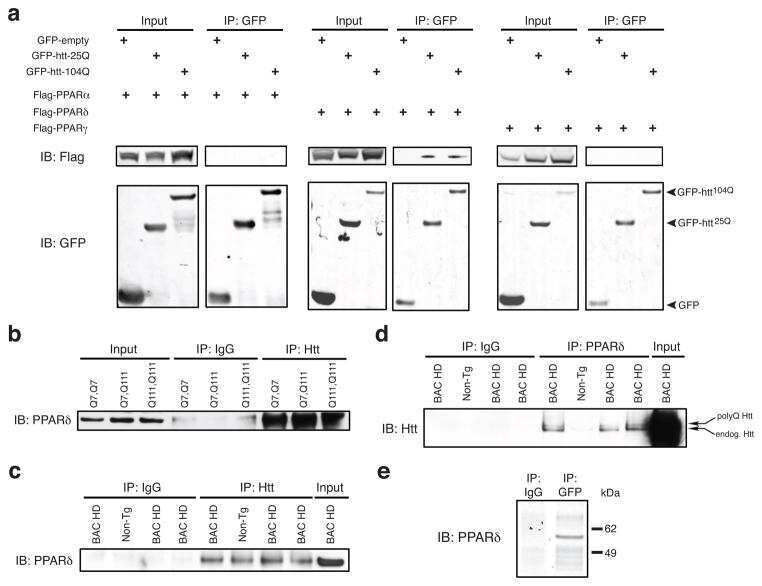
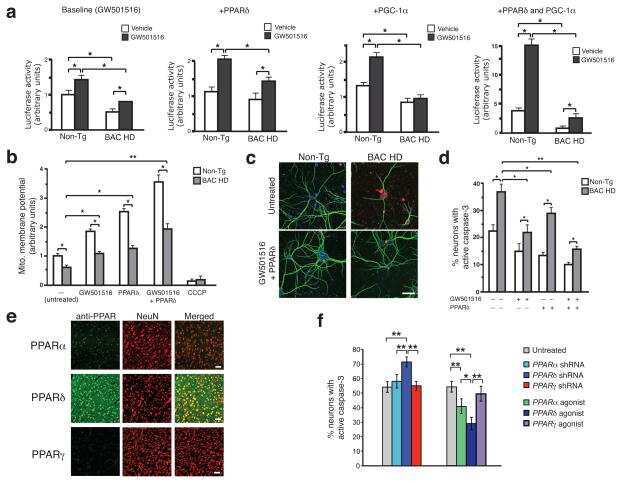
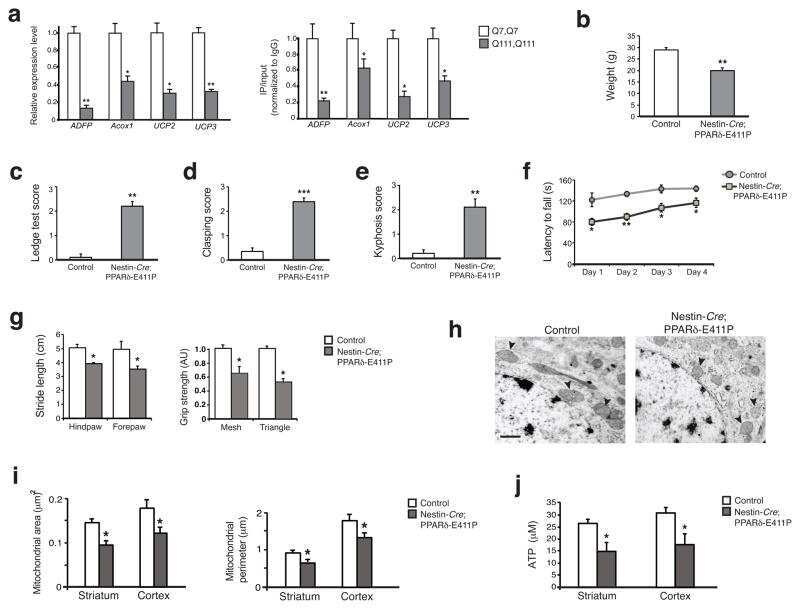
PPAR-δ is repressed in Huntington's disease, is required for normal neuronal function and can be targeted therapeutically.
Cardiomyocyte lipotoxicity is mediated by Il-6 and causes down-regulation of PPARs.
Skeletal muscle respiratory capacity is enhanced in rats consuming an obesogenic Western diet.
Activation of peroxisome proliferator-activated receptor delta inhibits streptozotocin-induced diabetic nephropathy through anti-inflammatory mechanisms in mice.
Inactivation of nuclear Wnt-beta-catenin signaling limits blastocyst competency for implantation.
Trans-species comparison of PPAR and RXR expression by rat and human urothelial tissues.
Increase of peroxisome proliferator-activated receptor delta gene expression in the lungs of streptozotocin-induced diabetic rats.
Neuregulins increase mitochondrial oxidative capacity and insulin sensitivity in skeletal muscle cells.
Urine acidification has no effect on peroxisome proliferator-activated receptor (PPAR) signaling or epidermal growth factor (EGF) expression in rat urinary bladder urothelium.
Peroxisome proliferator-activated receptors (PPARs) and related transcription factors in differentiating astrocyte cultures.
Genetic- or transforming growth factor-beta 1-induced changes in epidermal peroxisome proliferator-activated receptor beta/delta expression dictate wound repair kinetics.
PPAR gamma activators induce growth arrest and process extension in B12 oligodendrocyte-like cells and terminal differentiation of cultured oligodendrocytes.
da Silva HNM, Covatti C, da Rocha GL, Mizobuti DS, Mâncio RD, Hermes TA, Kido LA, Cagnon VHA, Pereira ECL, Minatel E
Frontiers in physiology 2021;12:649793
Frontiers in physiology 2021;12:649793
β-RA Targets Mitochondrial Metabolism and Adipogenesis, Leading to Therapeutic Benefits against CoQ Deficiency and Age-Related Overweight.
Hidalgo-Gutiérrez A, Barriocanal-Casado E, Díaz-Casado ME, González-García P, Zenezini Chiozzi R, Acuña-Castroviejo D, López LC
Biomedicines 2021 Oct 13;9(10)
Biomedicines 2021 Oct 13;9(10)
N(1)-methyladenosine methylation in tRNA drives liver tumourigenesis by regulating cholesterol metabolism.
Wang Y, Wang J, Li X, Xiong X, Wang J, Zhou Z, Zhu X, Gu Y, Dominissini D, He L, Tian Y, Yi C, Fan Z
Nature communications 2021 Nov 2;12(1):6314
Nature communications 2021 Nov 2;12(1):6314
ACOX2 is a prognostic marker and impedes the progression of hepatocellular carcinoma via PPARα pathway.
Zhang Q, Zhang Y, Sun S, Wang K, Qian J, Cui Z, Tao T, Zhou J
Cell death & disease 2021 Jan 4;12(1):15
Cell death & disease 2021 Jan 4;12(1):15
Towards understanding leydigioma: do G protein-coupled estrogen receptor and peroxisome proliferator-activated receptor regulate lipid metabolism and steroidogenesis in Leydig cell tumors?
Kotula-Balak M, Gorowska-Wojtowicz E, Milon A, Pawlicki P, Tworzydlo W, Płachno BJ, Krakowska I, Hejmej A, Wolski JK, Bilinska B
Protoplasma 2020 Jul;257(4):1149-1163
Protoplasma 2020 Jul;257(4):1149-1163
Induction of LEF1 by MYC activates the WNT pathway and maintains cell proliferation.
Hao YH, Lafita-Navarro MC, Zacharias L, Borenstein-Auerbach N, Kim M, Barnes S, Kim J, Shay J, DeBerardinis RJ, Conacci-Sorrell M
Cell communication and signaling : CCS 2019 Oct 17;17(1):129
Cell communication and signaling : CCS 2019 Oct 17;17(1):129
Fatty Acid Synthesis and Degradation Interplay to Regulate the Oxidative Stress in Cancer Cells.
Mikalayeva V, Ceslevičienė I, Sarapinienė I, Žvikas V, Skeberdis VA, Jakštas V, Bordel S
International journal of molecular sciences 2019 Mar 18;20(6)
International journal of molecular sciences 2019 Mar 18;20(6)
Non-proteolytic ubiquitin modification of PPARγ by Smurf1 protects the liver from steatosis.
Zhu K, Tang Y, Xu X, Dang H, Tang LY, Wang X, Wang XW, Zhang YE
PLoS biology 2018 Dec;16(12):e3000091
PLoS biology 2018 Dec;16(12):e3000091
Fasting Imparts a Switch to Alternative Daily Pathways in Liver and Muscle.
Kinouchi K, Magnan C, Ceglia N, Liu Y, Cervantes M, Pastore N, Huynh T, Ballabio A, Baldi P, Masri S, Sassone-Corsi P
Cell reports 2018 Dec 18;25(12):3299-3314.e6
Cell reports 2018 Dec 18;25(12):3299-3314.e6
MiR-132 regulates osteogenic differentiation via downregulating Sirtuin1 in a peroxisome proliferator-activated receptor β/δ-dependent manner.
Gong K, Qu B, Liao D, Liu D, Wang C, Zhou J, Pan X
Biochemical and biophysical research communications 2016 Sep 9;478(1):260-267
Biochemical and biophysical research communications 2016 Sep 9;478(1):260-267
Prenatal fat exposure and hypothalamic PPAR β/δ: Possible relationship to increased neurogenesis of orexigenic peptide neurons.
Chang GQ, Karatayev O, Lukatskaya O, Leibowitz SF
Peptides 2016 May;79:16-26
Peptides 2016 May;79:16-26
High-fat diet enhances stemness and tumorigenicity of intestinal progenitors.
Beyaz S, Mana MD, Roper J, Kedrin D, Saadatpour A, Hong SJ, Bauer-Rowe KE, Xifaras ME, Akkad A, Arias E, Pinello L, Katz Y, Shinagare S, Abu-Remaileh M, Mihaylova MM, Lamming DW, Dogum R, Guo G, Bell GW, Selig M, Nielsen GP, Gupta N, Ferrone CR, Deshpande V, Yuan GC, Orkin SH, Sabatini DM, Yilmaz ÖH
Nature 2016 Mar 3;531(7592):53-8
Nature 2016 Mar 3;531(7592):53-8
PPAR-δ is repressed in Huntington's disease, is required for normal neuronal function and can be targeted therapeutically.
Dickey AS, Pineda VV, Tsunemi T, Liu PP, Miranda HC, Gilmore-Hall SK, Lomas N, Sampat KR, Buttgereit A, Torres MJ, Flores AL, Arreola M, Arbez N, Akimov SS, Gaasterland T, Lazarowski ER, Ross CA, Yeo GW, Sopher BL, Magnuson GK, Pinkerton AB, Masliah E, La Spada AR
Nature medicine 2016 Jan;22(1):37-45
Nature medicine 2016 Jan;22(1):37-45
Cardiomyocyte lipotoxicity is mediated by Il-6 and causes down-regulation of PPARs.
Haffar T, Bérubé-Simard FA, Bousette N
Biochemical and biophysical research communications 2015 Mar 27;459(1):54-9
Biochemical and biophysical research communications 2015 Mar 27;459(1):54-9
Skeletal muscle respiratory capacity is enhanced in rats consuming an obesogenic Western diet.
Stephenson EJ, Camera DM, Jenkins TA, Kosari S, Lee JS, Hawley JA, Stepto NK
American journal of physiology. Endocrinology and metabolism 2012 Jun 15;302(12):E1541-9
American journal of physiology. Endocrinology and metabolism 2012 Jun 15;302(12):E1541-9
Activation of peroxisome proliferator-activated receptor delta inhibits streptozotocin-induced diabetic nephropathy through anti-inflammatory mechanisms in mice.
Matsushita Y, Ogawa D, Wada J, Yamamoto N, Shikata K, Sato C, Tachibana H, Toyota N, Makino H
Diabetes 2011 Mar;60(3):960-8
Diabetes 2011 Mar;60(3):960-8
Inactivation of nuclear Wnt-beta-catenin signaling limits blastocyst competency for implantation.
Xie H, Tranguch S, Jia X, Zhang H, Das SK, Dey SK, Kuo CJ, Wang H
Development (Cambridge, England) 2008 Feb;135(4):717-27
Development (Cambridge, England) 2008 Feb;135(4):717-27
Trans-species comparison of PPAR and RXR expression by rat and human urothelial tissues.
Chopra B, Hinley J, Oleksiewicz MB, Southgate J
Toxicologic pathology 2008 Apr;36(3):485-95
Toxicologic pathology 2008 Apr;36(3):485-95
Increase of peroxisome proliferator-activated receptor delta gene expression in the lungs of streptozotocin-induced diabetic rats.
Huang CJ, Liu IM, Cheng JT
Pulmonary pharmacology & therapeutics 2007;20(1):69-74
Pulmonary pharmacology & therapeutics 2007;20(1):69-74
Neuregulins increase mitochondrial oxidative capacity and insulin sensitivity in skeletal muscle cells.
Cantó C, Pich S, Paz JC, Sanches R, Martínez V, Orpinell M, Palacín M, Zorzano A, Gumà A
Diabetes 2007 Sep;56(9):2185-93
Diabetes 2007 Sep;56(9):2185-93
Urine acidification has no effect on peroxisome proliferator-activated receptor (PPAR) signaling or epidermal growth factor (EGF) expression in rat urinary bladder urothelium.
Achanzar WE, Moyer CF, Marthaler LT, Gullo R, Chen SJ, French MH, Watson LM, Rhodes JW, Kozlosky JC, White MR, Foster WR, Burgun JJ, Car BD, Cosma GN, Dominick MA
Toxicology and applied pharmacology 2007 Sep 15;223(3):246-56
Toxicology and applied pharmacology 2007 Sep 15;223(3):246-56
Peroxisome proliferator-activated receptors (PPARs) and related transcription factors in differentiating astrocyte cultures.
Cristiano L, Cimini A, Moreno S, Ragnelli AM, Paola Cerù M
Neuroscience 2005;131(3):577-87
Neuroscience 2005;131(3):577-87
Genetic- or transforming growth factor-beta 1-induced changes in epidermal peroxisome proliferator-activated receptor beta/delta expression dictate wound repair kinetics.
Tan NS, Michalik L, Desvergne B, Wahli W
The Journal of biological chemistry 2005 May 6;280(18):18163-70
The Journal of biological chemistry 2005 May 6;280(18):18163-70
PPAR gamma activators induce growth arrest and process extension in B12 oligodendrocyte-like cells and terminal differentiation of cultured oligodendrocytes.
Roth AD, Leisewitz AV, Jung JE, Cassina P, Barbeito L, Inestrosa NC, Bronfman M
Journal of neuroscience research 2003 May 15;72(4):425-35
Journal of neuroscience research 2003 May 15;72(4):425-35
No comments: Submit comment
Supportive validation
- Submitted by
- Invitrogen Antibodies (provider)
- Main image

- Experimental details
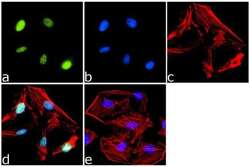
- Immunofluorescence analysis of PPAR delta was done on 70% confluent log phase HeLa cells. The cells were fixed with 4% paraformaldehyde for 15 minutes, permeabilized with 0.25% Triton™ X-100 for 10 minutes, and blocked with 5% BSA for 1 hour at room temperature. The cells were labeled with PPAR delta Rabbit Polyclonal Antibody (Product # PA1-823A) at 1 µg/mL in 1% BSA and incubated for 3 hours at room temperature and then labeled with Goat anti-Rabbit IgG (H+L) Superclonal™ Secondary Antibody, Alexa Fluor® 488 conjugate (Product # A27034) at a dilution of 1:2000 for 45 minutes at room temperature (Panel a: green). Nuclei (Panel b: blue) were stained with SlowFade® Gold Antifade Mountant with DAPI (Product # S36938). F-actin (Panel c: red) was stained with Alexa Fluor® 555 Rhodamine Phalloidin (Product # R415, 1:300). Panel d is a merged image showing Nuclear localization. Panel e is a no primary antibody control. The images were captured at 60X magnification.

- Submitted by
- Invitrogen Antibodies (provider)
- Main image
- Experimental details
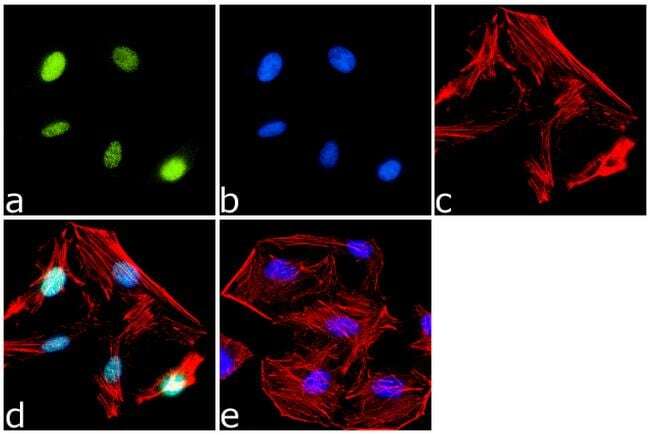
- Immunofluorescence analysis of PPAR delta was done on 70% confluent log phase HeLa cells. The cells were fixed with 4% paraformaldehyde for 15 minutes, permeabilized with 0.25% Triton™ X-100 for 10 minutes, and blocked with 5% BSA for 1 hour at room temperature. The cells were labeled with PPAR delta Rabbit Polyclonal Antibody (Product # PA1-823A) at 1 µg/mL in 1% BSA and incubated for 3 hours at room temperature and then labeled with Goat anti-Rabbit IgG (Heavy Chain) Superclonal™ Secondary Antibody, Alexa Fluor® 488 conjugate (Product # A27034) at a dilution of 1:2000 for 45 minutes at room temperature (Panel a: green). Nuclei (Panel b: blue) were stained with SlowFade® Gold Antifade Mountant with DAPI (Product # S36938). F-actin (Panel c: red) was stained with Alexa Fluor® 555 Rhodamine Phalloidin (Product # R415, 1:300). Panel d is a merged image showing Nuclear localization. Panel e is a no primary antibody control. The images were captured at 60X magnification.
Supportive validation
- Submitted by
- Invitrogen Antibodies (provider)
- Main image
- Experimental details
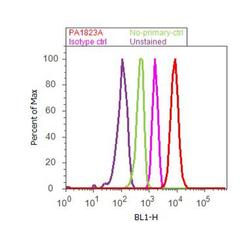
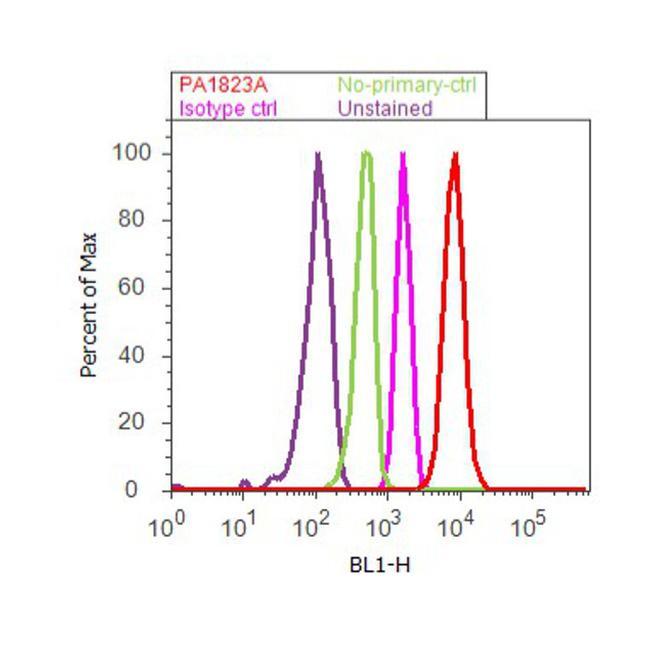
- Flow cytometry analysis of PPAR delta was done on Jurkat cells. Cells were fixed with 70% ethanol for 10 minutes, permeabilized with 0.25% Triton™ X-100 for 20 minutes, and blocked with 5% BSA for 30 minutes at room temperature. Cells were labeled with PPAR delta Rabbit Polyclonal Antibody (PA1823A, red histogram) or with rabbit isotype control (pink histogram) at 3-5 ug/million cells in 2.5% BSA. After incubation at room temperature for 2 hours, the cells were labeled with Alexa Fluor® 488 Goat Anti-Rabbit Secondary Antibody (A11008) at a dilution of 1:400 for 30 minutes at room temperature. The representative 10,000 cells were acquired and analyzed for each sample using an Attune® Acoustic Focusing Cytometer. The purple histogram represents unstained control cells and the green histogram represents no-primary-antibody control.
Supportive validation
- Submitted by
- Invitrogen Antibodies (provider)
- Main image
- Experimental details
- NULL
- Submitted by
- Invitrogen Antibodies (provider)
- Main image
- Experimental details
- NULL
- Submitted by
- Invitrogen Antibodies (provider)
- Main image
- Experimental details
- NULL
- Submitted by
- Invitrogen Antibodies (provider)
- Main image

- Experimental details
- NULL
- Submitted by
- Invitrogen Antibodies (provider)
- Main image
- Experimental details
- NULL
- Submitted by
- Invitrogen Antibodies (provider)
- Main image
- Experimental details
- NULL
- Submitted by
- Invitrogen Antibodies (provider)
- Main image
- Experimental details
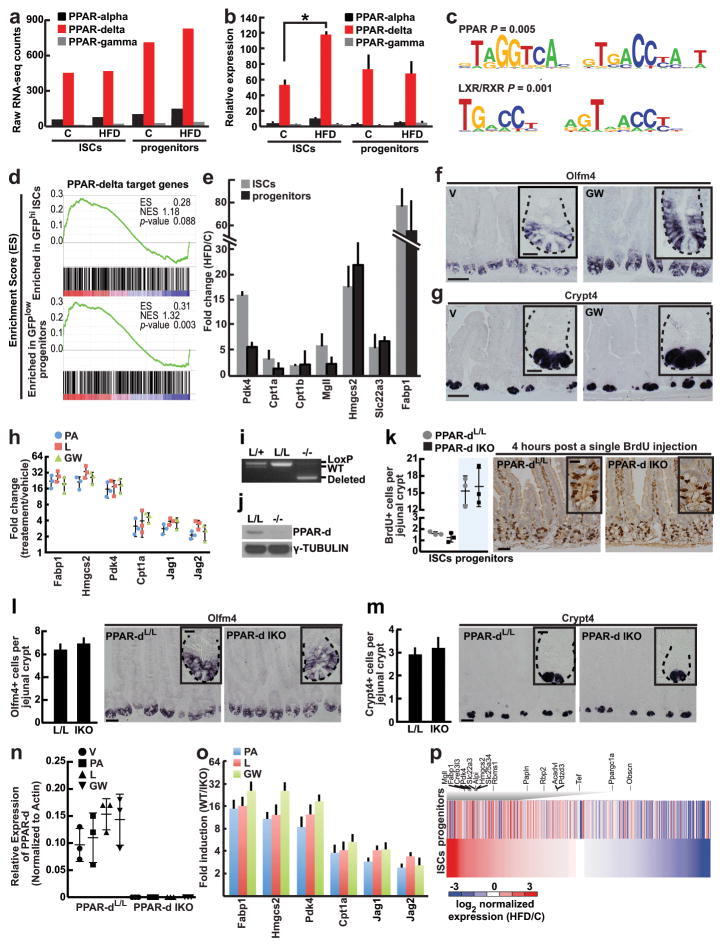
- Extended Data Figure 6 PPAR-d is the predominant PPAR family member expressed in intestinal progenitors and mediates the effects of HFD a , PPAR-d is the most abundant PPAR family member in ISCs (Lgr5-GFP hi ) and progenitors (Lgr5-GFP low ) based on RNA-seq data. b , Confirmation of PPAR family member mRNA expression levels in ISCs (Lgr5-GFP hi ) and progenitors (Lgr5-GFP low ) by qRT-PCR ( n =5). c , Genes upregulated in HFD ISCs (Lgr5-GFP hi ) versus control ISCs were enriched in PPAR and LXR/RXR motifs. d , GSEA of RNA-seq data identified enrichment of PPAR-d targets in ISCs (Lgr5-GFP hi ) and progenitors (Lgr5-GFP low ) with a HFD. e , Confirmation of induced PPAR-d target gene expression in flow sorted ISCs (Lgr5-GFP hi ) and progenitors (Lgr5-GFP low ) by qRT-PCR ( n= 5). All fold changes were significant with P
- Submitted by
- Invitrogen Antibodies (provider)
- Main image
- Experimental details
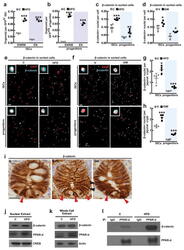
- Extended Data Figure 7 HFD and PPAR-d signaling boost nuclear beta-catenin localization and activity in intestinal progenitors a , b , HFD-derived ISCs ( a , Lgr5-GFP hi ) and progenitors ( b , Lgr5-GFP low ) required less Wnt3a and R-spondin to initiate organoids compared to C ISCs as measured by comparing organoid-formation in complete ENRW media, which includes EGF, Noggin, R-spondin, and Wnt3a, versus EN media, which includes EGF and Noggin but lacks Wnt3a and R-spondin ( n =3). C-derived progenitors, in contrast to HFD-derived progenitors, rarely formed organoids in either ENRW or EN media. c-f , HFD increased nuclear beta-catenin localization in flow sorted ISCs and progenitors from HFD ( c , n =5) and GW-treated ( d , n =4) mice as determined by immunofluorescence (red=DAPI, cyan=non-phosphorylated beta-catenin, CST 8814S). At least 100 cells per sample were quantified. Representative images are shown in ( e , f ). g - i , HFD ( g ) and GW ( h ) treatment increased the numbers of ISCs and progenitors with beta-catenin + nuclei as assessed by immunostains ( n =4 each). Representative images are shown in ( i ); arrowheads indicate representative nuclear beta-catenin in ISCs (red) and progenitors (black). j - l , Association of PPAR-d and beta-catenin in C and HFD derived intestinal crypts as shown by immunoprecipitation (IP) ( n=3 ). For western blot source data, see Supplementary Figure 1 . (Unless otherwise indicated, data reflect mean +- s.d. from n independent experi
- Submitted by
- Invitrogen Antibodies (provider)
- Main image
- Experimental details
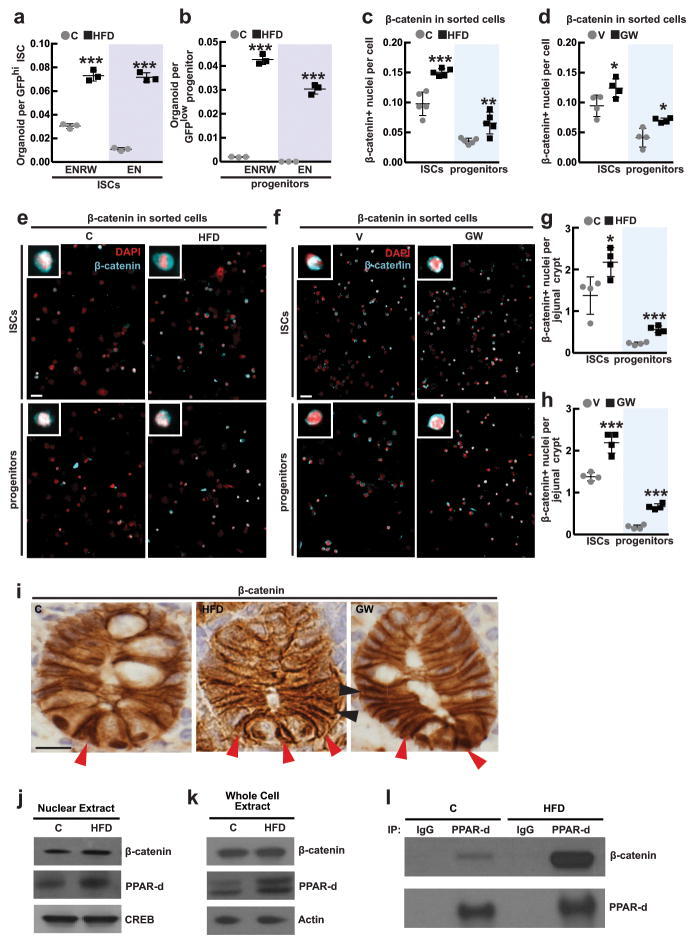
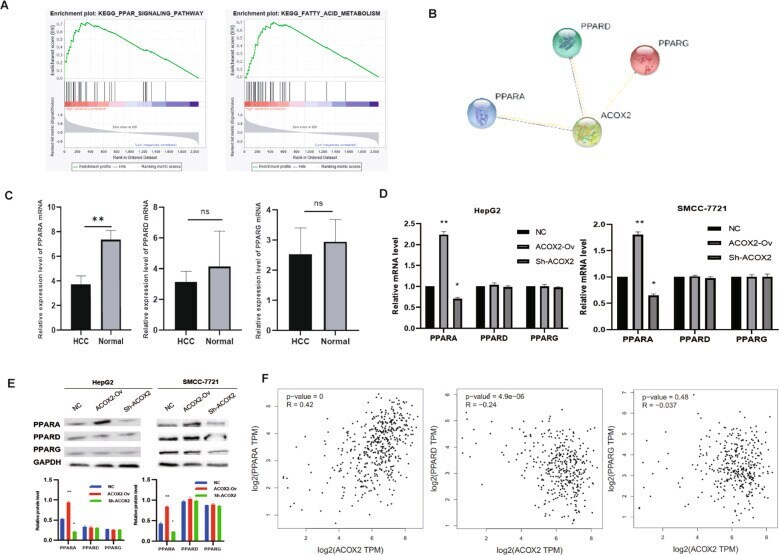
- Fig. 8 ACOX2 inhibits tumor through the PPARalpha signaling pathway. A The GSEA showed that PPAR ( P = 0.004) and FATTY_ACID_METABOLISM ( P = 0.006) were significantly changed. B The PPI network of ACOX2, PPARA, PPARD, and PPARG was constructed by the String database. C The expression of PPARA, PPARD, and PPARG genes in liver cancer tissues and adjacent noncancerou tissues by using RT-qPCR. D The mRNA expression of PPARA, PPARD, and PPARG was detected by RT-qPCR in HepG2 and SMCC-7721 (NC, the normal HCC cell lines; ACOX2-Ov, overexpression of ACOX2; Sh- ACOX2, knockdown ACOX2). E The protein levels of PPARA, PPARD, and PPARG were detected by Western blot in HepG2 and SMCC-7721 (NC, the normal HCC cell lines; ACOX2-Ov, overexpression of ACOX2; Sh- ACOX2, knockdown ACOX2, * P < 0.05; ** P < 0.01; n.s. not significant). F The Pearson correlation analysis between ACOX2 and PPARA, PPARD, and PPARG by the GEPIA database.
- Submitted by
- Invitrogen Antibodies (provider)
- Main image
- Experimental details
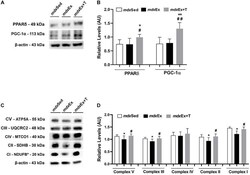
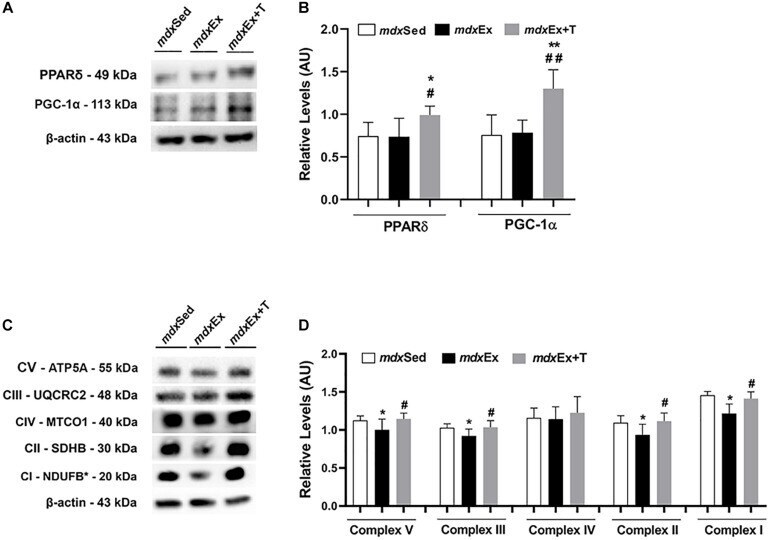
- FIGURE 9 Tempol effects on the activators of mitochondrial biogenesis and oxidative phosphorylation. (A) Western blotting analysis of peroxisome proliferator-activated receptor delta (PPARdelta) and peroxisome proliferator-activated receptor-gamma coactivator-1alpha (PGC-1alpha) in the diaphragm (DIA) muscle from the sedentary mdx mice ( mdx Sed), exercise trained mdx mice ( mdx Ex), and exercise trained mdx mice treated with Tempol ( mdx Ex+T). (B) The graphs show the PPARdelta and PGC-1alpha levels in the crude extracts of DIA from the mdx Sed, mdx Ex, and mdx Ex+T groups. (C) Western blotting analysis of the OXPHOS complexes (complex V, III, IV, II, and I) in the DIA muscle from the mdx Sed, mdx Ex, and mdx Ex+T groups. (D) The graphs show the OXPHOS protein in the crude extracts of DIA from the mdx Sed, mdx Ex, and mdx Ex+T groups. The blots of the proteins (top row) and beta-actin (loading control, bottom row) are shown. The intensities of each band were quantified and normalized to those of the corresponding control. All values expressed as mean +- standard deviation (SD). * P
- Submitted by
- Invitrogen Antibodies (provider)
- Main image
- Experimental details
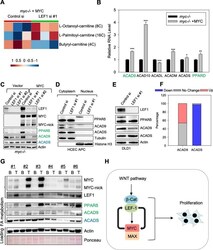
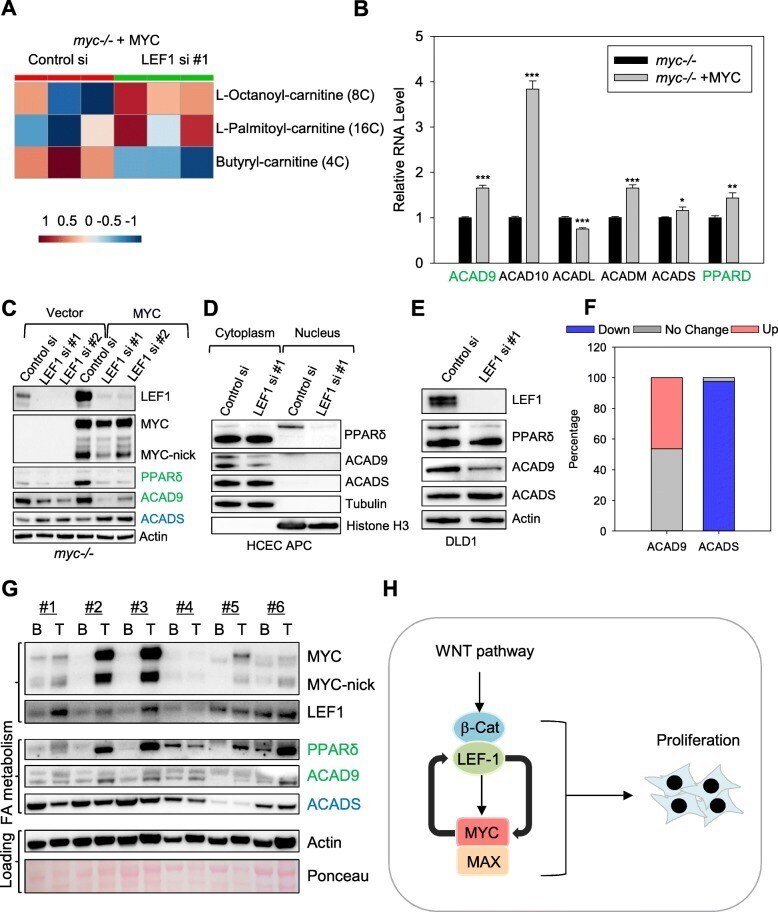
- Fig. 6 LEF1 regulates lipid metabolism in MYC-expressing cells. a Heatmap of acylcarnitines affected by LEF1 siRNA in myc-/- + MYC fibroblast, generated by metabolomics analyses of cells transfected with either control or LEF1 siRNA. b Rat1 myc-/- fibroblasts expressing either vector or human MYC were collected and subjected for RNA-seq analysis and expression levels of genes involving lipid metabolism were compared. c Rat1 myc -/- control fibroblast cells and Rat1 myc -/- cells reconstituted with human MYC were transfected with control or LEF1 siRNAs for 3 days and extracted with NP40 lysing buffer for Western blot assays with the indicated antibodies. d HCEC expressing truncated APC were transfected with either control or LEF1 siRNA for 3 days, and then fractionated into nuclear and cytoplasmic fractions for Western blotting with the indicated antibodies. e DLD1 cells transfected with control of LEF1 siRNAs for three days were extracted with NP40 lysis buffer, and the total lysates were subjected to Western blot assays. f ACAD9 and CADS gene expression in colon cancer and adjacent normal tissues deposited in the TCGA database. Blue: downregulated (< 0.7), grey: no change (0.7-1.3), and red: upregulated (> 1.3). n = 41 pairs. g Human colon tumor tissues (T) and their surrounding benign tissues (B) were extracted with NP40 lysis buffer, and the total lysates were subjected to Western blotting with the indicated antibodies. h Model of MYC and LEF1 positive feedback loop in pro
- Submitted by
- Invitrogen Antibodies (provider)
- Main image

- Experimental details
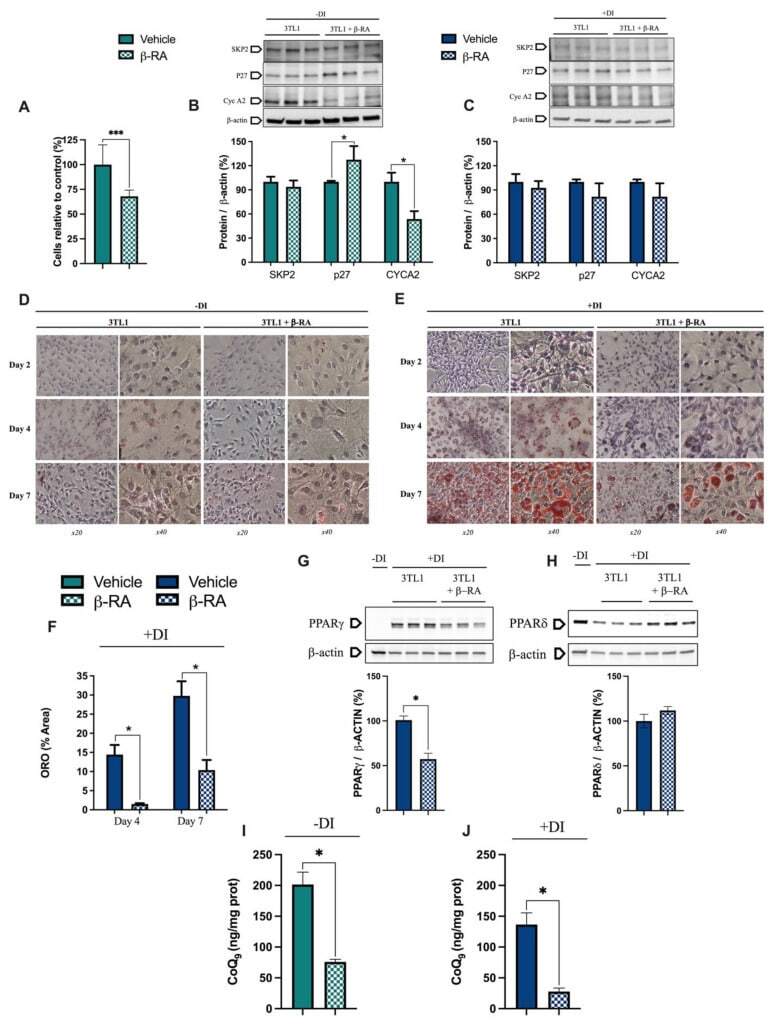
- Figure 7 Direct effects of beta-RA on adipogenesis. ( A ) Percentage of 3TL1 cells after seven days of treatment with 1 mM beta-RA relative to the number of untreated 3TL1 cells. Cells cultured in proliferative conditions. ( B ) Levels of the proteins SKP2, p27, and CYCA2, which were involved in the control of the cell cycle. The 3TL1 cells were treated for seven days with 1 mM beta-RA in proliferative conditions. ( C ) Levels of the proteins SKP2, p27, and CYCA2, which were involved in cell cycle control. The 3TL1 cells were treated for seven days with 1 mM beta-RA in differentiative conditions. ( D , E ) Oil Red O staining in 3TL1 cells cultured under proliferative ( D ) and proliferative + differentiative ( F ) conditions. The 3TL1 cells were treated with 1 mM beta-RA from day 0 in both conditions and the stains were performed on three different days (2, 4, and 7). ( F ) Percentage of the area corresponding to the Oil Red O stains in the 3TL1 cells in differentiative conditions after days 4 and 7 of treatment with 1 mM beta-RA. ( G , H ) Levels of PPARgamma and PPARdelta in the 3TL1 cells cultured in proliferative + differentiative ( F ) conditions and treated with 1 mM beta-RA. The results in non-differentiated cells are shown in line one as the negative control. ( I , J ) Levels of CoQ 9 in the 3TL1 cells cultured in proliferative conditions ( I ) and differentiative conditions ( J ) and treated with 1 mM beta-RA. Data are expressed as mean +- SD. * p < 0.05, *** p < 0.0
- Submitted by
- Invitrogen Antibodies (provider)
- Main image
- Experimental details
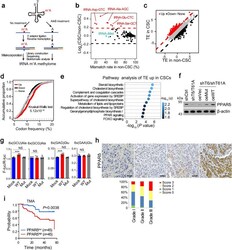
- Fig. 3 m 1 A58 methylation in tRNA regulates PPARdelta translation. a Scheme of tRNA m 1 A-seq. b Comparison of misincorporation signals caused by m 1 A58 in tRNAs between liver CSC and non-CSC cells. Red dots represent tRNAs with elevated m 1 A58 methylation levels in CSCs. c Comparison of translation efficiency (TE) between liver CSC and non-CSC cells. Red dots represent genes with increased TE, while black dots represent genes with decreased TE in liver CSCs. d Frequency of codons corresponding to m 1 A58 elevated tRNAs was higher in the genes with increased translation efficiency (TE) in CSCs. e Unbiased pathway analysis of TE upregulated genes in liver CSCs compared with non-CSCs. f Western blotting analysis of PPARdelta expression in indicated CSCs. n = 4 biologically independent samples. g Effect of elevated m 1 A58 methylation levels in tRNA Ala(AGC) and tRNA Glu(CTC) on protein synthesis. Reporter vectors were transfected into Mock overexpressed PLC/PRF/5 cells, WT-TRMT6/TRMT61A or Mut-TRMT6/TRMT61A overexpressed PLC/PRF/5 cells, respectively. Control vectors were also transfected into these three cell lines to normalize translation differences among these cell lines. The expression level of two synonymous codon control Ala-(GCG) and Glu-(GAA) remained unchanged upon TRMT6/TRMT61A expression level manipulation. n = 6 biologically independent samples. Exact P values from left to right: 0.00021, 0.27, 0.45, 0.00086, 0.21, 0.15. h Representative immunohistochemistry ima
- Submitted by
- Invitrogen Antibodies (provider)
- Main image
- Experimental details
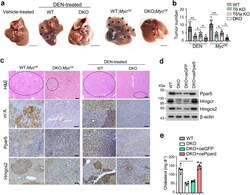
- Fig. 6 Trmt6/Trmt61a knockout inhibits mouse cholesterol synthesis through Ppardelta pathway. a Macroscopic appearance of livers from Trmt6 f/+ /Trmt61a f/+ ; Alb-Cre (WT) and Trmt6/Trmt61a DKO ( Trmt6 f/f /Trmt61a f/f ; Alb-Cre) mice under DEN-induced cancer or in Myc OE mouse model of HCC. Black asterisks indicate liver tumors. Scale bar, 1 cm. b Quantitation of liver tumor numbers of Trmt6 KO, Trmt61a KO, and Trmt6/Trmt61a DKO in DEN-treated and in Myc OE mice. Results are shown as means +- SD ( n = 10 biologically independent mice). Exact P values from left to right: 0.0075, 0.041, 0.032, 0.0037, 0.045, 0.014. c Representative liver H&E staining and immunohistochemistry images of m 1 A, Ppardelta, and Hmgcs2 (brown) from Trmt6 f/ + /Trmt61a f/+ (WT) and Trmt6 -/- /Trmt61a -/- (DKO) in Myc OE and DEN-treated mice. Black circle indicates tumor region. Scale bar, 100 mum. n = 3 independent samples. d Levels of cholesterol biogenesis related proteins in 10-week-old male Trmt6/Trmt61a deleted (DKO) in Myc OE mice transduced with AAV vectors encoding GFP control (oeGFP) or Ppardelta (oePpardelta) for 8 days. WT: Trmt6 f/+ /Trmt61a f/+ ; Myc OE mice. n = 5 biologically independent mice. e Total serum cholesterol levels in 10-week-old normal-fed male Trmt6/Trmt61a deleted Myc OE (DKO) mice transduced with AAV vectors encoding GFP control (oeGFP) or Ppardelta (oePpardelta) for 8 days. WT: Trmt6 f/+ /Trmt61a f/+ ; Myc OE mice. Data are means +- SD. n = 5 mice per group. Exact P val

- Submitted by
- Invitrogen Antibodies (provider)
- Main image
- Experimental details
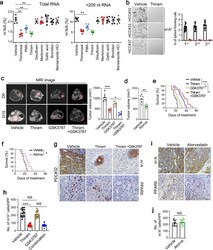
- Fig. 7 TRMT6/TRMT61A complex inhibitor thiram suppresses self-renewal of liver CSCs and tumor growth. a Quantitative LC-MS/MS analysis of m 1 A/A in total RNA and tRNA purified from PLC/PRF/5 cells treated with vehicle or drugs at IC50. Statistical results as means +- SD, n = 5 biologically independent samples. Exact P values from left to right: 0.0048, 0.0086, 0.0037, 0.0090. b Oncosphere forming assays of HCC primary cells following thiram or vehicle treatment. Scale bar, 100 mum. Right panel represents statistical results as means +- SD. n = 15 independent experiments. c Representative magnetic resonance imaging (MRI) images of independent experimental cohorts, of day 0 and day 15 of mice enrolled in treatment with vehicle (DMSO), thiram (1.6 mg kg -1 ), GSK3787 (5 mg kg -1 ) or thiram combined with GSK3787. Red circles and asterisk indicate visible tumor area that was used to calculate tumor volumes. Scale bar, 1 cm. Tumor volumes were calculated on the basis of MRI images from mice bearing liver tumor with a matched initial tumor volume (Right panel). Graph shows means +- SD. n = 6 mice per group. Exact P values from left to right: 0.00065, 0.028. d Tumor volumes were calculated from mice treated with vehicle or atorvastatin (Atorva., 10 mg kg -1 ). Graph shows means +- SD. n = 6 mice per group. Exact P value: 0.0073. e Survival curve derived from mice bearing HCC PDC tumors, treated with vehicle ( n = 11), thiram ( n = 12), GSK3787 ( n = 10), or thiram combined with GSK
