Explore
 Validate
 Learn
Learn Flow cytometry
Antibody data
- Antibody Data
- Antigen structure
- References [12]
- Comments [0]
- Validations
- Flow cytometry [1]
- Other assay [9]
Submit
Validation data
Reference
Comment
Report error
- Product number
- 12-0566-42 - Provider product page

- Provider
- Invitrogen Antibodies
- Product name
- CD56 (NCAM) Monoclonal Antibody (TULY56), PE, eBioscience™
- Antibody type
- Monoclonal
- Antigen
- Other
- Description
- Description: This TULY56 monoclonal antibody reacts with human CD56, also known as Neural Cell Adhesion Molecule (NCAM). CD56 is a highly glycosylated transmembrane molecule expressed by neurons and plays a role in the homotypic adhesion of neural cells. In the hematopoietic system, CD56 is expressed on NK cells and a subset of T cells referred to as NKT cells. Staining with TULY56 does not block binding of CMSSB, suggesting that the two antibodies recognize different epitopes. Additionally, TULY56 performs better after fixation and permeabilization than CMSSB. The TULY56 monoclonal antibody crossreacts with Rhesus macaque. Applications Reported: This TULY56 antibody has been reported for use in flow cytometric analysis. Applications Tested: This TULY56 antibody has been pre-titrated and tested by flow cytometric analysis of normal human peripheral blood cells. This can be used at 5 µL (0.06 µg) per test. A test is defined as the amount (µg) of antibody that will stain a cell sample in a final volume of 100 µL. Cell number should be determined empirically but can range from 10^5 to 10^8 cells/test. Excitation: 488-561 nm; Emission: 578 nm; Laser: Blue Laser, Green Laser, Yellow-Green Laser. Filtration: 0.2 µm post-manufacturing filtered.
- Reactivity
- Human
- Host
- Mouse
- Conjugate
- Yellow dye
- Isotype
- IgG
- Antibody clone number
- TULY56
- Vial size
- 100 Tests
- Concentration
- 5 µL/Test
- Storage
- 4° C, store in dark, DO NOT FREEZE!
Submitted references Endothelial dysfunction markers and immune response indices in cosmonauts' blood after long-duration space flights.
Increased TNF-α Initiates Cytoplasmic Vacuolization in Whole Blood Coculture with Dengue Virus.
Single-cell RNA sequencing reveals ex vivo signatures of SARS-CoV-2-reactive T cells through 'reverse phenotyping'.
Heterogeneous disease-propagating stem cells in juvenile myelomonocytic leukemia.
Development of CAR-T cell therapy for B-ALL using a point-of-care approach.
HDAC Inhibitor, CG-745, Enhances the Anti-Cancer Effect of Anti-PD-1 Immune Checkpoint Inhibitor by Modulation of the Immune Microenvironment.
Myogenic Progenitor Cell Lineage Specification by CRISPR/Cas9-Based Transcriptional Activators.
Single-Cell Analyses Inform Mechanisms of Myeloid-Targeted Therapies in Colon Cancer.
Heterogeneity of human bone marrow and blood natural killer cells defined by single-cell transcriptome.
Engineered triple inhibitory receptor resistance improves anti-tumor CAR-T cell performance via CD56.
Increased Levels of Macrophage Inflammatory Proteins Result in Resistance to R5-Tropic HIV-1 in a Subset of Elite Controllers.
Innate lymphoid cells promote anatomical containment of lymphoid-resident commensal bacteria.
Kuzichkin DS, Nichiporuk IA, Zhuravleva OA, Markin AA, Rykova MP, Zhuravleva TV, Sadova AA, Kutko OV, Shmarov VA, Ponomarev SA
NPJ microgravity 2022 Nov 2;8(1):46
NPJ microgravity 2022 Nov 2;8(1):46
Increased TNF-α Initiates Cytoplasmic Vacuolization in Whole Blood Coculture with Dengue Virus.
Satria RD, Huang TW, Jhan MK, Shen TJ, Tseng PC, Wang YT, Yang ZY, Hsing CH, Lin CF
Journal of immunology research 2021;2021:6654617
Journal of immunology research 2021;2021:6654617
Single-cell RNA sequencing reveals ex vivo signatures of SARS-CoV-2-reactive T cells through 'reverse phenotyping'.
Fischer DS, Ansari M, Wagner KI, Jarosch S, Huang Y, Mayr CH, Strunz M, Lang NJ, D'Ippolito E, Hammel M, Mateyka L, Weber S, Wolff LS, Witter K, Fernandez IE, Leuschner G, Milger K, Frankenberger M, Nowak L, Heinig-Menhard K, Koch I, Stoleriu MG, Hilgendorff A, Behr J, Pichlmair A, Schubert B, Theis FJ, Busch DH, Schiller HB, Schober K
Nature communications 2021 Jul 26;12(1):4515
Nature communications 2021 Jul 26;12(1):4515
Heterogeneous disease-propagating stem cells in juvenile myelomonocytic leukemia.
Louka E, Povinelli B, Rodriguez-Meira A, Buck G, Wen WX, Wang G, Sousos N, Ashley N, Hamblin A, Booth CAG, Roy A, Elliott N, Iskander D, de la Fuente J, Fordham N, O'Byrne S, Inglott S, Norfo R, Salio M, Thongjuea S, Rao A, Roberts I, Mead AJ
The Journal of experimental medicine 2021 Feb 1;218(2)
The Journal of experimental medicine 2021 Feb 1;218(2)
Development of CAR-T cell therapy for B-ALL using a point-of-care approach.
de Macedo Abdo L, Barros LRC, Saldanha Viegas M, Vieira Codeço Marques L, de Sousa Ferreira P, Chicaybam L, Bonamino MH
Oncoimmunology 2020;9(1):1752592
Oncoimmunology 2020;9(1):1752592
HDAC Inhibitor, CG-745, Enhances the Anti-Cancer Effect of Anti-PD-1 Immune Checkpoint Inhibitor by Modulation of the Immune Microenvironment.
Kim YD, Park SM, Ha HC, Lee AR, Won H, Cha H, Cho S, Cho JM
Journal of Cancer 2020;11(14):4059-4072
Journal of Cancer 2020;11(14):4059-4072
Myogenic Progenitor Cell Lineage Specification by CRISPR/Cas9-Based Transcriptional Activators.
Kwon JB, Vankara A, Ettyreddy AR, Bohning JD, Gersbach CA
Stem cell reports 2020 May 12;14(5):755-769
Stem cell reports 2020 May 12;14(5):755-769
Single-Cell Analyses Inform Mechanisms of Myeloid-Targeted Therapies in Colon Cancer.
Zhang L, Li Z, Skrzypczynska KM, Fang Q, Zhang W, O'Brien SA, He Y, Wang L, Zhang Q, Kim A, Gao R, Orf J, Wang T, Sawant D, Kang J, Bhatt D, Lu D, Li CM, Rapaport AS, Perez K, Ye Y, Wang S, Hu X, Ren X, Ouyang W, Shen Z, Egen JG, Zhang Z, Yu X
Cell 2020 Apr 16;181(2):442-459.e29
Cell 2020 Apr 16;181(2):442-459.e29
Heterogeneity of human bone marrow and blood natural killer cells defined by single-cell transcriptome.
Yang C, Siebert JR, Burns R, Gerbec ZJ, Bonacci B, Rymaszewski A, Rau M, Riese MJ, Rao S, Carlson KS, Routes JM, Verbsky JW, Thakar MS, Malarkannan S
Nature communications 2019 Sep 2;10(1):3931
Nature communications 2019 Sep 2;10(1):3931
Engineered triple inhibitory receptor resistance improves anti-tumor CAR-T cell performance via CD56.
Zou F, Lu L, Liu J, Xia B, Zhang W, Hu Q, Liu W, Zhang Y, Lin Y, Jing S, Huang M, Huang B, Liu B, Zhang H
Nature communications 2019 Sep 11;10(1):4109
Nature communications 2019 Sep 11;10(1):4109
Increased Levels of Macrophage Inflammatory Proteins Result in Resistance to R5-Tropic HIV-1 in a Subset of Elite Controllers.
Walker WE, Kurscheid S, Joshi S, Lopez CA, Goh G, Choi M, Barakat L, Francis J, Fisher A, Kozal M, Zapata H, Shaw A, Lifton R, Sutton RE, Fikrig E
Journal of virology 2015 May;89(10):5502-14
Journal of virology 2015 May;89(10):5502-14
Innate lymphoid cells promote anatomical containment of lymphoid-resident commensal bacteria.
Sonnenberg GF, Monticelli LA, Alenghat T, Fung TC, Hutnick NA, Kunisawa J, Shibata N, Grunberg S, Sinha R, Zahm AM, Tardif MR, Sathaliyawala T, Kubota M, Farber DL, Collman RG, Shaked A, Fouser LA, Weiner DB, Tessier PA, Friedman JR, Kiyono H, Bushman FD, Chang KM, Artis D
Science (New York, N.Y.) 2012 Jun 8;336(6086):1321-5
Science (New York, N.Y.) 2012 Jun 8;336(6086):1321-5
No comments: Submit comment
Supportive validation
- Submitted by
- Invitrogen Antibodies (provider)
- Main image

- Experimental details
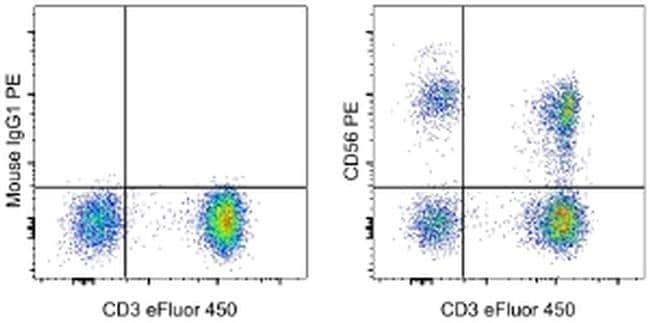
- Staining of normal human peripheral blood cells with Anti-Human CD3 eFluor® 450 (Product # 48-0038-80) and Mouse IgG1 K Isotype Control PE (Product # 12-4714-81) (left) or Anti-Human CD56 (NCAM) PE (right). Cells in the lymphocyte gate were used for analysis.
- Conjugate
- Yellow dye
Supportive validation
- Submitted by
- Invitrogen Antibodies (provider)
- Main image
- Experimental details
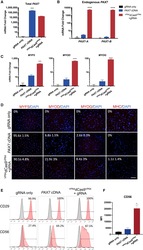
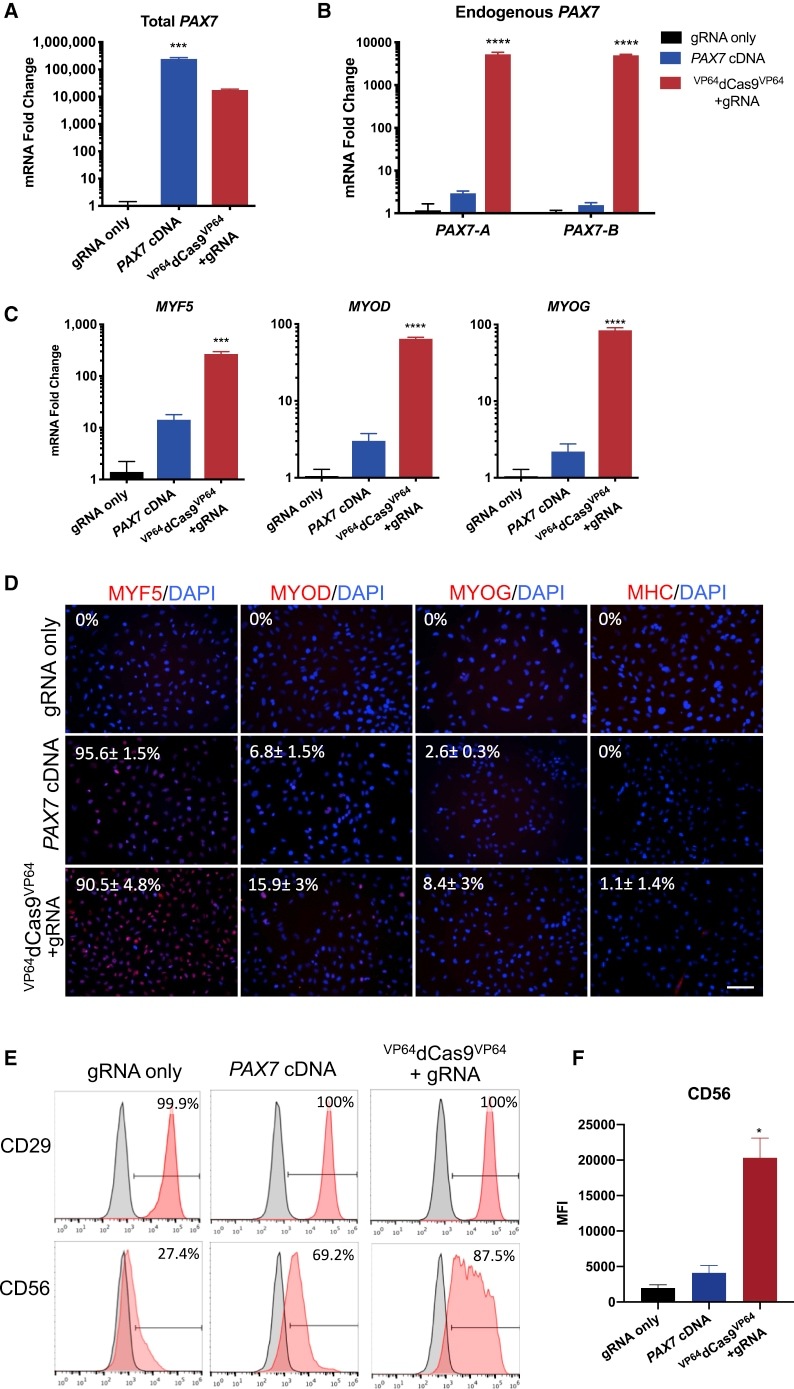
- Figure 2 Characterization of Myogenic Progenitors Derived from iPSCs via VP64 dCas9 VP64 -Mediated Activation of Endogenous PAX7 or Exogenous PAX7 cDNA Expression (A) Relative amounts of total PAX7 mRNA was determined by qRT-PCR using primers complementary to sequences present in the gene body. (B) Endogenous PAX7 mRNA was detected using primers complementary to sequences in the 3' UTR of either isoform PAX7-A or PAX7-B . (C) The mRNA expression levels of myogenic markers MYF5 , MYOD , and MYOG during the expansion phase. (D) Immunofluorescence staining of early and mature myogenic markers MYF5, MYOD, and MYOG, and myosin heavy chain (MHC). (E) Representative FACS analysis of CD29 and CD56 surface marker expression during the expansion phase. (F) Mean fluorescence intensity (MFI) of CD56 staining intensity across treatments. All p values were determined by one-way ANOVA followed by Tukey's post hoc test (mean +- SEM, n = 3 independent replicates).
- Conjugate
- Yellow dye
- Submitted by
- Invitrogen Antibodies (provider)
- Main image
- Experimental details
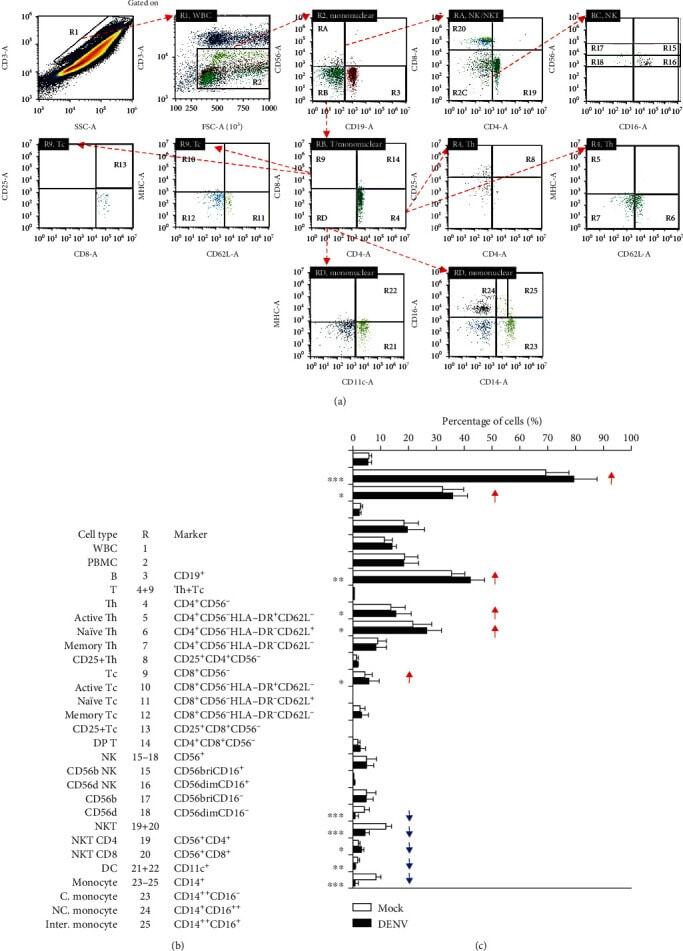
- Figure 4 Immune profiling in DENV-treated whole blood cells 24 h postincubation. Following DENV (MOI = 1) coculture in 100 mu l of WB ex vivo for 24 h, (a) representative flow cytometric analysis and gating of various cells obtained from five cases, performed by staining for specific cell surface markers (CD4, CD8, CD11c, CD14, CD16, CD19, CD25, CD56, CD62L, and HLA-DR), in the DENV-infected and mock groups showed (b) the changes in the expression of specific immune cell populations as noted. (c) The results are shown as a percentage of the mean +- SD obtained from five cases. * p < 0.05, ** p < 0.01, and *** p < 0.001, compared to the mock group. R: region; WBC: white blood cell; bri: bright.
- Conjugate
- Yellow dye
- Submitted by
- Invitrogen Antibodies (provider)
- Main image

- Experimental details
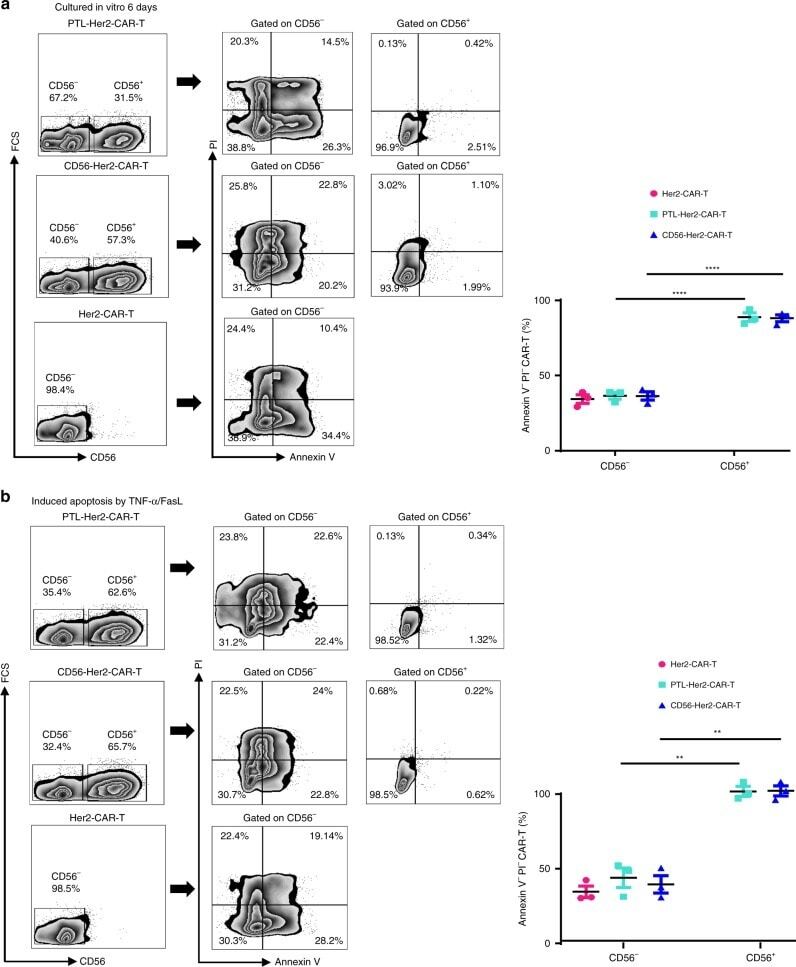
- Fig. 6 CD56 enhanced anti-apoptosis capability of CAR-T cells. a Left panel, the representative flow plots of apoptotic cell proportion in Her2-CAR-T, PTL-Her2-CAR-T, and CD56-Her2-CAR-T cells after culture for 6 days with cytokine deprivation. Right panel, the percentage of Annexin V - and PI - cells gated as in left panel. b Left panel, the representative flow plots of apoptotic cell proportion induced by TNF-alpha and FasL (10 ng ml -1 ) in various CAR-T cells. Right panel, the percentage of Annexin V - and PI - cells gated as in the left panel. ** P < 0.01, **** P < 0.0001 (two-tailed Student's t -test). All presented data summarizes mean +- SEM. Data shown are representative data from three independent experiments. The source data underlying a , b are provided as a Source Data file
- Conjugate
- Yellow dye
- Submitted by
- Invitrogen Antibodies (provider)
- Main image

- Experimental details
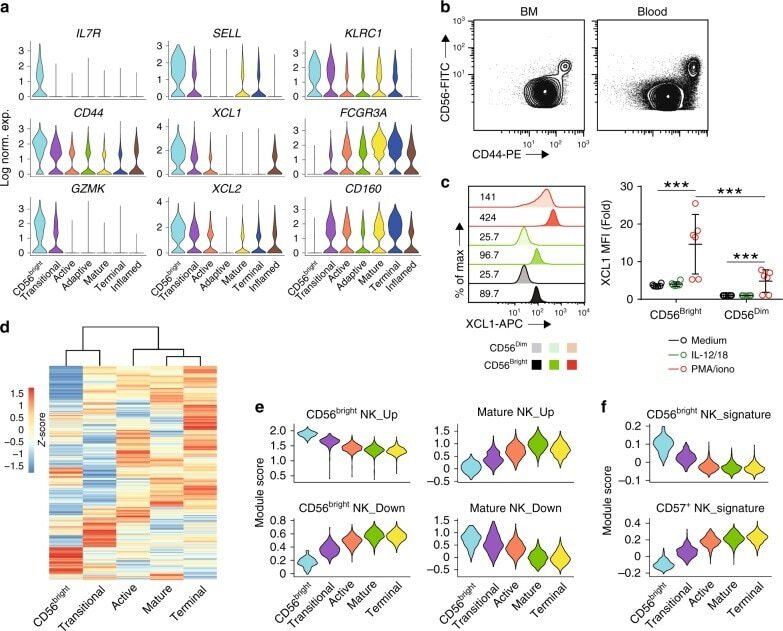
- Fig. 3 Identification of ""CD56 bright NK"" cluster and a potential transitional population between CD56 bright and CD56 dim NK cells. a The expression of genes known to be highly expressed in CD56 bright NK cells was displayed using violin plots of the BM samples. The y -axis represents log-normalized expression value. b The expression of CD56 and CD44 on NK cells from BM (top) or blood (bottom) of healthy donors were assessed via flow cytometry. Representative flow plot gated on Lin - CD56 + cells were shown. n = 5. c The representative histogram plot on the left demonstrates the production of XCL1 from CD56 bright and CD56 dim NK cells stimulated with medium, IL-12, and IL-18 (10/10 ng/mL), or PMA and ionomycin (50/500 ng/mL) for 6 h. The mean fluorescence intensity (MFI) of each condition was normalized to the medium-stimulated CD56 dim NK cells and summarized on the right. n = 6 from three independent experiments. Error bars were shown as standard deviation. Two-way ANOVA was used for the statistical analysis. *** p < 0.001. Source data are provided as a Source Data file. d The transcriptome similarity among clusters of the blood sample was evaluated by the Euclidean distance and visualized via heatmap. Each row represents a variable gene among clusters, and each column represents one cluster. e Module scores were calculated using up-regulated or down-regulated DEGs of ""CD56 bright and Mature NK"" clusters from blood samples and plotted via violin plots. f Bulk RNA-seq-
- Conjugate
- Yellow dye
- Submitted by
- Invitrogen Antibodies (provider)
- Main image

- Experimental details
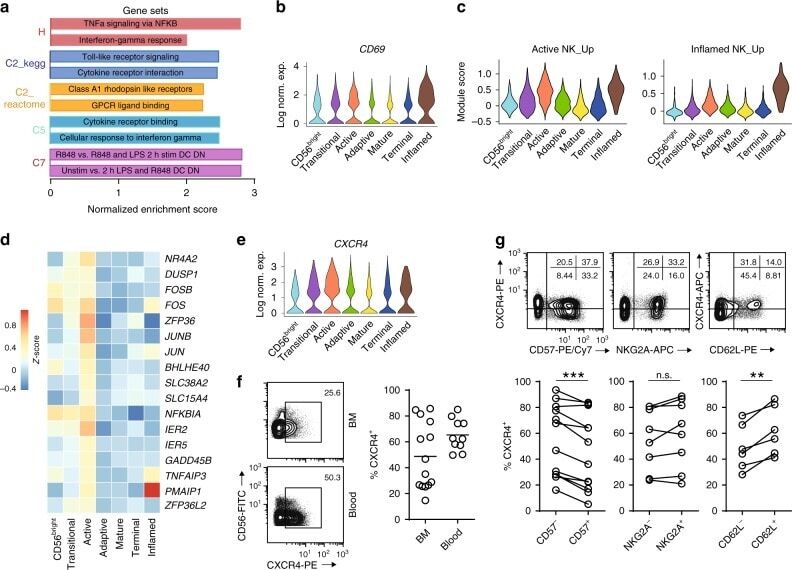
- Fig. 4 Active NK cells with a unique transcriptome profile. a Top two enriched gene sets (ranked by normalized enrichment score) of five different datasets from GSEA of the ""Inflamed NK"" cluster compared to the rest of the cells were plotted. b The expression of CD69 in the BM sample was shown as a violin plot. The y -axis represents log-normalized expression value. c Module score was calculated using up-regulated DEGs of ""Active NK"" (left) or ""Inflamed NK"" (right) cluster from BM sample and plotted via violin plots. d Up-regulated IEGs from ""Active NK"" cluster were plotted using heatmap of the BM sample. e The expression of CXCR4 in the BM sample was shown as a violin plot. The y -axis represents log-normalized expression value. f Percentage of CXCR4 + NK cells (gated on Lin - CD56 + cells) was evaluated via flow cytometry. g The expression of CXCR4 in CD57 +/- , CD62L +/- , or NKG2A +/- CD56 dim NK populations from BM was assessed via flow cytometry (top). Percentage of CXCR4 + cells within each population were quantified (bottom). n >= 6 from two to five independent experiments. Paired Student's t test was used for the statistical analysis. * P < 0.05; ** p < 0.01; *** p < 0.001; n.s. stands for ""not significant."" Source data for f and g are provided as a Source Data file. See also Supplementary Fig. 5
- Conjugate
- Yellow dye
- Submitted by
- Invitrogen Antibodies (provider)
- Main image

- Experimental details
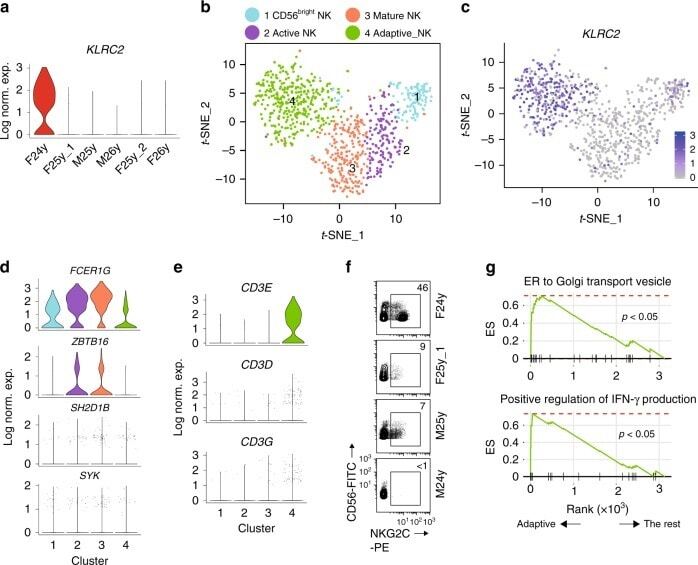
- Fig. 5 Identification of adaptive NK cells from a 24-year-old female donor. a The expression of KLRC2 in each donor cells within the ""Adaptive NK"" cluster were shown in violin plots. The y -axis represents log-normalized expression value. b The t -SNE plot demonstrates four distinct NK clusters from BM of the 24-year-old female donor. c The expression of KLRC2 of the 24-year-old female sample was overlaid on the t -SNE plot. d Violin plots demonstrate the expression of FCER1G , ZBTB16 , SH2D1B , and SYK in four clusters from the 24-year-old female donor sample. The y -axis represents log-normalized expression value. e Violin plots demonstrate the expression of CD3E , CD3D , and CD3G in four clusters from the 24-year-old female donor sample. The y -axis represents log-normalized expression value. f Expression of NKG2C on NK cells (gated on PI - Lin - TCRalpha/beta - TCRgamma/delta - CD56 + cells) was assessed by flow cytometry using cryopreserved samples from four donors. g Selected gene sets enriched in the ""Adaptive NK"" cluster compared to the rest of the cells were plotted. See also Supplementary Fig. 6
- Conjugate
- Yellow dye
- Submitted by
- Invitrogen Antibodies (provider)
- Main image
- Experimental details
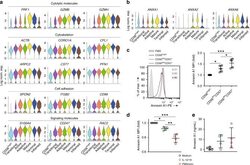
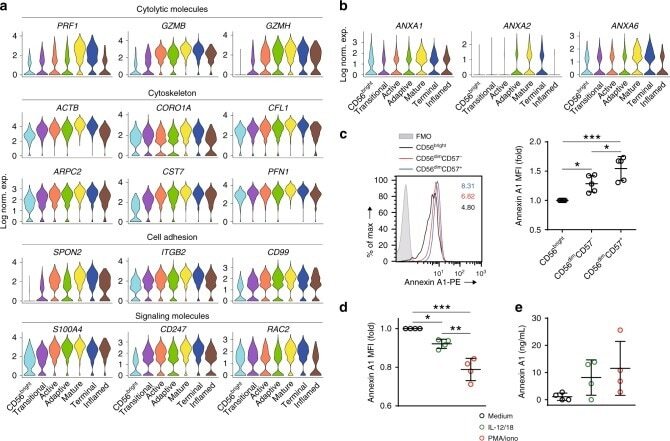
- Fig. 6 Transcriptional signature of functionally mature NK cells. a Representative genes associated with functionally mature NK cells were grouped in four different categories and plotted via violin plots of the BM sample. The y -axis represents log-normalized expression value. b The expression of ANXA1 , ANXA2 , and ANXA6 in each cluster of the blood sample was shown as violin plots. The y -axis represents log-normalized expression value. c The intracellular protein level of Annexin A1 in different NK cell subsets from blood at steady state was assessed by flow cytometry. The representative histogram was shown on the left. FMO stands for fluorescence minus one. The mean fluorescence intensity (MFI) of Annexin A1 in each NK subsets was normalized to CD56 bright NK subset and shown on the right. n = 5 from three independent experiments. Error bars were shown as standard deviation. One-way ANOVA was used for the statistical analysis. * P < 0.05; ** p < 0.01; *** p < 0.001. d Isolated NK cells from blood were stimulated with medium, IL-12, and IL-18 (10/10 ng/mL), or PMA and ionomycin (50/500 ng/mL) for 6 h. The protein level of Annexin A1 was assessed following stimulation. The MFI of Annexin A1 in each condition was normalized to the medium-only NK cells. n = 5 from three independent experiments. Error bars were shown as standard deviation. One-way ANOVA was used for the statistical analysis. * P < 0.05; ** p < 0.01; *** p < 0.001. e Isolated NK cells from blood were stimulate
- Conjugate
- Yellow dye
- Submitted by
- Invitrogen Antibodies (provider)
- Main image

- Experimental details
- Fig. 9 GATA2 mutation results in larger transcriptome alteration in CD56 bright NK cells compared to CD56 dim NK cells. a The blood samples from the GATA2 T354M donor and the healthy control were freshly collected and processed at the same time. Lin - CD56 + NK cells were evaluated via flow cytometry. The CD56 bright NK cells were identified with the help of CD57. b The combined analyses of the blood samples from the GATA2 T354M donor and the two healthy controls resulted in six clusters, as shown in the t -SNE plot. c Composition of the donors within each cluster. The input cell number from each donor is normalized to be equal. d Composition of the clusters within each donor. e Selected gene sets from the GSEA enriched in the Cluster #6 of the GATA T354M donor sample compared to the rest of the cells. f Spearman's correlational matrix was used to compare the average gene expression among each cluster from each donor. g Four of the top 10 up-regulated DEGs of the GATA2 T354M donor NK cells belonged to the GIMAP family and were shown in violin plots. The y -axis represents log-normalized expression value. h The viability of NK cells from the GATA2 T354M donor and the healthy control were evaluated using Annexin V/PI staining. Source data for c and d are provided as a Source Data file. See also Supplementary Fig. 10
- Conjugate
- Yellow dye

- Submitted by
- Invitrogen Antibodies (provider)
- Main image
- Experimental details
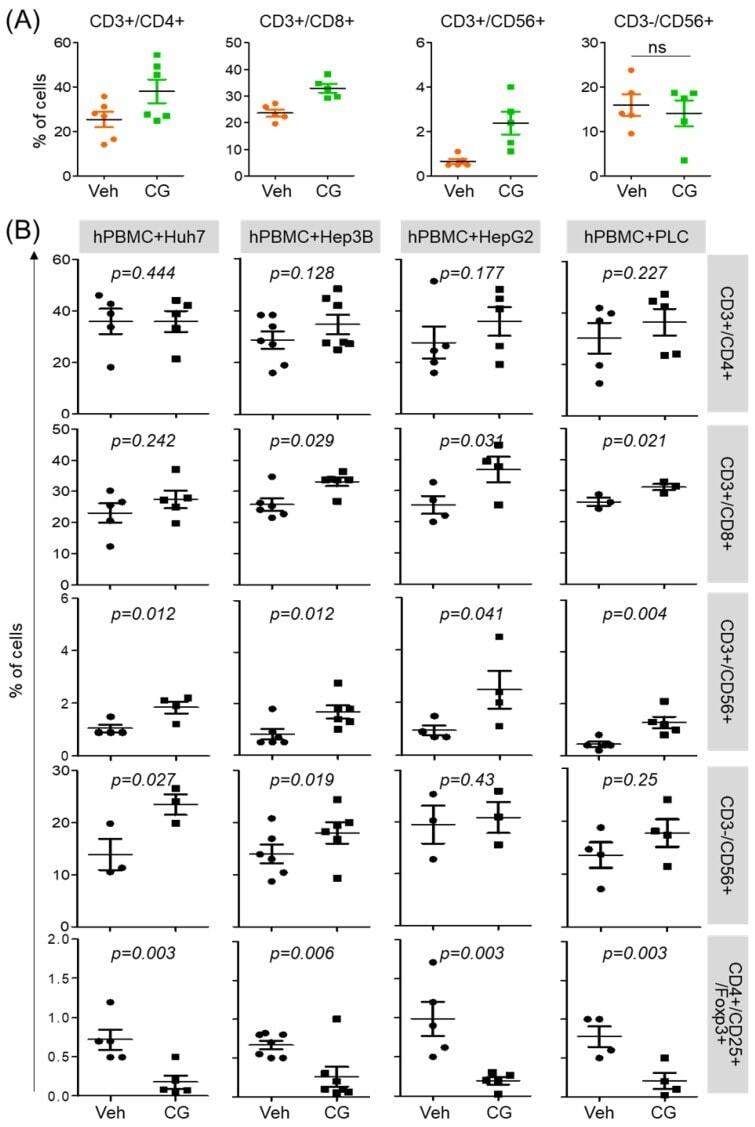
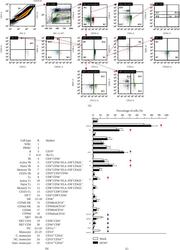
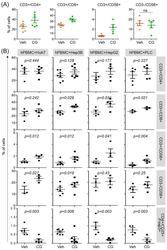
- Figure 3 CG-745 increases helper T cells, cytotoxic T cells and natural killer T cells, and decreases Treg: (A) hPBMCs were incubated with CG (CG-745) for 36 hours and a subset of hPBMCs was analyzed using the antibodies indicated in the text; (B) hPBMCs were co-cultured with Huh7, Hep3B, HepG2 or PLC/PRF/5 cells for 36 hours with or without CG, and a subset of hPBMCs was analyzed by Attune Nxt (Invitrogen, USA).
- Conjugate
- Yellow dye