Explore
 Validate
 Learn
Learn Western blot
Antibody data
- Antibody Data
- Antigen structure
- References [8]
- Comments [0]
- Validations
- Western blot [2]
- Immunocytochemistry [7]
- Immunohistochemistry [5]
- Flow cytometry [6]
- Other assay [1]
Submit
Validation data
Reference
Comment
Report error
- Product number
- MA5-11563 - Provider product page

- Provider
- Invitrogen Antibodies
- Product name
- CD56 Monoclonal Antibody (56C04)
- Antibody type
- Monoclonal
- Antigen
- Other
- Description
- MA5-11563 targets CD56 in IHC (P), Western blot, ICC/IF and FACS applications and shows reactivity with Human and Rat samples. The MA5-11563 immunogen is membrane preparation of a small cell lung carcinoma.
- Reactivity
- Human, Rat
- Host
- Mouse
- Isotype
- IgG
- Antibody clone number
- 56C04
- Vial size
- 500 μL
- Concentration
- 0.2 mg/mL
- Storage
- 4°C
Submitted references Induction of muscle-regenerative multipotent stem cells from human adipocytes by PDGF-AB and 5-azacytidine.
Tumor immune microenvironment characterization in clear cell renal cell carcinoma identifies prognostic and immunotherapeutically relevant messenger RNA signatures.
Early reversal cells in adult human bone remodeling: osteoblastic nature, catabolic functions and interactions with osteoclasts.
Clinicopathological characteristics of kidney mucinous tubular and spindle cell carcinoma.
Increased presence of capillaries next to remodeling sites in adult human cancellous bone.
Pigmented paraganglioma of the kidney: a case report.
Hepatosplenic gammadelta T-cell lymphoma with ring chromosome 7, an isochromosome 7q equivalent clonal chromosomal aberration.
Isolated idiopathic bile ductular hyperplasia in patients with persistently abnormal liver function tests.
Yeola A, Subramanian S, Oliver RA, Lucas CA, Thoms JAI, Yan F, Olivier J, Chacon D, Tursky ML, Srivastava P, Potas JR, Hung T, Power C, Hardy P, Ma DD, Kilian KA, McCarroll J, Kavallaris M, Hesson LB, Beck D, Curtis DJ, Wong JWH, Hardeman EC, Walsh WR, Mobbs R, Chandrakanthan V, Pimanda JE
Science advances 2021 Jan;7(3)
Science advances 2021 Jan;7(3)
Tumor immune microenvironment characterization in clear cell renal cell carcinoma identifies prognostic and immunotherapeutically relevant messenger RNA signatures.
Şenbabaoğlu Y, Gejman RS, Winer AG, Liu M, Van Allen EM, de Velasco G, Miao D, Ostrovnaya I, Drill E, Luna A, Weinhold N, Lee W, Manley BJ, Khalil DN, Kaffenberger SD, Chen Y, Danilova L, Voss MH, Coleman JA, Russo P, Reuter VE, Chan TA, Cheng EH, Scheinberg DA, Li MO, Choueiri TK, Hsieh JJ, Sander C, Hakimi AA
Genome biology 2016 Nov 17;17(1):231
Genome biology 2016 Nov 17;17(1):231
Early reversal cells in adult human bone remodeling: osteoblastic nature, catabolic functions and interactions with osteoclasts.
Abdelgawad ME, Delaisse JM, Hinge M, Jensen PR, Alnaimi RW, Rolighed L, Engelholm LH, Marcussen N, Andersen TL
Histochemistry and cell biology 2016 Jun;145(6):603-15
Histochemistry and cell biology 2016 Jun;145(6):603-15
Clinicopathological characteristics of kidney mucinous tubular and spindle cell carcinoma.
Chen Q, Gu Y, Liu B
International journal of clinical and experimental pathology 2015;8(1):1007-12
International journal of clinical and experimental pathology 2015;8(1):1007-12
Increased presence of capillaries next to remodeling sites in adult human cancellous bone.
Kristensen HB, Andersen TL, Marcussen N, Rolighed L, Delaisse JM
Journal of bone and mineral research : the official journal of the American Society for Bone and Mineral Research 2013 Mar;28(3):574-85
Journal of bone and mineral research : the official journal of the American Society for Bone and Mineral Research 2013 Mar;28(3):574-85
Pigmented paraganglioma of the kidney: a case report.
Zhao L, Luo J, Zhang H, Da J
Diagnostic pathology 2012 Jun 28;7:77
Diagnostic pathology 2012 Jun 28;7:77
Hepatosplenic gammadelta T-cell lymphoma with ring chromosome 7, an isochromosome 7q equivalent clonal chromosomal aberration.
Tamaska J, Adam E, Kozma A, Gopcsa L, Andrikovics H, Tordai A, Halm G, Bereczki L, Bagdi E, Krenacs L
Virchows Archiv : an international journal of pathology 2006 Oct;449(4):479-83
Virchows Archiv : an international journal of pathology 2006 Oct;449(4):479-83
Isolated idiopathic bile ductular hyperplasia in patients with persistently abnormal liver function tests.
Sonzogni A, Colloredo G, Fabris L, Cadamuro M, Paris B, Roffi L, Pozzi M, Bovo G, Del Poggio P, Portmann BC, Strazzabosco M
Journal of hepatology 2004 Apr;40(4):592-8
Journal of hepatology 2004 Apr;40(4):592-8
No comments: Submit comment
Supportive validation
- Submitted by
- Invitrogen Antibodies (provider)
- Main image
- Experimental details
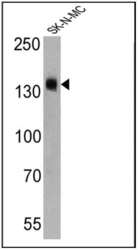
- Western blot analysis of CD56 was performed by loading 25 µg of SK-N-MC cell lysates onto an SDS polyacrylamide gel. Proteins were transferred to a PVDF membrane and blocked at 4ºC overnight. The membrane was probed with a CD56 monoclonal antibody (Product # MA5-11563) at a dilution of 1:200 overnight at 4°C, washed in TBST, and probed with an HRP-conjugated secondary antibody for 1 hr at room temperature in the dark. Chemiluminescent detection was performed using Pierce ECL Plus Western Blotting Substrate (Product # 32132). Results show a band at approx. 140 kDa.

- Submitted by
- Invitrogen Antibodies (provider)
- Main image
- Experimental details
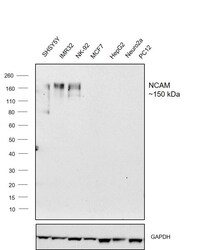
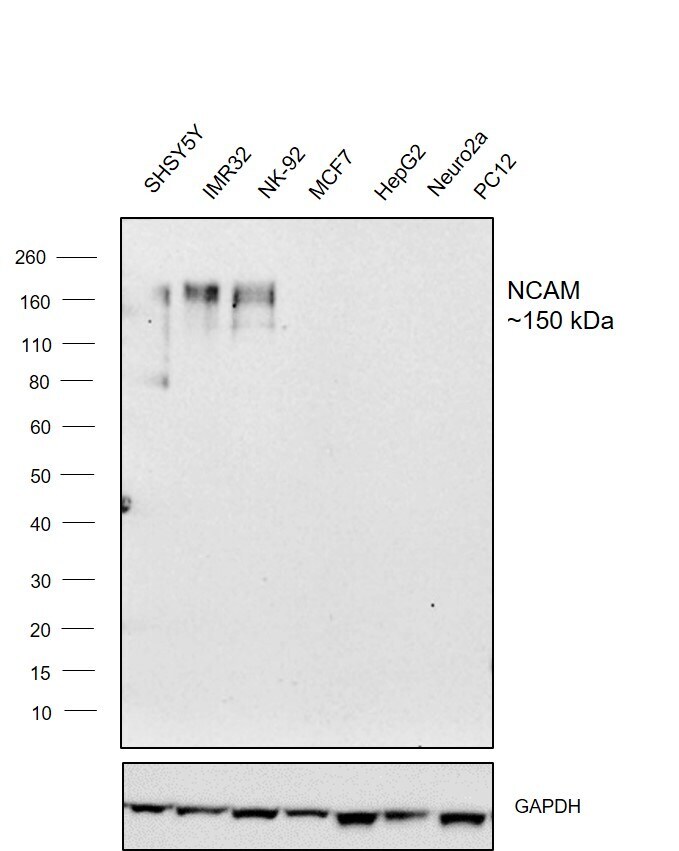
- Western blot was performed using Anti-CD56 (NCAM) Monoclonal Antibody (56C04), (Product # MA5-11563) and ~150 kDa band corresponding to NCAM was observed across cell lines tested except in MCF7, HepG2, Neuro2a and PC12 which are reported to be negative. Whole cell extracts (30 µg lysate) of SHSY5Y (Lane 1), IMR32 (Lane 2), NK-92 (Lane 3), MCF7 (Lane 4), HepG2 (Lane 5), Neuro2a (Lane 6) and PC12 (Lane 7) were electrophoresed using Novex® NuPAGE® 4-12 % Bis-Tris gel (Product # NP0321BOX). Resolved proteins were then transferred onto a nitrocellulose membrane (Product # IB23001) by iBlot® 2 Dry Blotting System (Product # IB21001). The blots were probed with the primary antibody (4 µg/mL) and detected by chemiluminescence with Goat anti-Mouse IgG (H+L), Superclonal™ Recombinant Secondary Antibody, HRP conjugate (Product # A28177, 1:4000 dilution) using the iBright FL 1000 (Product # A32752). Chemiluminescent detection was performed using Super Signal™ West Dura Extended Duration Substrate (Product # 34076).
Supportive validation
- Submitted by
- Invitrogen Antibodies (provider)
- Main image

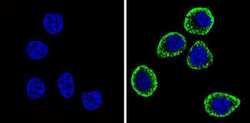
- Experimental details
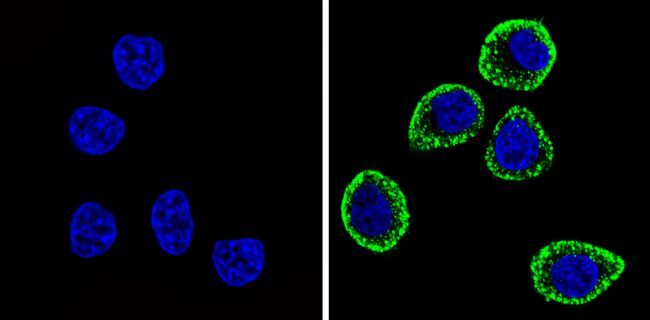
- Immunofluorescent analysis of CD56 (green) showing staining in the cytoplasm and membrane of SH-SY5Y cells (right) compared to a negative control without primary antibody (left). Formalin-fixed cells were permeabilized with 0.1% Triton X-100 in TBS for 5-10 minutes and blocked with 3% BSA-PBS for 30 minutes at room temperature. Cells were probed with a CD56 monoclonal antibody (Product # MA5-11563) in 3% BSA-PBS at a dilution of 1:100 and incubated overnight at 4 ºC in a humidified chamber. Cells were washed with PBST and incubated with a DyLight-conjugated secondary antibody in PBS at room temperature in the dark. F-actin (red) was stained with a fluorescent red phalloidin and nuclei (blue) were stained with Hoechst or DAPI. Images were taken at a magnification of 60x.

- Submitted by
- Invitrogen Antibodies (provider)
- Main image
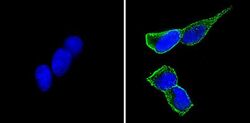
- Experimental details
- Immunofluorescent analysis of CD56 (green) showing staining in the cytoplasm and membrane of U251 cells (right) compared to a negative control without primary antibody (left). Formalin-fixed cells were permeabilized with 0.1% Triton X-100 in TBS for 5-10 minutes and blocked with 3% BSA-PBS for 30 minutes at room temperature. Cells were probed with a CD56 monoclonal antibody (Product # MA5-11563) in 3% BSA-PBS at a dilution of 1:100 and incubated overnight at 4 ºC in a humidified chamber. Cells were washed with PBST and incubated with a DyLight-conjugated secondary antibody in PBS at room temperature in the dark. F-actin (red) was stained with a fluorescent red phalloidin and nuclei (blue) were stained with Hoechst or DAPI. Images were taken at a magnification of 60x.

- Submitted by
- Invitrogen Antibodies (provider)
- Main image

- Experimental details
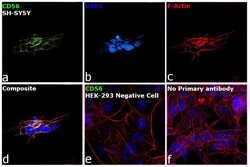
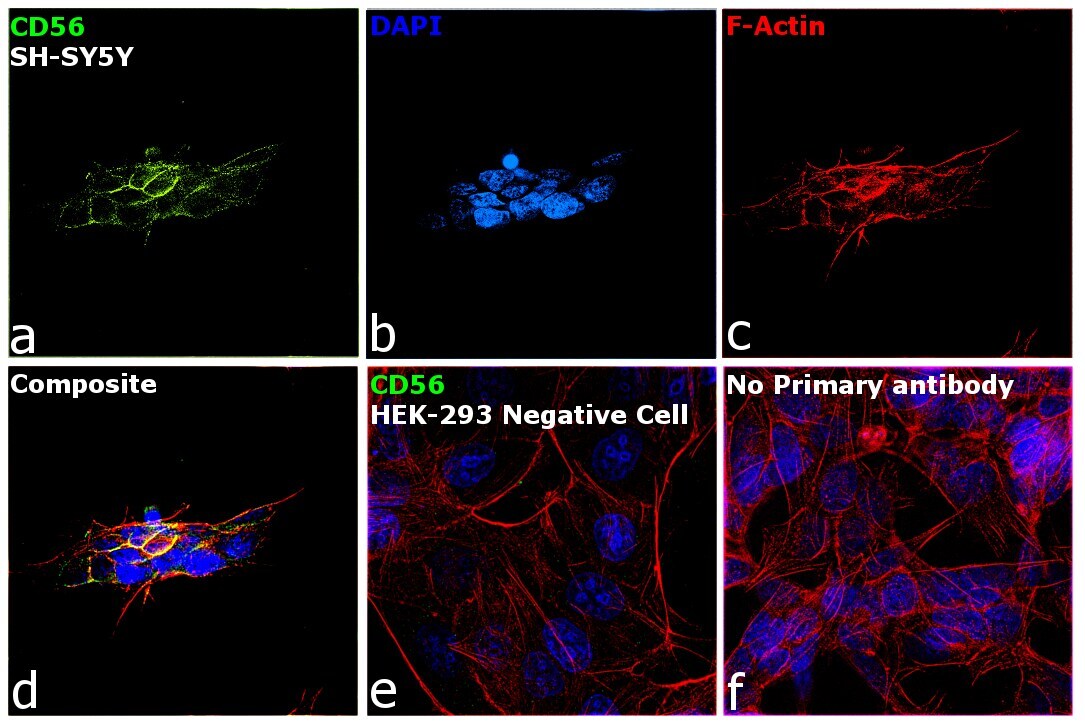
- Immunofluorescence analysis of CD56 was performed using 70% confluent log phase SH-SY5Y and HEK-293 cells. The cells were fixed with 4% paraformaldehyde for 10 minutes, permeabilized with 0.1% Triton™ X-100 for 15 minutes, and blocked with 2% BSA for 1 hour at room temperature. The cells were labeled with CD56 Monoclonal Antibody (56C04) (Product # MA5-11563) at 1:100 dilution in 0.1% BSA, incubated at 4 degree Celsius overnight and then labeled with Donkey anti-Mouse IgG (H+L) Highly Cross-Adsorbed Secondary Antibody, Alexa Fluor Plus 488 (Product # A32766) at a dilution of 1:2000 for 45 minutes at room temperature (Panel a: green). Nuclei (Panel b: blue) were stained with SlowFade® Gold Antifade Mountant with DAPI (Product # S36938). F-actin (Panel c: red) was stained with Rhodamine Phalloidin (Product # R415, 1:300). Panel d represents the merged image showing localization to plasma membrane. Panel e shows HEK-293 cells with no expression of CD56. Panel f represents control cells with no primary antibody to assess background. The images were captured at 60X magnification.

- Submitted by
- Invitrogen Antibodies (provider)
- Main image
- Experimental details
- Immunofluorescent analysis of CD56 (green) showing staining in the cytoplasm and membrane of SH-SY5Y cells (right) compared to a negative control without primary antibody (left). Formalin-fixed cells were permeabilized with 0.1% Triton X-100 in TBS for 5-10 minutes and blocked with 3% BSA-PBS for 30 minutes at room temperature. Cells were probed with a CD56 monoclonal antibody (Product # MA5-11563) in 3% BSA-PBS at a dilution of 1:100 and incubated overnight at 4 ºC in a humidified chamber. Cells were washed with PBST and incubated with a DyLight-conjugated secondary antibody in PBS at room temperature in the dark. F-actin (red) was stained with a fluorescent red phalloidin and nuclei (blue) were stained with Hoechst or DAPI. Images were taken at a magnification of 60x.

- Submitted by
- Invitrogen Antibodies (provider)
- Main image
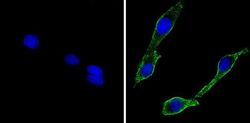
- Experimental details
- Immunofluorescent analysis of CD56 (green) showing staining in the cytoplasm and membrane of C6 cells (right) compared to a negative control without primary antibody (left). Formalin-fixed cells were permeabilized with 0.1% Triton X-100 in TBS for 5-10 minutes and blocked with 3% BSA-PBS for 30 minutes at room temperature. Cells were probed with a CD56 monoclonal antibody (Product # MA5-11563) in 3% BSA-PBS at a dilution of 1:100 and incubated overnight at 4 ºC in a humidified chamber. Cells were washed with PBST and incubated with a DyLight-conjugated secondary antibody in PBS at room temperature in the dark. F-actin (red) was stained with a fluorescent red phalloidin and nuclei (blue) were stained with Hoechst or DAPI. Images were taken at a magnification of 60x.
- Submitted by
- Invitrogen Antibodies (provider)
- Main image

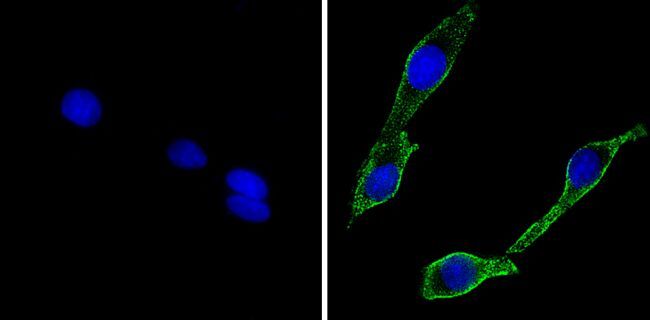
- Experimental details
- Immunofluorescent analysis of CD56 (green) showing staining in the cytoplasm and membrane of U251 cells (right) compared to a negative control without primary antibody (left). Formalin-fixed cells were permeabilized with 0.1% Triton X-100 in TBS for 5-10 minutes and blocked with 3% BSA-PBS for 30 minutes at room temperature. Cells were probed with a CD56 monoclonal antibody (Product # MA5-11563) in 3% BSA-PBS at a dilution of 1:100 and incubated overnight at 4 ºC in a humidified chamber. Cells were washed with PBST and incubated with a DyLight-conjugated secondary antibody in PBS at room temperature in the dark. F-actin (red) was stained with a fluorescent red phalloidin and nuclei (blue) were stained with Hoechst or DAPI. Images were taken at a magnification of 60x.
- Submitted by
- Invitrogen Antibodies (provider)
- Main image
- Experimental details
- Immunofluorescence analysis of CD56 was performed using 70% confluent log phase SH-SY5Y and HEK-293 cells. The cells were fixed with 4% paraformaldehyde for 10 minutes, permeabilized with 0.1% Triton™ X-100 for 15 minutes, and blocked with 2% BSA for 1 hour at room temperature. The cells were labeled with CD56 Monoclonal Antibody (56C04) (Product # MA5-11563) at 1:100 dilution in 0.1% BSA, incubated at 4 degree Celsius overnight and then labeled with Donkey anti-Mouse IgG (H+L) Highly Cross-Adsorbed Secondary Antibody, Alexa Fluor Plus 488 (Product # A32766) at a dilution of 1:2000 for 45 minutes at room temperature (Panel a: green). Nuclei (Panel b: blue) were stained with SlowFade® Gold Antifade Mountant with DAPI (Product # S36938). F-actin (Panel c: red) was stained with Rhodamine Phalloidin (Product # R415, 1:300). Panel d represents the merged image showing localization to plasma membrane. Panel e shows HEK-293 cells with no expression of CD56. Panel f represents control cells with no primary antibody to assess background. The images were captured at 60X magnification.
Supportive validation
- Submitted by
- Invitrogen Antibodies (provider)
- Main image
- Experimental details
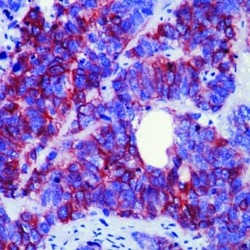
- Formalin-fixed, paraffin-embedded human neuroblastoma stained with CD56 antibody using peroxidase-conjugate and AEC chromogen. Note cell membrane staining of tumor cells.

- Submitted by
- Invitrogen Antibodies (provider)
- Main image
- Experimental details
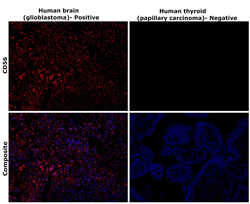
- Immunohistochemical analysis of CD56 (NCAM) was performed using formalin-fixed paraffin-embedded human brain (glioblastoma) and human thyroid (papillary carcinoma) tissue sections. To expose the target protein, heat-induced epitope retrieval was performed on de-paraffinized sections using eBioscience™ IHC Antigen Retrieval Solution - High pH (10X) (Product # 00-4956-58) diluted to 1X solution in water in a decloaking chamber at 110 degree Celsius for 15 minutes. Following antigen retrieval, the sections were blocked with 3% H2O2 for 1 hour at room temperature followed by 2% normal goat serum in 1X PBS for 45 minutes at room temperature and then probed with CD56 Monoclonal Antibody (56C04) (Product # MA5-11563) at 0.4 µg/mL in 0.1% normal goat serum overnight at 4 degree Celsius in a humidified chamber. Detection was performed using Alexa Fluor™ 647 Tyramide SuperBoost™ Kit, goat anti-mouse IgG (Product # B40916). Nuclei were stained with DAPI (Product # D1306) and the sections were mounted using ProLong™ Glass Antifade Mountant (Product # P36984). The images were captured on EVOS™ M7000 Imaging System (Product # AMF7000) at 20X magnification and externally deconvoluted.

- Submitted by
- Invitrogen Antibodies (provider)
- Main image
- Experimental details
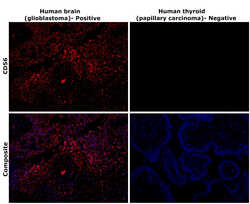
- Immunohistochemical analysis of CD56 (NCAM) was performed using formalin-fixed paraffin-embedded human brain (glioblastoma) and human thyroid (papillary carcinoma) tissue sections. To expose the target protein, heat-induced epitope retrieval was performed on de-paraffinized sections using eBioscience™ IHC Antigen Retrieval Solution - High pH (10X) (Product # 00-4956-58) diluted to 1X solution in water in a decloaking chamber at 110 degree Celsius for 15 minutes. Following antigen retrieval, the sections were blocked with 3% H2O2 for 1 hour at room temperature followed by 2% normal goat serum in 1X PBS for 45 minutes at room temperature and then probed with CD56 Monoclonal Antibody (56C04) (Product # MA5-11563) at 0.4 µg/mL in 0.1% normal goat serum overnight at 4 degree Celsius in a humidified chamber. Detection was performed using Alexa Fluor™ 647 Tyramide SuperBoost™ Kit, goat anti-mouse IgG (Product # B40916). Nuclei were stained with DAPI (Product # D1306) and the sections were mounted using ProLong™ Glass Antifade Mountant (Product # P36984). The images were captured on EVOS™ M7000 Imaging System (Product # AMF7000) at 20X magnification and externally deconvoluted.

- Submitted by
- Invitrogen Antibodies (provider)
- Main image
- Experimental details
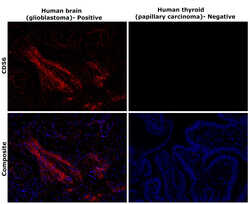
- Immunohistochemical analysis of CD56 (NCAM) was performed using formalin-fixed paraffin-embedded human brain (glioblastoma) and human thyroid (papillary carcinoma) tissue sections. To expose the target protein, heat-induced epitope retrieval was performed on de-paraffinized sections using eBioscience™ IHC Antigen Retrieval Solution - Low pH (10X) (Product # 00-4955-58) diluted to 1X solution in water in a decloaking chamber at 110 degree Celsius for 15 minutes. Following antigen retrieval, the sections were blocked with 3% H2O2 for 1 hour at room temperature followed by 2% normal goat serum in 1X PBS for 45 minutes at room temperature and then probed with CD56 Monoclonal Antibody (56C04) (Product # MA5-11563) at 0.4 µg/mL in 0.1% normal goat serum overnight at 4 degree Celsius in a humidified chamber. Detection was performed using Alexa Fluor™ 647 Tyramide SuperBoost™ Kit, goat anti-mouse IgG (Product # B40916). Nuclei were stained with DAPI (Product # D1306) and the sections were mounted using ProLong™ Glass Antifade Mountant (Product # P36984). The images were captured on EVOS™ M7000 Imaging System (Product # AMF7000) at 20X magnification and externally deconvoluted.

- Submitted by
- Invitrogen Antibodies (provider)
- Main image
- Experimental details
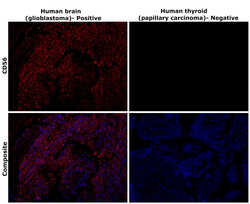
- Immunohistochemical analysis of CD56 (NCAM) was performed using formalin-fixed paraffin-embedded human brain (glioblastoma) and human thyroid (papillary carcinoma) tissue sections. To expose the target protein, heat-induced epitope retrieval was performed on de-paraffinized sections using eBioscience™ IHC Antigen Retrieval Solution - Low pH (10X) (Product # 00-4955-58) diluted to 1X solution in water in a decloaking chamber at 110 degree Celsius for 15 minutes. Following antigen retrieval, the sections were blocked with 3% H2O2 for 1 hour at room temperature followed by 2% normal goat serum in 1X PBS for 45 minutes at room temperature and then probed with CD56 Monoclonal Antibody (56C04) (Product # MA5-11563) at 0.4 µg/mL in 0.1% normal goat serum overnight at 4 degree Celsius in a humidified chamber. Detection was performed using Alexa Fluor™ 647 Tyramide SuperBoost™ Kit, goat anti-mouse IgG (Product # B40916). Nuclei were stained with DAPI (Product # D1306) and the sections were mounted using ProLong™ Glass Antifade Mountant (Product # P36984). The images were captured on EVOS™ M7000 Imaging System (Product # AMF7000) at 20X magnification and externally deconvoluted.

Supportive validation
- Submitted by
- Invitrogen Antibodies (provider)
- Main image
- Experimental details
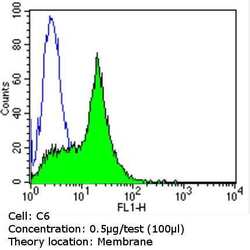
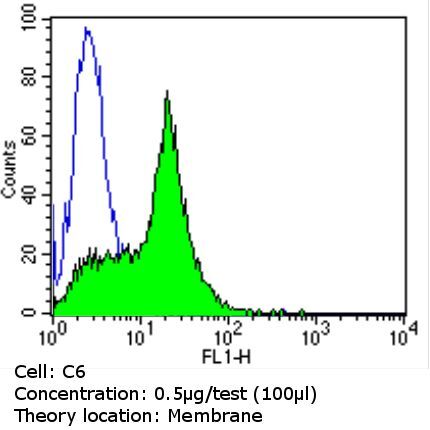
- Flow cytometry analysis of CD56 in C6 cells (green) compared to an isotype control (blue). Cells were harvested, adjusted to a concentration of 1-5x10^6 cells/mL, fixed with 2% paraformaldehyde and washed with PBS. Cells were blocked with a 2% solution of BSA-PBS for 30 min at room temperature and incubated with a CD56 monoclonal antibody (Product # MA5-11563) at a dilution of 0.5 µg/test for 60 min at room temperature. Cells were then incubated for 40 min at room temperature in the dark using a Dylight 488-conjugated goat anti-mouse IgG (H+L) secondary antibody and re-suspended in PBS for FACS analysis.

- Submitted by
- Invitrogen Antibodies (provider)
- Main image
- Experimental details
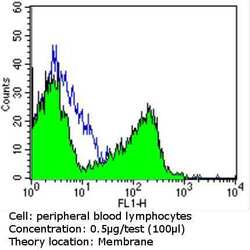
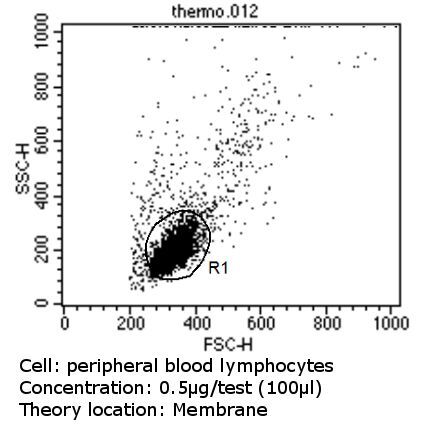
- Flow cytometry analysis of CD56 in PBMC cells (green) compared to an isotype control (blue). Human blood was collected, combined with a hydrophilic polysaccharide, centrifuged, transferred to a conical tube and washed with PBS. 50 µL of cell solution was added to each tube at a dilution of 2x10^7 cells/mL, followed by the addition of 50 µL of isotype control and primary antibody (Product # MA5-11563) at a dilution of 0.5 µg/test. Cells were incubated for 30 min at 4ºC and washed with a cell buffer, followed by incubation with a DyLight 488-conjugated goat anti-mouse IgG (H+L) secondary for 30 min at 4ºC in the dark. FACS analysis was performed using 400 µL of cell buffer.

- Submitted by
- Invitrogen Antibodies (provider)
- Main image
- Experimental details
- Flow cytometry analysis of CD56 in PBMC cells (green) compared to an isotype control (blue). Human blood was collected, combined with a hydrophilic polysaccharide, centrifuged, transferred to a conical tube and washed with PBS. 50 µL of cell solution was added to each tube at a dilution of 2x10^7 cells/mL, followed by the addition of 50 µL of isotype control and primary antibody (Product # MA5-11563) at a dilution of 0.5 µg/test. Cells were incubated for 30 min at 4ºC and washed with a cell buffer, followed by incubation with a DyLight 488-conjugated goat anti-mouse IgG (H+L) secondary for 30 min at 4ºC in the dark. FACS analysis was performed using 400 µL of cell buffer.

- Submitted by
- Invitrogen Antibodies (provider)
- Main image

- Experimental details
- Flow cytometry analysis of CD56 in C6 cells (green) compared to an isotype control (blue). Cells were harvested, adjusted to a concentration of 1-5x10^6 cells/mL, fixed with 2% paraformaldehyde and washed with PBS. Cells were blocked with a 2% solution of BSA-PBS for 30 min at room temperature and incubated with a CD56 monoclonal antibody (Product # MA5-11563) at a dilution of 0.5 µg/test for 60 min at room temperature. Cells were then incubated for 40 min at room temperature in the dark using a Dylight 488-conjugated goat anti-mouse IgG (H+L) secondary antibody and re-suspended in PBS for FACS analysis.
- Submitted by
- Invitrogen Antibodies (provider)
- Main image

- Experimental details
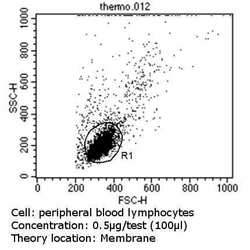
- Flow cytometry analysis of CD56 in PBMC cells (green) compared to an isotype control (blue). Human blood was collected, combined with a hydrophilic polysaccharide, centrifuged, transferred to a conical tube and washed with PBS. 50 µL of cell solution was added to each tube at a dilution of 2x10^7 cells/mL, followed by the addition of 50 µL of isotype control and primary antibody (Product # MA5-11563) at a dilution of 0.5 µg/test. Cells were incubated for 30 min at 4ºC and washed with a cell buffer, followed by incubation with a DyLight 488-conjugated goat anti-mouse IgG (H+L) secondary for 30 min at 4ºC in the dark. FACS analysis was performed using 400 µL of cell buffer.

- Submitted by
- Invitrogen Antibodies (provider)
- Main image

- Experimental details
- Flow cytometry analysis of CD56 in PBMC cells (green) compared to an isotype control (blue). Human blood was collected, combined with a hydrophilic polysaccharide, centrifuged, transferred to a conical tube and washed with PBS. 50 µL of cell solution was added to each tube at a dilution of 2x10^7 cells/mL, followed by the addition of 50 µL of isotype control and primary antibody (Product # MA5-11563) at a dilution of 0.5 µg/test. Cells were incubated for 30 min at 4ºC and washed with a cell buffer, followed by incubation with a DyLight 488-conjugated goat anti-mouse IgG (H+L) secondary for 30 min at 4ºC in the dark. FACS analysis was performed using 400 µL of cell buffer.
Supportive validation
- Submitted by
- Invitrogen Antibodies (provider)
- Main image
- Experimental details
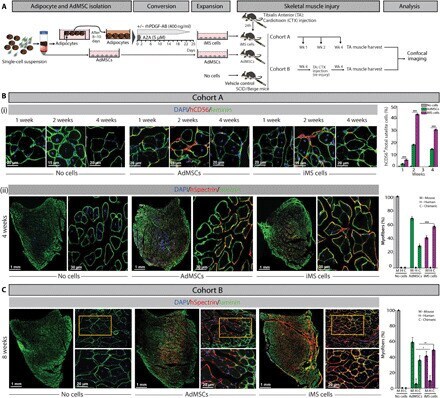
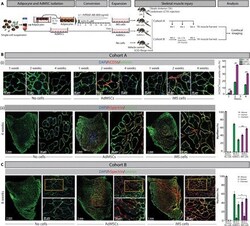
- Fig. 4 Regenerative potential of human iMS cells in a skeletal muscle injury model. ( A ) Generation of iMS and AdMSCs and their assessment in TA muscle injury model. ( B ) (i) Confocal images of TA muscle stained for human CD56 + satellite cells (red) and laminin basement membrane protein (green; mouse/human). Graph shows donor hCD56 + satellite cell fraction for each treatment group. (ii) Confocal images of TA muscle harvested at 4 weeks and stained for human spectrin (red) and laminin (green; mouse/human). For each treatment, the left panel shows a tile scan of the TA muscle and the right panel a high magnification confocal image. Graph shows contribution of mouse (M), human (H), or chimeric (C) myofibers in three to five serial TA muscle sections per mouse ( n = 3 mice per treatment group). ( C ) Confocal images of TA muscle 4 weeks following re-injury with CTX, stained for human spectrin (red) and laminin (green; mouse/human). For each treatment, left panel shows a tile scan of the TA muscle, upper right panel a low-magnification image, and lower right panel a high magnification image of the area boxed above. Graph shows contribution of mouse (M), human (H), or chimeric (C) myofibers in three to five serial TA muscle sections per mouse ( n = 3 mice per treatment group). Graph bars indicate confidence interval. * P < 0.05, ** P < 0.01, and *** P < 0.001 (linear mixed model). Photo credit: Avani Yeola, UNSW Sydney.