Explore
 Validate
 Learn
Learn Immunocytochemistry
Antibody data
- Antibody Data
- Antigen structure
- References [1]
- Comments [0]
- Validations
- Immunocytochemistry [1]
- Other assay [1]
Submit
Validation data
Reference
Comment
Report error
- Product number
- PA5-65975 - Provider product page

- Provider
- Invitrogen Antibodies
- Product name
- RPS26 Polyclonal Antibody
- Antibody type
- Polyclonal
- Antigen
- Recombinant full-length protein
- Description
- Immunogen sequence: VPKDKAIKKFV IRNIVEAAAV RDISEASVFD AYVLPKLYVK LHYCVSCAIH SKVVRNRSRE ARKDRTPPPR FRPAGA Highest antigen sequence identity to the following orthologs - mouse 100%, rat 100%.
- Reactivity
- Human
- Host
- Rabbit
- Isotype
- IgG
- Vial size
- 100 µL
- Concentration
- 0.1 mg/mL
- Storage
- Store at 4°C short term. For long term storage, store at -20°C, avoiding freeze/thaw cycles.
Submitted references Electron cryo-tomography reveals the subcellular architecture of growing axons in human brain organoids.
Hoffmann PC, Giandomenico SL, Ganeva I, Wozny MR, Sutcliffe M, Lancaster MA, Kukulski W
eLife 2021 Oct 26;10
eLife 2021 Oct 26;10
No comments: Submit comment
Supportive validation
- Submitted by
- Invitrogen Antibodies (provider)
- Main image
- Experimental details
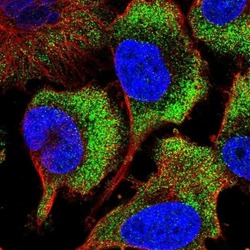
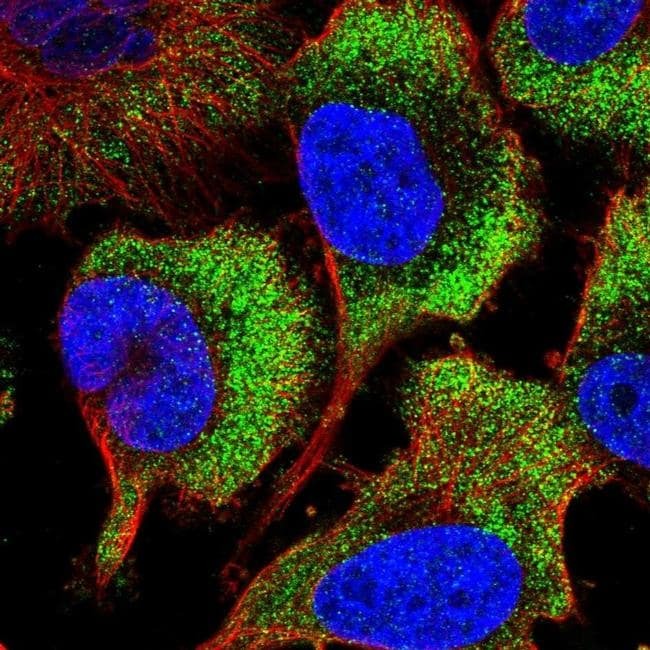
- Immunofluorescent staining of RPS26 in human cell line U-251 MG shows localization to cytosol and endoplasmic reticulum. Samples were probed using a RPS26 Polyclonal Antibody (Product # PA5-65975).
Supportive validation
- Submitted by
- Invitrogen Antibodies (provider)
- Main image
- Experimental details
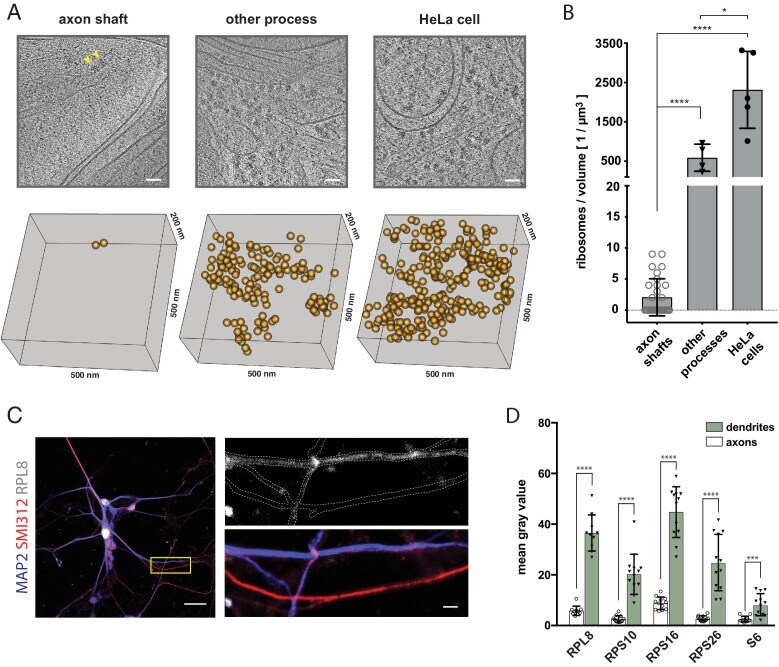
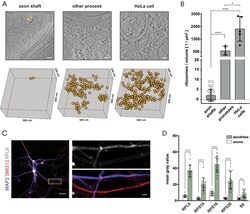
- Figure 4. The shaft of the growing axon is scarcely populated by ribosomes. ( A ) Examples of ribosomes observed in cryo-tomograms of axon shafts from ALI-COs, of other cellular processes from ALI-COs, and of HeLa cells. The bottom panel shows 0.05 um 3 cryo-ET volumes, corresponding to the area shown in the upper panel. Positions of all ribosome-like particles observed in that volume are shown as orange spheres. ( B ) Comparison of the numbers of ribosome-like particles, normalized to the tomographic volume, observed in axon shafts, other processes and HeLa cells. Individual data points represent individual cryo-tomograms (30, 4, and 5 tomograms, respectively). Mann-Whitney tests were employed for statistical analysis: p < 0.0001 (****); p < 0.05(*). ( C ) Immunofluorescence images of dissociated neurons from organoids reveal low signal for the ribosomal 60 S component RPL8 in axon processes (identified by SMI312 + /MAP2 - labeling) in comparison to dendrites (identified by SMI312 - /MAP2 + labeling). The yellow box outlines the area magnified in the right panel. The top image of the right panel shows the immunofluorescence signal for the ribosomal subunit RPL8. The bottom image shows the SMI312/MAP2/RPL8 composite. The white dashed line depicts the outline of axons and dendrites and was traced based on the MAP2 and SMI312 signal. The image shown is representative of the data used for quantifications shown in D. ( D ) Quantification of immunofluorescence images of ALI-CO der