Explore
 Validate
 Learn
LearnMA1-21595
antibody from Invitrogen Antibodies
Targeting: TGFB1
CED, DPD1, TGFB, TGFbeta
 Western blot
 ELISA
ELISA Immunocytochemistry Immunohistochemistry Flow cytometry Blocking/Neutralizing Other assay
Antibody data
- Antibody Data
- Antigen structure
- References [4]
- Comments [0]
- Validations
- Immunocytochemistry [3]
- Other assay [1]
Submit
Validation data
Reference
Comment
Report error
- Product number
- MA1-21595 - Provider product page

- Provider
- Invitrogen Antibodies
- Product name
- TGF beta-1 Monoclonal Antibody (TB21)
- Antibody type
- Monoclonal
- Antigen
- Other
- Description
- Recommended positive controls: Ovine ovarian tissue, breast cancer sections. By Western blot, this antibody detects detects dimeric (25 kDa) and monomeric (12.5 kDa) forms of TGF beta, under non-reducing and reducing conditions, respectively Store product as a concentrated solution. Centrifuge briefly prior to opening the vial.
- Reactivity
- Human, Mouse, Rat, Bovine, Rabbit
- Host
- Mouse
- Isotype
- IgG
- Antibody clone number
- TB21
- Vial size
- 100 μg
- Concentration
- 1 mg/mL
- Storage
- Store at 4°C short term. For long term storage, store at -20°C, avoiding freeze/thaw cycles.
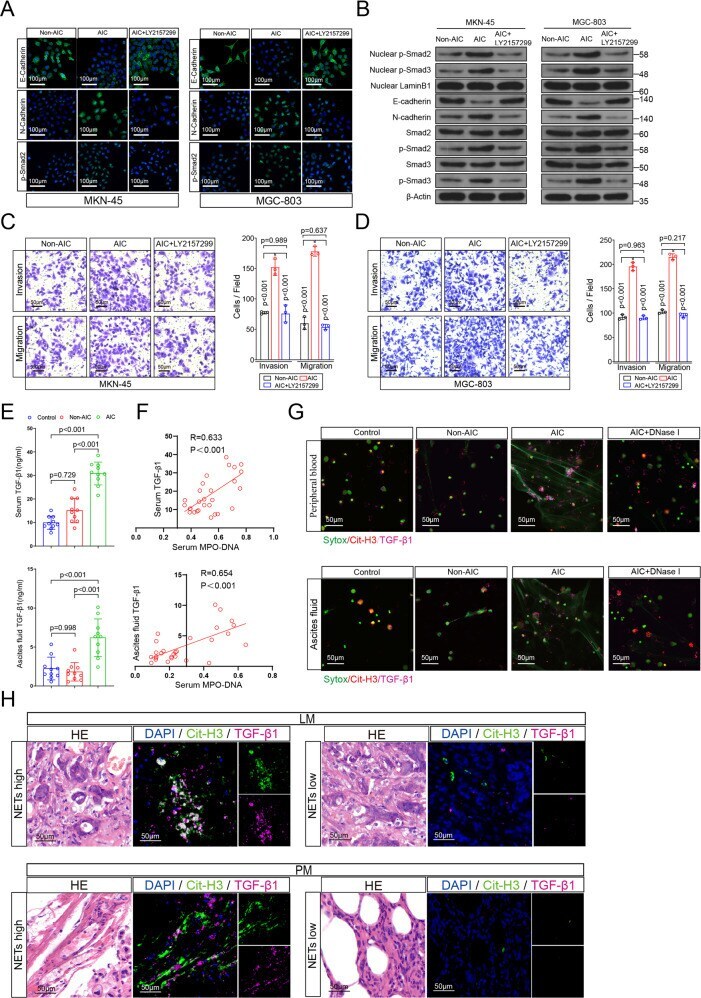
Submitted references Neutrophil extracellular traps promote metastasis in gastric cancer patients with postoperative abdominal infectious complications.
Role of gastric epithelial cell-derived transforming growth factor beta in reduced CD4+ T cell proliferation and development of regulatory T cells during Helicobacter pylori infection.
IL-10 producing CD8+ T cells in human infection with Leishmania guyanensis.
Transforming growth factor beta 1 production by CD4+ CD25+ regulatory T cells in peripheral blood mononuclear cells from healthy subjects stimulated with Leishmania guyanensis.
Xia X, Zhang Z, Zhu C, Ni B, Wang S, Yang S, Yu F, Zhao E, Li Q, Zhao G
Nature communications 2022 Feb 23;13(1):1017
Nature communications 2022 Feb 23;13(1):1017
Role of gastric epithelial cell-derived transforming growth factor beta in reduced CD4+ T cell proliferation and development of regulatory T cells during Helicobacter pylori infection.
Beswick EJ, Pinchuk IV, Earley RB, Schmitt DA, Reyes VE
Infection and immunity 2011 Jul;79(7):2737-45
Infection and immunity 2011 Jul;79(7):2737-45
IL-10 producing CD8+ T cells in human infection with Leishmania guyanensis.
Bourreau E, Ronet C, Couppié P, Sainte-Marie D, Tacchini-Cottier F, Launois P
Microbes and infection 2007 Jul;9(8):1034-41
Microbes and infection 2007 Jul;9(8):1034-41
Transforming growth factor beta 1 production by CD4+ CD25+ regulatory T cells in peripheral blood mononuclear cells from healthy subjects stimulated with Leishmania guyanensis.
Kariminia A, Bourreau E, Pascalis H, Couppié P, Sainte-Marie D, Tacchini-Cottier F, Launois P
Infection and immunity 2005 Sep;73(9):5908-14
Infection and immunity 2005 Sep;73(9):5908-14
No comments: Submit comment
Supportive validation
- Submitted by
- Invitrogen Antibodies (provider)
- Main image
- Experimental details
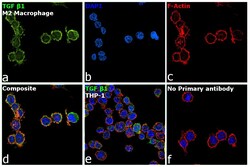
- Immunofluorescence analysis of TGF beta1 (Transforming growth factor beta-1) was performed using THP-1 and THP-1 differentiated and polarized to M2 macrophage cells. The cells were fixed with 4% paraformaldehyde for 10 minutes, permeabilized with 0.1% Triton™ X-100 for 10 minutes, and blocked with 2% BSA for 45 minutes at room temperature. The cells were labeled with TGF beta-1 Monoclonal Antibody (TB21) (Product # MA1-21595) at 1:100 in 0.1% BSA, incubated at 4 degree celsius overnight and then labeled with Donkey anti-Mouse IgG (H+L) Highly Cross-Adsorbed Secondary Antibody, Alexa Fluor Plus 488 (Product # A32766), (1:2500 dilution), for 45 minutes at room temperature (Panel a: Green). Nuclei (Panel b: Blue) were stained with ProLong™ Diamond Antifade Mountant with DAPI (Product # P36962). F-actin (Panel c: Red) was stained with Rhodamine Phalloidin (Product # R415, 1:300). Panel d represents the merged image showing increased expression and cytoplasmic localization of TGF beta1 in M2 macrophage cells compared to THP-1 control cells (Panel e). Panel f represents control M2 macrophage cells with no primary antibody to assess background. The images were captured at 60X magnification.
- Submitted by
- Invitrogen Antibodies (provider)
- Main image

- Experimental details
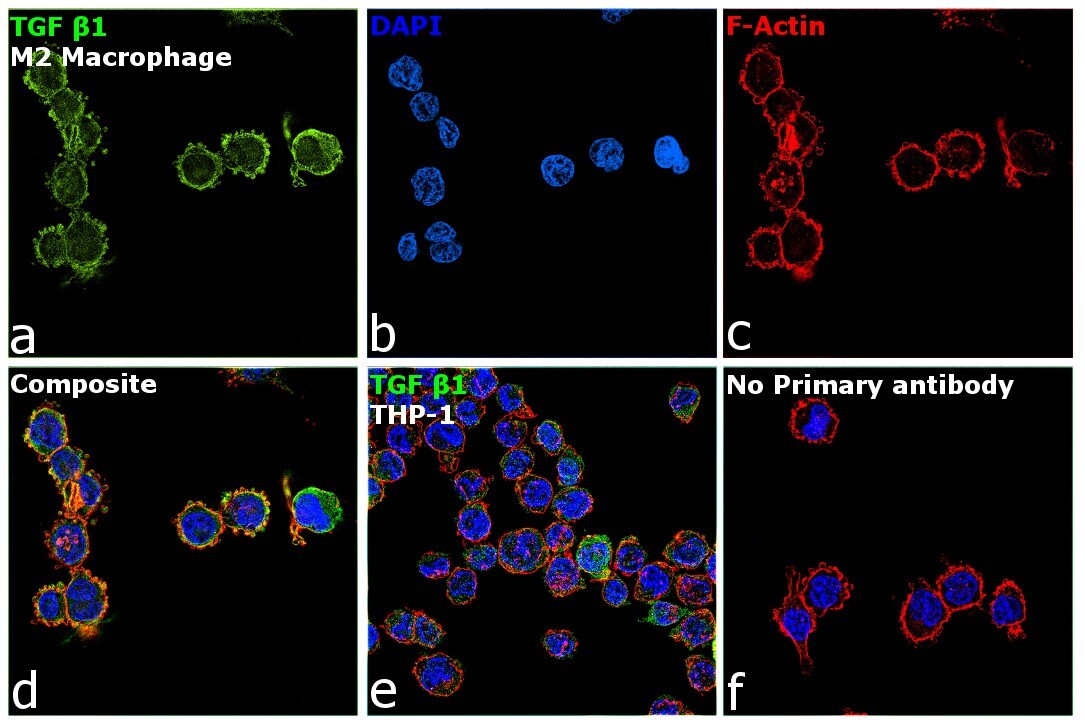
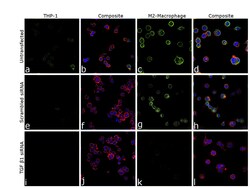
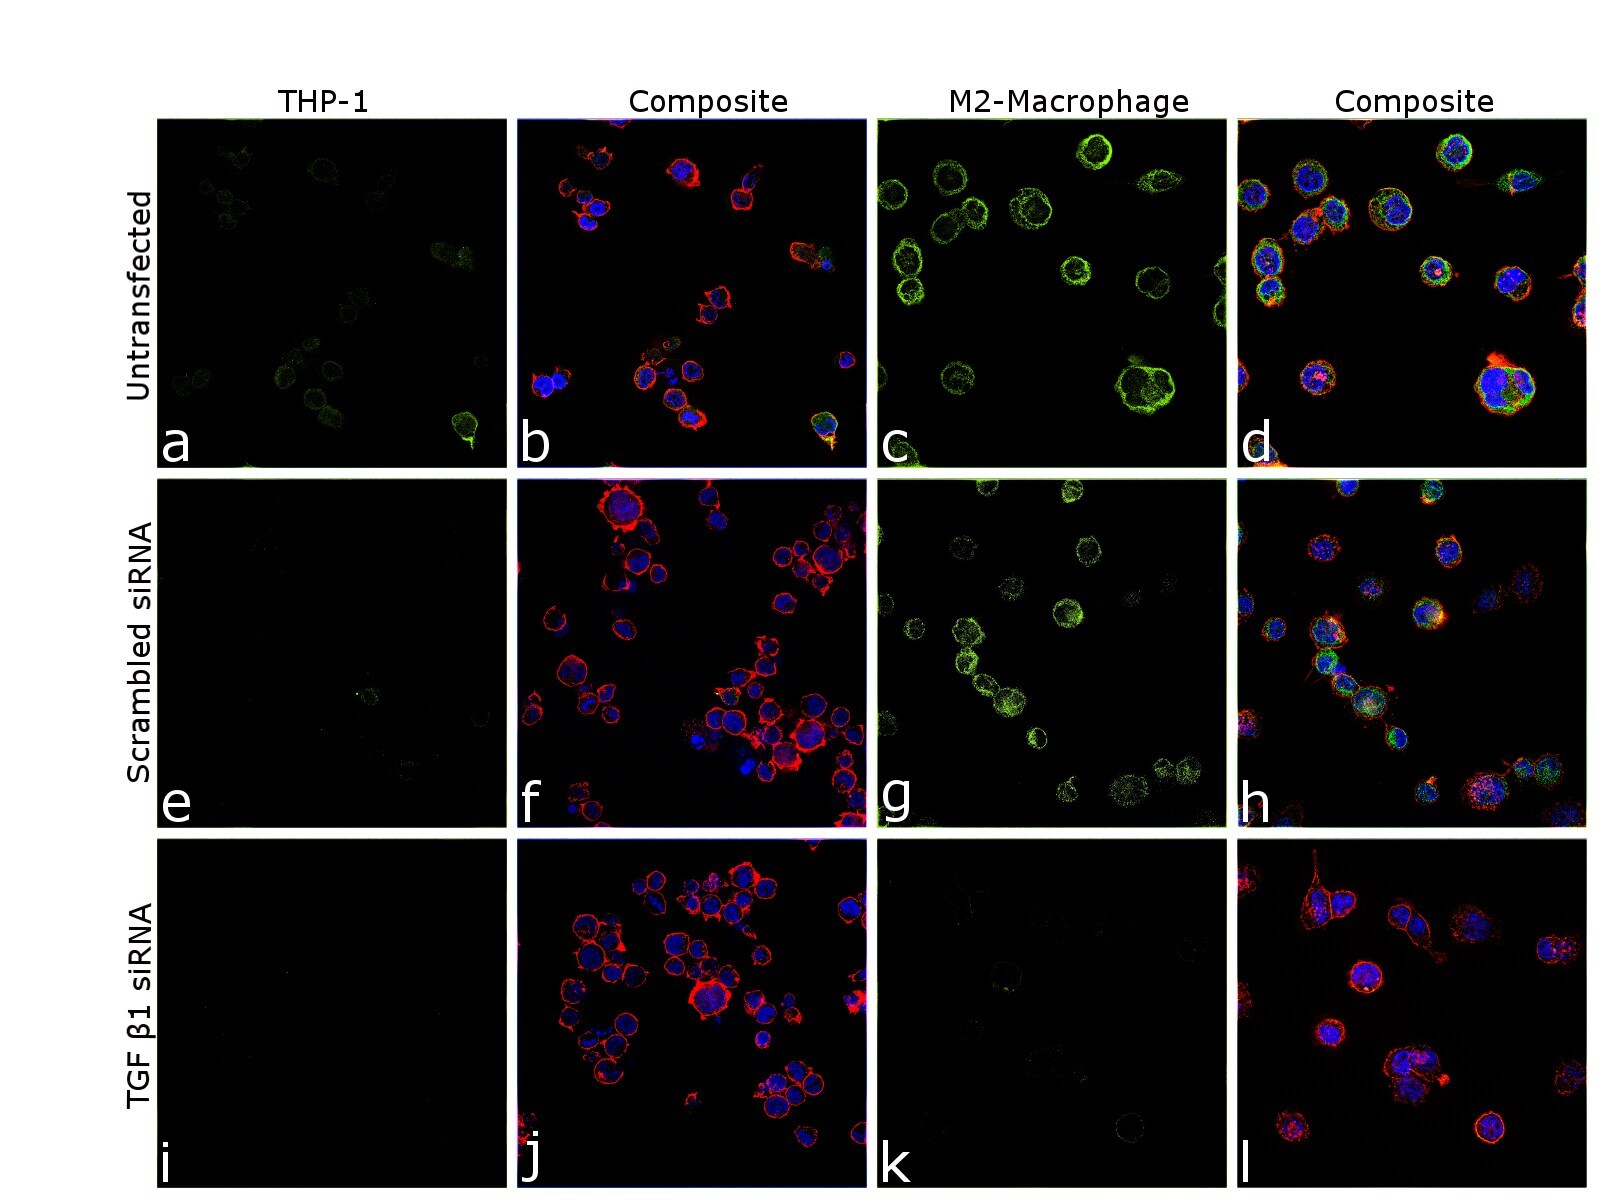
- Knockdown of TGF beta1 was achieved by transfecting THP-1 cells with TGF beta1 specific siRNA (Silencer® select Product # s14054, s14056). Immunofluorescence analysis was performed on untransfected THP1 cells (panel a,b), untransfected M2 macrophage (panel c,d), non-specific scrambled siRNA transfected THP-1 (panels e,f), non-specific scrambled siRNA transfected M2 macrophage (panels g,h), THP-1 transfected with TGF beta1 specific siRNA (panel i,j), and THP-1 transfected with TGF beta1 specific siRNA and differentiated to M2 macrophage (panels k,l) (Green). Cells were fixed, permeabilized, and labelled with TGF beta-1 Monoclonal Antibody (TB21) (Product # MA1-21595, 1:100) followed by Donkey anti-Mouse IgG (H+L) Highly Cross-Adsorbed Secondary Antibody, Alexa Fluor Plus 488 (Product # A32766), (1:2,500 dilution). Nuclei (blue) were stained using ProLong™ Diamond Antifade Mountant with DAPI (Product # P36962), and Rhodamine Phalloidin (Product # R415, 1:300) was used for cytoskeletal F-actin (Red) staining. Reduction of specific signal was observed upon siRNA mediated knockdown (panel k,l) confirming specificity of the antibody to TGF beta1. The Images were captured at 60X magnification.

- Submitted by
- Invitrogen Antibodies (provider)
- Main image
- Experimental details
- Knockdown of TGF beta1 was achieved by transfecting THP-1 cells with TGF beta1 specific siRNA (Silencer® select Product # s14054, s14056). Immunofluorescence analysis was performed on untransfected THP1 cells (panel a,b), untransfected M2 macrophage (panel c,d), non-specific scrambled siRNA transfected THP-1 (panels e,f), non-specific scrambled siRNA transfected M2 macrophage (panels g,h), THP-1 transfected with TGF beta1 specific siRNA (panel i,j), and THP-1 transfected with TGF beta1 specific siRNA and differentiated to M2 macrophage (panels k,l) (Green). Cells were fixed, permeabilized, and labelled with TGF beta-1 Monoclonal Antibody (TB21) (Product # MA1-21595, 1:100) followed by Donkey anti-Mouse IgG (H+L) Highly Cross-Adsorbed Secondary Antibody, Alexa Fluor Plus 488 (Product # A32766), (1:2,500 dilution). Nuclei (blue) were stained using ProLong™ Diamond Antifade Mountant with DAPI (Product # P36962), and Rhodamine Phalloidin (Product # R415, 1:300) was used for cytoskeletal F-actin (Red) staining. Reduction of specific signal was observed upon siRNA mediated knockdown (panel k,l) confirming specificity of the antibody to TGF beta1. The Images were captured at 60X magnification.
Supportive validation
- Submitted by
- Invitrogen Antibodies (provider)
- Main image
- Experimental details
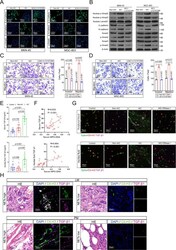
- NETs induced invasion, migration and EMT of GC cells dependent on TGF-beta signaling pathway activation. A , B Left panel: representative immunofluorescence staining was used to compare E-cadherin, N-cadherin and p-smad2 in MKN-45 ( A ) and MGC-803 ( B ) cells as indicated treatment (LY 2157299, a TGF-beta inhibitor). Right panel: Western blotting was used to compare E-cadherin, N-cadherin, Smad3, p-Smad3, nuclear p-Smad3, Smad2, p-Smad2, and nuclear p-Smad2 in MKN-45 ( A ) and MGC-803 ( B ) cells as indicated treatment; C , D Transwell Matrigel invasion and migration assays for MKN-45 ( C ) and MGC-803 ( D ) cells as indicated treatment. E Serum and ascites fluid TGF-beta1 levels in GC patients with control, Non-AIC and AIC groups; F Correlation between serum MPO-DNA and serum TGF-beta1, ascites fluid MPO-DNA and ascites fluid TGF-beta1 levels in GC patients with control ( n = 10), Non-AIC ( n = 10) and AIC ( n = 10), the Pearson's correlation coefficient R -value and the p -value are shown in the figures; G Representative immunofluorescence co-staining images of DNA, Cit-H3, and TGF-beta1 to located NETs and TGF-beta1 in the neutrophils isolated from peripheral blood (upper panel) and ascites fluid (down panel) of control, Non-AIC, AIC and AIC + DNase I groups; H Representative HE and immunofluorescence co-staining images of DNA, Cit-H3 and TGF-beta1 in LM and PM from GC patients. Data represent the mean +- S.D. in C , D ( n = 3 biologically independent experiments) and E (