Explore
 Validate
 Learn
Learn Flow cytometry
Antibody data
- Antibody Data
- Antigen structure
- References [7]
- Comments [0]
- Validations
- Flow cytometry [1]
- Other assay [5]
Submit
Validation data
Reference
Comment
Report error
- Product number
- 25-9829-42 - Provider product page

- Provider
- Invitrogen Antibodies
- Product name
- LAP (Latency Associated peptide) Monoclonal Antibody (FNLAP), PE-Cyanine7, eBioscience™
- Antibody type
- Monoclonal
- Antigen
- Other
- Description
- Description: The FNLAP monoclonal antibody reacts with human latency associated peptide (LAP, pro-TGF beta 1, LAP/TGF beta 1). Many different cells produce TGF beta and it mediates effects on the proliferation, differentiation and function of many cell types. TGF beta is synthesized as a precursor that contains LAP at the N-terminus and mature TGF beta at the C-terminus. Processing and cleavage of the precursor protein between amino acids 278 and 279 results in the formation of LAP dimers and TGF beta dimers that then non-covalently associate with each other to form the small latent TGF beta complex. LAP is secreted and can be found in the extracellular matrix. In addition, LAP can also be expressed on platelets and activated regulatory T cells. It is believed that this surface-expressed LAP is due to the binding of LAP to GARP (LRRC32), which is a transmembrane protein that is also found at high levels on platelets and activated regulatory T cells.
- Antibody clone number
- FNLAP
- Concentration
- 5 µL/Test
Submitted references Dendritic cell Piezo1 directs the differentiation of T(H)1 and T(reg) cells in cancer.
Systematic testing and specificity mapping of alloantigen-specific chimeric antigen receptors in regulatory T cells.
Circulating gluten-specific FOXP3(+)CD39(+) regulatory T cells have impaired suppressive function in patients with celiac disease.
NOTCH1 mediates a switch between two distinct secretomes during senescence.
Alloantigen-specific regulatory T cells generated with a chimeric antigen receptor.
Hypomethylation at the regulatory T cell-specific demethylated region in CD25hi T cells is decoupled from FOXP3 expression at the inflamed site in childhood arthritis.
Phenotypic and functional characteristics of CD4+ CD39+ FOXP3+ and CD4+ CD39+ FOXP3neg T-cell subsets in cancer patients.
Wang Y, Yang H, Jia A, Wang Y, Yang Q, Dong Y, Hou Y, Cao Y, Dong L, Bi Y, Liu G
eLife 2022 Aug 22;11
eLife 2022 Aug 22;11
Systematic testing and specificity mapping of alloantigen-specific chimeric antigen receptors in regulatory T cells.
Dawson NA, Lamarche C, Hoeppli RE, Bergqvist P, Fung VC, McIver E, Huang Q, Gillies J, Speck M, Orban PC, Bush JW, Mojibian M, Levings MK
JCI insight 2019 Mar 21;4(6)
JCI insight 2019 Mar 21;4(6)
Circulating gluten-specific FOXP3(+)CD39(+) regulatory T cells have impaired suppressive function in patients with celiac disease.
Cook L, Munier CML, Seddiki N, van Bockel D, Ontiveros N, Hardy MY, Gillies JK, Levings MK, Reid HH, Petersen J, Rossjohn J, Anderson RP, Zaunders JJ, Tye-Din JA, Kelleher AD
The Journal of allergy and clinical immunology 2017 Dec;140(6):1592-1603.e8
The Journal of allergy and clinical immunology 2017 Dec;140(6):1592-1603.e8
NOTCH1 mediates a switch between two distinct secretomes during senescence.
Hoare M, Ito Y, Kang TW, Weekes MP, Matheson NJ, Patten DA, Shetty S, Parry AJ, Menon S, Salama R, Antrobus R, Tomimatsu K, Howat W, Lehner PJ, Zender L, Narita M
Nature cell biology 2016 Sep;18(9):979-92
Nature cell biology 2016 Sep;18(9):979-92
Alloantigen-specific regulatory T cells generated with a chimeric antigen receptor.
MacDonald KG, Hoeppli RE, Huang Q, Gillies J, Luciani DS, Orban PC, Broady R, Levings MK
The Journal of clinical investigation 2016 Apr 1;126(4):1413-24
The Journal of clinical investigation 2016 Apr 1;126(4):1413-24
Hypomethylation at the regulatory T cell-specific demethylated region in CD25hi T cells is decoupled from FOXP3 expression at the inflamed site in childhood arthritis.
Bending D, Pesenacker AM, Ursu S, Wu Q, Lom H, Thirugnanabalan B, Wedderburn LR
Journal of immunology (Baltimore, Md. : 1950) 2014 Sep 15;193(6):2699-708
Journal of immunology (Baltimore, Md. : 1950) 2014 Sep 15;193(6):2699-708
Phenotypic and functional characteristics of CD4+ CD39+ FOXP3+ and CD4+ CD39+ FOXP3neg T-cell subsets in cancer patients.
Schuler PJ, Schilling B, Harasymczuk M, Hoffmann TK, Johnson J, Lang S, Whiteside TL
European journal of immunology 2012 Jul;42(7):1876-85
European journal of immunology 2012 Jul;42(7):1876-85
No comments: Submit comment
Supportive validation
- Submitted by
- Invitrogen Antibodies (provider)
- Main image
- Experimental details
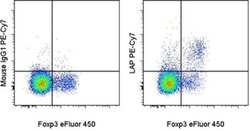
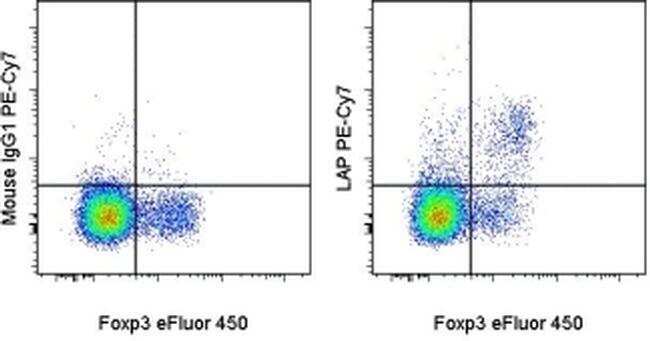
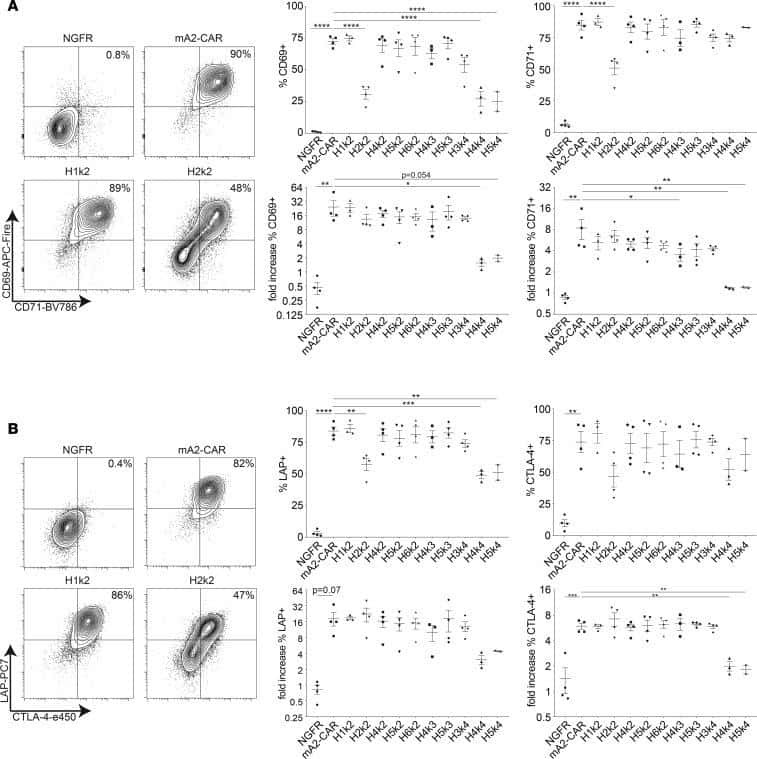
- Normal human peripheral blood cells were stimulated with Anti-Human CD3, Anti-Human CD28 and Human IL-2 recombinant protein for 1 day, and then stained with Anti-Human CD4 FITC (Product # 11-0048-42), and Mouse IgG1 K Isotype Control PE-Cyanine7 (Product # 25-4714-80) (left) or Anti-Human LAP (Latency Associated Peptide) PE-Cyanine7 (right) followed by intracellular staining with Anti-Human Foxp3 eFluor® 450 (Product # 48-4776-42) using Foxp3 Fixation/Permeabilization Buffer and protocol. CD4+ cells in the lymphocyte gate were used for analysis.
Supportive validation
- Submitted by
- Invitrogen Antibodies (provider)
- Main image

- Experimental details
- NULL
- Submitted by
- Invitrogen Antibodies (provider)
- Main image

- Experimental details
- NULL
- Submitted by
- Invitrogen Antibodies (provider)
- Main image
- Experimental details
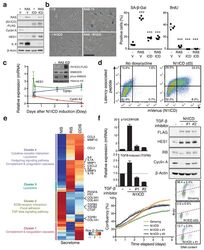
- Figure 3 NOTCH1 drives a cell-autonomous senescence with a distinct secretory profile. (a and b) ER:HRAS G12V IMR90 cells, stably expressing N1ICD-FLAG or control vector (V), were incubated with or without 4OHT for 6 days and analysed for expression of indicated proteins by immunoblotting (a), SA-beta-gal and BrdU incorporation (b). One way ANOVA with Dunnett's multiple comparison test; bars are means of >=200 cells, n = 4 biologically independent experiments. *** P

- Submitted by
- Invitrogen Antibodies (provider)
- Main image
- Experimental details
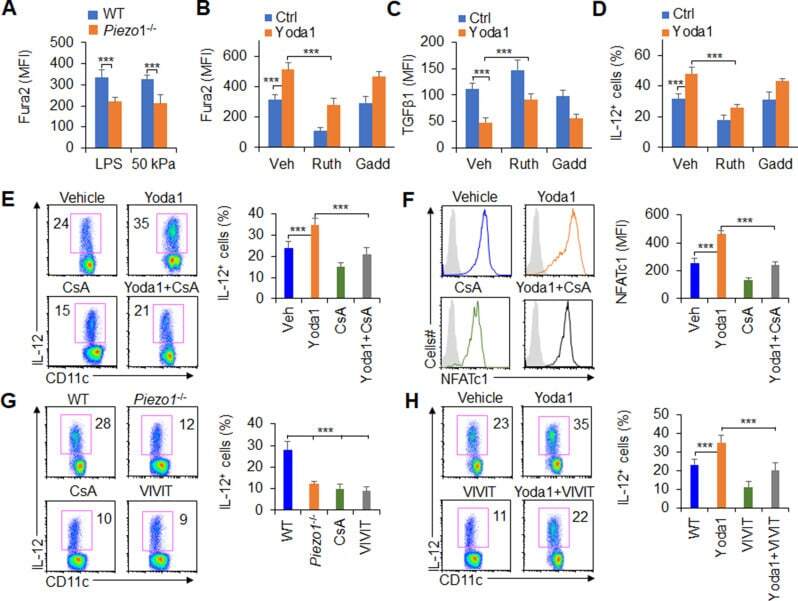
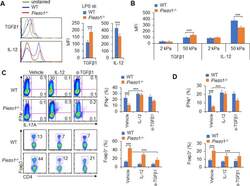
- Figure 3. Piezo1 regulates IL-12 and TGFbeta1 production by dendritic cells (DCs) to direct T H 1 and T reg cell differentiation. ( A-B ) Intracellular staining of IL-12p40 and TGFbeta1 expression in WT and Piezo1 -/- splenic DCs after 5 hr of treatment with lipopolysaccharide (LPS) (A; 10 ng/ml) or culture on 2 and 50 kPa hydrogels ( B ). A representative figure shown on the left, and the data summarized on the right. ( C ) Intracellular staining of IFNgamma and Foxp3 in T cells cocultured with WT and Piezo1 -/- splenic DCs in the presence of the indicated treatments (IL-12, Peprotech, 10 mug/ml or anti-TGFbeta1, R&D Systems, 20 mug/ml) for 5 days. A representative figure shown on the left, and the data summarized on the right. ( D ) Intracellular staining of IFNgamma (upper panel) and Foxp3 (lower panel) in T cells cocultured with WT and Piezo1 DC splenic DCs conditioned with 50 kPa hydrogel and the indicated treatments for 5 days and data summarized. The data are representative of three independent experiments (mean +- s.d. ; n=3-5). ***p
- Submitted by
- Invitrogen Antibodies (provider)
- Main image
- Experimental details
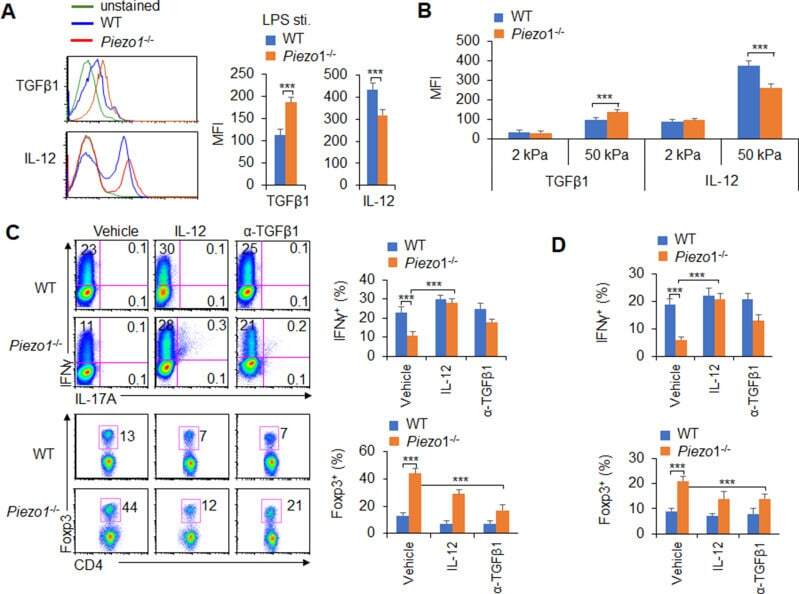
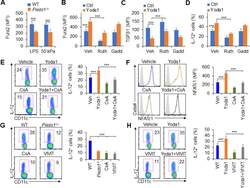
- Figure 6. Piezo1 regulates TGFbeta1 and IL-12 production through the calcium-calcineurin-NFAT axis. ( A ) Measurement of intracellular Ca 2+ concentrations with Fura2 dye in splenic dendritic cells (DCs) from WT or Piezo1 -/- mice treated with lipopolysaccharide (LPS) (10 ng/ml) or cultured on plates containing 50 kPa hydrogels. ( B ) Intracellular Ca 2+ concentrations measured with Fura2 in splenic DCs from WT mice after the indicated treatment (Yoda1, 25 muM, MCE; ruthenium red, 30 muM, Sigma; gadolinium chloride, 10 muM, Sigma). ( C-D ) Intracellular staining of TGFbeta1 ( C ) and IL-12p40 ( D ) in splenic DCs from WT mice after the indicated treatments. ( E ) Intracellular staining of IL-12p40 in splenic DCs from WT mice after the indicated treatments. A representative figure shown on the left, and the data summarized on the right. ( F ) Intracellular staining of NFATc1 in splenic DCs from WT mice after the indicated treatments (CsA, 10 nM). A representative figure shown on the left, and data summarized on the right. ( G-H ) Intracellular staining of IL-12p40 in splenic DCs from WT or Piezo1 -/- mice after the indicated treatments (Yoda1, 25 muM, MCE; 11R-VIVIT, 100 nM, MCE; CsA, 10 nM, Sigma). A representative figure shown on the left, and data summarized on the right. The data are representative of three to four independent experiments (mean +- s.d. ; n=3-4). ***p