Explore
 Validate
 Learn
Learn Western blot
 Immunocytochemistry
 Immunoprecipitation
Antibody data
- Antibody Data
- Antigen structure
- References [3]
- Comments [0]
- Validations
- Immunocytochemistry [6]
- Other assay [4]
Submit
Validation data
Reference
Comment
Report error
- Product number
- PA1-777 - Provider product page

- Provider
- Invitrogen Antibodies
- Product name
- TPH1 Polyclonal Antibody
- Antibody type
- Polyclonal
- Antigen
- Synthetic peptide
- Description
- PA1-777 detects TPH1 in human, mouse, rat, rabbit and non-human primate samples. PA1-777 has been successfully used in ICC/IF, IP, and Western blot procedures. By Western blot PA1-777 detects a 51 kDa protein representing TPH1. The PA1-777 immunogen is a synthetic peptide corresponding to the C-terminal region of TPH1.
- Reactivity
- Human, Mouse, Rat, Rabbit
- Host
- Rabbit
- Isotype
- IgG
- Vial size
- 100 μL
- Concentration
- 1 mg/mL
- Storage
- 4°C
Submitted references Herpes Simplex Virus-1 Induced Serotonin-Associated Metabolic Pathways Correlate With Severity of Virus- and Inflammation-Associated Ocular Disease.
Stress inhibits tryptophan hydroxylase expression in a rat model of depression.
Differential tissue distribution of tryptophan hydroxylase isoforms 1 and 2 as revealed with monospecific antibodies.
Battaglia DM, Sanchez-Pino MD, Nichols CD, Foster TP
Frontiers in microbiology 2022;13:859866
Frontiers in microbiology 2022;13:859866
Stress inhibits tryptophan hydroxylase expression in a rat model of depression.
Chen Y, Xu H, Zhu M, Liu K, Lin B, Luo R, Chen C, Li M
Oncotarget 2017 Sep 8;8(38):63247-63257
Oncotarget 2017 Sep 8;8(38):63247-63257
Differential tissue distribution of tryptophan hydroxylase isoforms 1 and 2 as revealed with monospecific antibodies.
Sakowski SA, Geddes TJ, Thomas DM, Levi E, Hatfield JS, Kuhn DM
Brain research 2006 Apr 26;1085(1):11-8
Brain research 2006 Apr 26;1085(1):11-8
No comments: Submit comment
Supportive validation
- Submitted by
- Invitrogen Antibodies (provider)
- Main image
- Experimental details
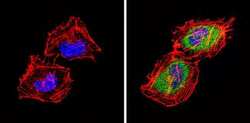
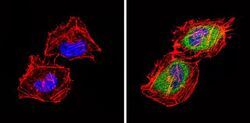
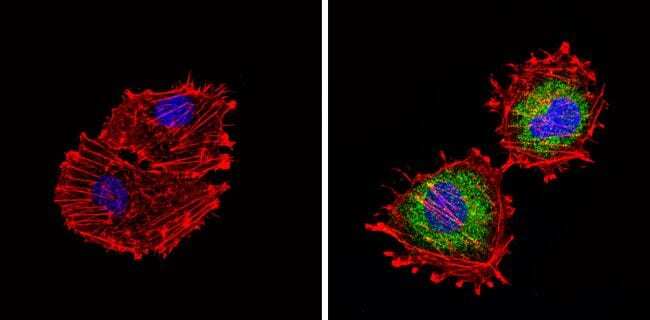
- Immunofluorescent analysis of TPH1 (green) showing staining in the cytoplasm of Hela cells (right) compared to a negative control without primary antibody (left). Formalin-fixed cells were permeabilized with 0.1% Triton X-100 in TBS for 5-10 minutes and blocked with 3% BSA-PBS for 30 minutes at room temperature. Cells were probed with a TPH1 polyclonal antibody (Product # PA1-777) in 3% BSA-PBS at a dilution of 1:50 and incubated overnight at 4 ºC in a humidified chamber. Cells were washed with PBST and incubated with a DyLight-conjugated secondary antibody in PBS at room temperature in the dark. F-actin (red) was stained with a fluorescent red phalloidin and nuclei (blue) were stained with Hoechst or DAPI. Images were taken at a magnification of 60x.
- Submitted by
- Invitrogen Antibodies (provider)
- Main image

- Experimental details
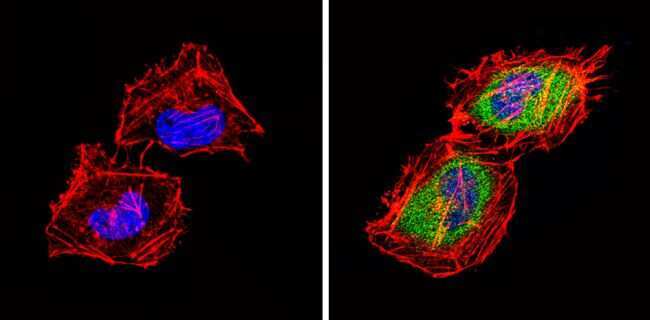
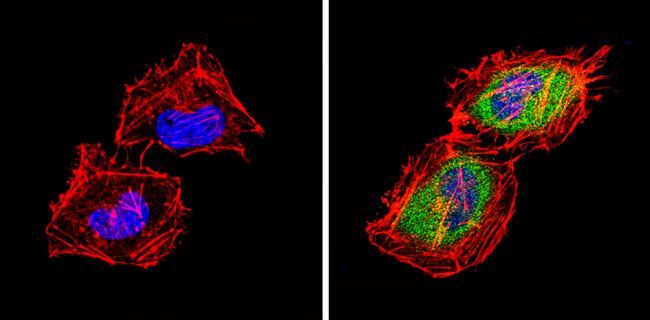
- Immunofluorescent analysis of TPH1 (green) showing staining in the cytoplasm of NIH-3T3 cells (right) compared to a negative control without primary antibody (left). Formalin-fixed cells were permeabilized with 0.1% Triton X-100 in TBS for 5-10 minutes and blocked with 3% BSA-PBS for 30 minutes at room temperature. Cells were probed with a TPH1 polyclonal antibody (Product # PA1-777) in 3% BSA-PBS at a dilution of 1:50 and incubated overnight at 4 ºC in a humidified chamber. Cells were washed with PBST and incubated with a DyLight-conjugated secondary antibody in PBS at room temperature in the dark. F-actin (red) was stained with a fluorescent red phalloidin and nuclei (blue) were stained with Hoechst or DAPI. Images were taken at a magnification of 60x.
- Submitted by
- Invitrogen Antibodies (provider)
- Main image

- Experimental details
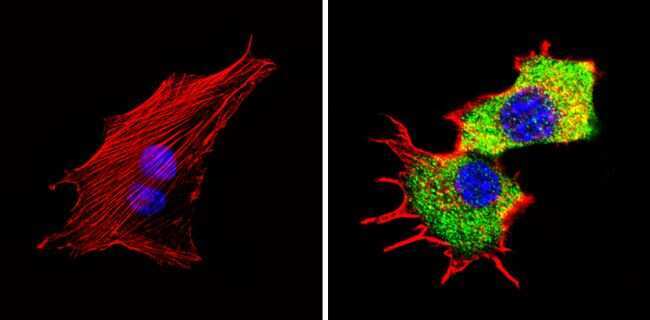
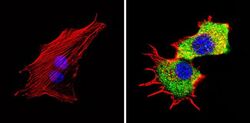
- Immunofluorescent analysis of TPH1 (green) showing staining in the cytoplasm of HUVEC cells (right) compared to a negative control without primary antibody (left). Formalin-fixed cells were permeabilized with 0.1% Triton X-100 in TBS for 5-10 minutes and blocked with 3% BSA-PBS for 30 minutes at room temperature. Cells were probed with a TPH1 polyclonal antibody (Product # PA1-777) in 3% BSA-PBS at a dilution of 1:50 and incubated overnight at 4 ºC in a humidified chamber. Cells were washed with PBST and incubated with a DyLight-conjugated secondary antibody in PBS at room temperature in the dark. F-actin (red) was stained with a fluorescent red phalloidin and nuclei (blue) were stained with Hoechst or DAPI. Images were taken at a magnification of 60x.

- Submitted by
- Invitrogen Antibodies (provider)
- Main image
- Experimental details
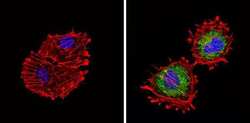
- Immunofluorescent analysis of TPH1 (green) showing staining in the cytoplasm of Hela cells (right) compared to a negative control without primary antibody (left). Formalin-fixed cells were permeabilized with 0.1% Triton X-100 in TBS for 5-10 minutes and blocked with 3% BSA-PBS for 30 minutes at room temperature. Cells were probed with a TPH1 polyclonal antibody (Product # PA1-777) in 3% BSA-PBS at a dilution of 1:50 and incubated overnight at 4 ºC in a humidified chamber. Cells were washed with PBST and incubated with a DyLight-conjugated secondary antibody in PBS at room temperature in the dark. F-actin (red) was stained with a fluorescent red phalloidin and nuclei (blue) were stained with Hoechst or DAPI. Images were taken at a magnification of 60x.
- Submitted by
- Invitrogen Antibodies (provider)
- Main image
- Experimental details
- Immunofluorescent analysis of TPH1 (green) showing staining in the cytoplasm of NIH-3T3 cells (right) compared to a negative control without primary antibody (left). Formalin-fixed cells were permeabilized with 0.1% Triton X-100 in TBS for 5-10 minutes and blocked with 3% BSA-PBS for 30 minutes at room temperature. Cells were probed with a TPH1 polyclonal antibody (Product # PA1-777) in 3% BSA-PBS at a dilution of 1:50 and incubated overnight at 4 ºC in a humidified chamber. Cells were washed with PBST and incubated with a DyLight-conjugated secondary antibody in PBS at room temperature in the dark. F-actin (red) was stained with a fluorescent red phalloidin and nuclei (blue) were stained with Hoechst or DAPI. Images were taken at a magnification of 60x.

- Submitted by
- Invitrogen Antibodies (provider)
- Main image
- Experimental details
- Immunofluorescent analysis of TPH1 (green) showing staining in the cytoplasm of HUVEC cells (right) compared to a negative control without primary antibody (left). Formalin-fixed cells were permeabilized with 0.1% Triton X-100 in TBS for 5-10 minutes and blocked with 3% BSA-PBS for 30 minutes at room temperature. Cells were probed with a TPH1 polyclonal antibody (Product # PA1-777) in 3% BSA-PBS at a dilution of 1:50 and incubated overnight at 4 ºC in a humidified chamber. Cells were washed with PBST and incubated with a DyLight-conjugated secondary antibody in PBS at room temperature in the dark. F-actin (red) was stained with a fluorescent red phalloidin and nuclei (blue) were stained with Hoechst or DAPI. Images were taken at a magnification of 60x.
Supportive validation
- Submitted by
- Invitrogen Antibodies (provider)
- Main image

- Experimental details
- NULL
- Submitted by
- Invitrogen Antibodies (provider)
- Main image
- Experimental details
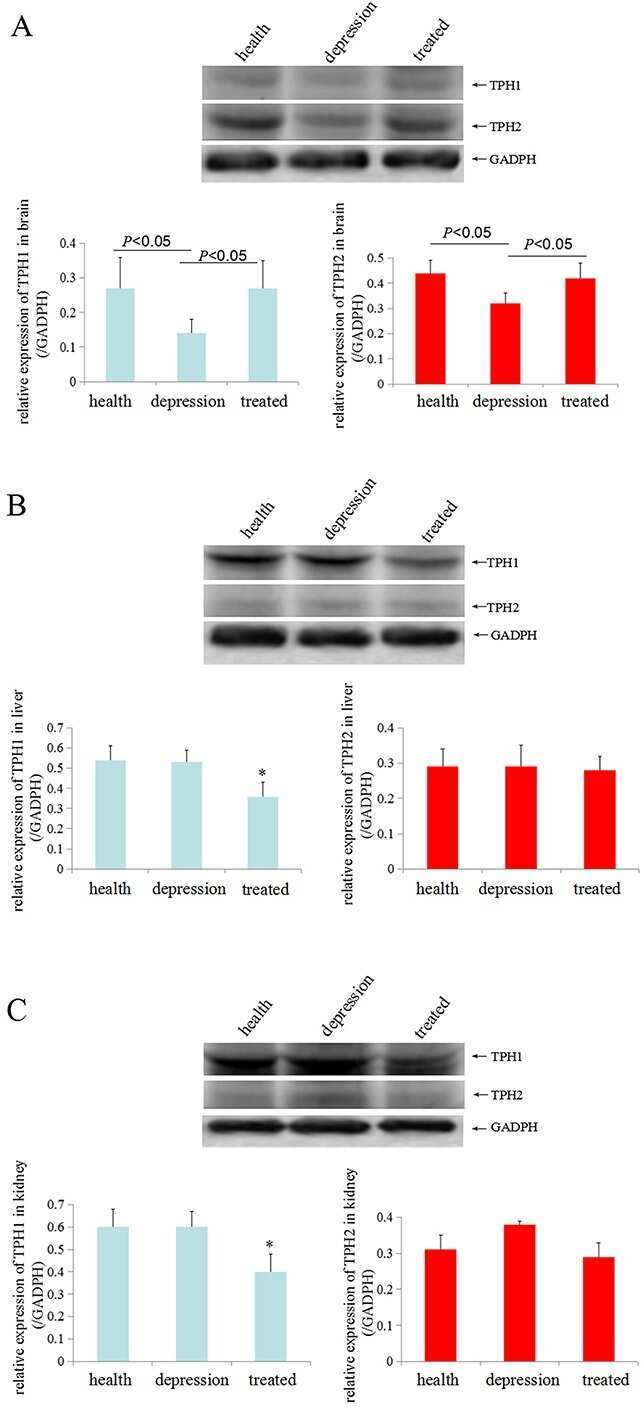
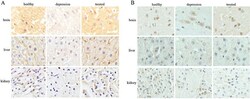
- Figure 2 Expression and localization of TPH1/2 in rat tissues The expression and localization of TPH1 (A) and TPH2 (B) were analyzed by immunohistochemistry in the rat brain, liver, and kidney of the healthy, depressive model, and treated groups. The images are representative of six independent experiments.

- Submitted by
- Invitrogen Antibodies (provider)
- Main image
- Experimental details
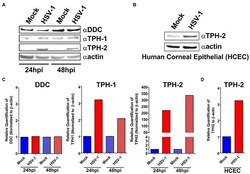
- Protein expression of key serotonin synthesis enzymes is upregulated following HSV-1 Infection. (A) Western blot analysis of DDC, TPH-1, and TPH-2 protein expression between HSV-1-infected and mock-infected A549 cell lysates at 24 and 48 hpi. (B) Quantification from A549 cell western blots of relative expression of DDC, TPH-1, and TPH-2 band intensity normalized to beta-actin. (C) Western blot analysis of TPH-2 protein expression between HSV-1-infected and mock-infected HCEC at 24 hpi. (D) Quantification from HCEC western blots of relative expression of TPH-2 band intensity normalized to beta-actin expressed in HCEC cells.

- Submitted by
- Invitrogen Antibodies (provider)
- Main image
- Experimental details
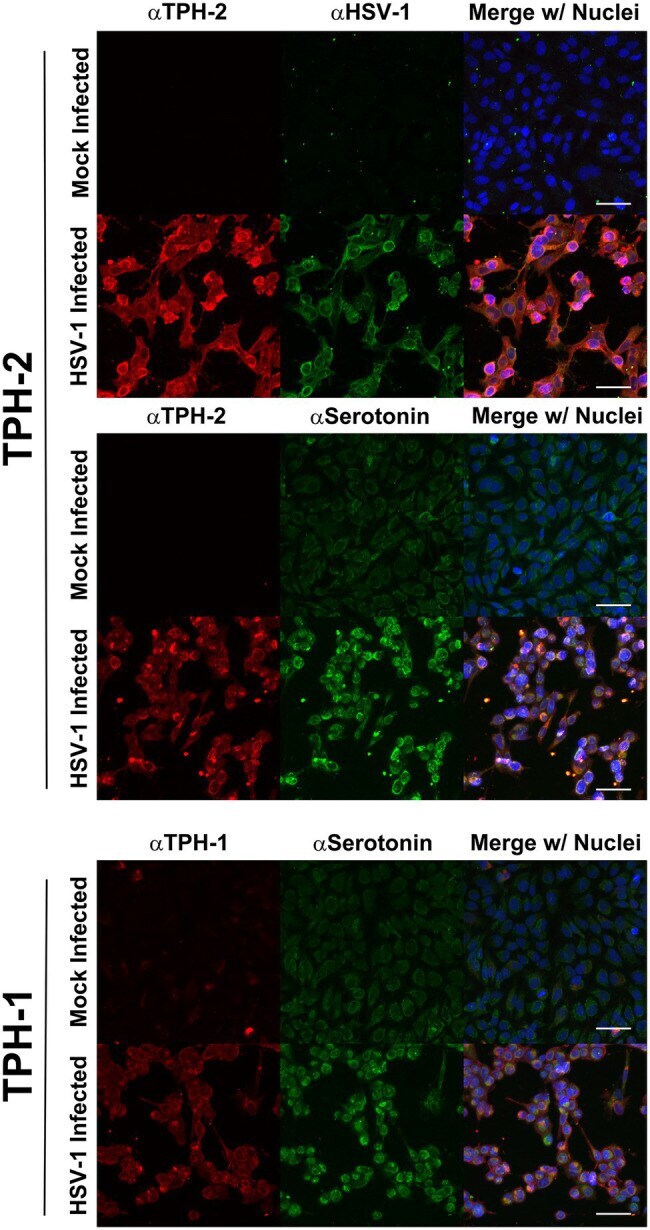
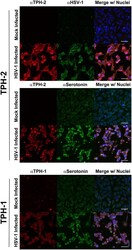
- Herpes simplex virus upregulation of TPH-1 and TPH-2 expression is associated with a corresponding increase in serotonin production. Cells were mock or HSV-1 infected and at 24 h post infection, expression of TPH-2 (top and middle series of panels, alphaTPH2; red), TPH-1, (bottom series of panels, alphaTPH1; red), serotonin (middle and bottom series of panels, alphaSerotonin; green), or HSV-viral proteins (top series of panels, alphaHSV; green) was visualized by confocal immunofluorescent analysis. Cell nuclei were counterstained with DRAQ5, pseudocolored blue and channels merged.