Explore
 Validate
 Learn
Learn Western blot
 Immunocytochemistry
Antibody data
- Antibody Data
- Antigen structure
- References [4]
- Comments [0]
- Validations
- Immunocytochemistry [4]
- Immunohistochemistry [2]
- Other assay [5]
Submit
Validation data
Reference
Comment
Report error
- Product number
- PA5-29188 - Provider product page

- Provider
- Invitrogen Antibodies
- Product name
- ALDH1A3 Polyclonal Antibody
- Antibody type
- Polyclonal
- Antigen
- Recombinant full-length protein
- Description
- Recommended positive controls: A431, Huh-7, U87-MG. Predicted reactivity: Mouse (95%), Rat (95%), Xenopus laevis (83%), Chicken (88%), Rhesus Monkey (98%). Store product as a concentrated solution. Centrifuge briefly prior to opening the vial.
- Reactivity
- Human, Mouse, Rat
- Host
- Rabbit
- Isotype
- IgG
- Vial size
- 100 μL
- Concentration
- 0.1 mg/mL
- Storage
- Store at 4°C short term. For long term storage, store at -20°C, avoiding freeze/thaw cycles.
Submitted references Repurposing Disulfiram for Targeting of Glioblastoma Stem Cells: An In Vitro Study.
High PKCλ expression is required for ALDH1-positive cancer stem cell function and indicates a poor clinical outcome in late-stage breast cancer patients.
Multi-omics profiling reveals key signaling pathways in ovarian cancer controlled by STAT3.
Serum erythropoietin levels, breast cancer and breast cancer-initiating cells.
Zirjacks L, Stransky N, Klumpp L, Prause L, Eckert F, Zips D, Schleicher S, Handgretinger R, Huber SM, Ganser K
Biomolecules 2021 Oct 21;11(11)
Biomolecules 2021 Oct 21;11(11)
High PKCλ expression is required for ALDH1-positive cancer stem cell function and indicates a poor clinical outcome in late-stage breast cancer patients.
Nozaki Y, Motomura H, Tamori S, Kimura Y, Onaga C, Kanai S, Ishihara Y, Ozaki A, Hara Y, Harada Y, Mano Y, Sato T, Sato K, Sasaki K, Ishiguro H, Ohno S, Akimoto K
PloS one 2020;15(7):e0235747
PloS one 2020;15(7):e0235747
Multi-omics profiling reveals key signaling pathways in ovarian cancer controlled by STAT3.
Lu T, Bankhead A 3rd, Ljungman M, Neamati N
Theranostics 2019;9(19):5478-5496
Theranostics 2019;9(19):5478-5496
Serum erythropoietin levels, breast cancer and breast cancer-initiating cells.
Bhat K, Sandler K, Duhachek-Muggy S, Alli C, Cheng F, Moatamed NA, Magyar CE, Du L, Li G, McCloskey S, Vlashi E, Pajonk F
Breast cancer research : BCR 2019 Jan 30;21(1):17
Breast cancer research : BCR 2019 Jan 30;21(1):17
No comments: Submit comment
Supportive validation
- Submitted by
- Invitrogen Antibodies (provider)
- Main image
- Experimental details
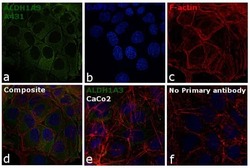
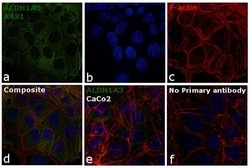
- Immunofluorescence analysis of ALDH1A3 was performed using 70% confluent log phase A-431 cells. The cells were fixed with 4% paraformaldehyde for 10 minutes, permeabilized with 0.1% Triton™ X-100 for 15 minutes, and blocked with 1% BSA for 1 hour at room temperature. The cells were labeled with ALDH1A3 Polyclonal Antibody (Product # PA5-29188) at 5 µg/mL in 0.1% BSA, incubated at 4 degree Celsius overnight and then labeled with Goat anti-Rabbit IgG (H+L) Superclonal™ Secondary Antibody, Alexa Fluor® 488 conjugate (Product # A27034) at a dilution of 1:2000 for 45 minutes at room temperature (Panel a: green). Nuclei (Panel b: blue) were stained with ProLong™ Diamond Antifade Mountant with DAPI (Product # P36962). F-actin (Panel c: red) was stained with Rhodamine Phalloidin (Product # R415). Panel d represents the merged image showing cytoplasmic localization. Panel e represents Caco-2 cells having lower expression of ALDH1A3. Panel f represents control cells with no primary antibody to assess background. The images were captured at 60X magnification.
- Submitted by
- Invitrogen Antibodies (provider)
- Main image
- Experimental details
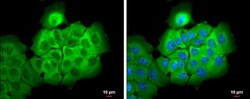
- Immunocytochemistry-Immunofluorescence analysis of ALDH1A3 was performed in A431 cells fixed in 4% paraformaldehyde at RT for 15 min. Green: ALDH1A3 Polyclonal Antibody (Product # PA5-29188) diluted at 1:500. Blue: Hoechst 33342 staining. Scale bar = 10 µm.

- Submitted by
- Invitrogen Antibodies (provider)
- Main image
- Experimental details
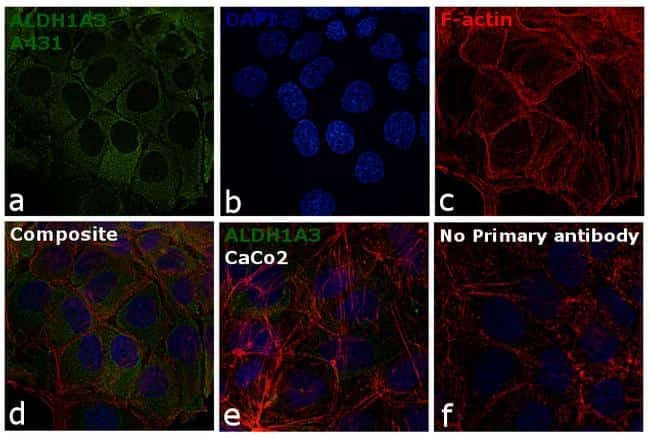
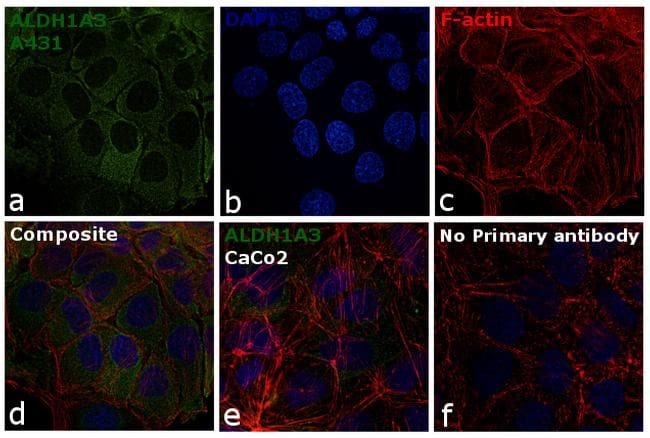
- Immunofluorescence analysis of ALDH1A3 was performed using 70% confluent log phase A-431 cells. The cells were fixed with 4% paraformaldehyde for 10 minutes, permeabilized with 0.1% Triton™ X-100 for 15 minutes, and blocked with 1% BSA for 1 hour at room temperature. The cells were labeled with ALDH1A3 Polyclonal Antibody (Product # PA5-29188) at 5 µg/mL in 0.1% BSA, incubated at 4 degree Celsius overnight and then labeled with Goat anti-Rabbit IgG (Heavy Chain) Superclonal™ Secondary Antibody, Alexa Fluor® 488 conjugate (Product # A27034) at a dilution of 1:2000 for 45 minutes at room temperature (Panel a: green). Nuclei (Panel b: blue) were stained with ProLong™ Diamond Antifade Mountant with DAPI (Product # P36962). F-actin (Panel c: red) was stained with Rhodamine Phalloidin (Product # R415). Panel d represents the merged image showing cytoplasmic localization. Panel e represents Caco-2 cells having lower expression of ALDH1A3. Panel f represents control cells with no primary antibody to assess background. The images were captured at 60X magnification.
- Submitted by
- Invitrogen Antibodies (provider)
- Main image

- Experimental details
- Immunocytochemistry-Immunofluorescence analysis of ALDH1A3 was performed in A431 cells fixed in 4% paraformaldehyde at RT for 15 min. Green: ALDH1A3 Polyclonal Antibody (Product # PA5-29188) diluted at 1:500. Blue: Hoechst 33342 staining. Scale bar = 10 µm.

Supportive validation
- Submitted by
- Invitrogen Antibodies (provider)
- Main image

- Experimental details
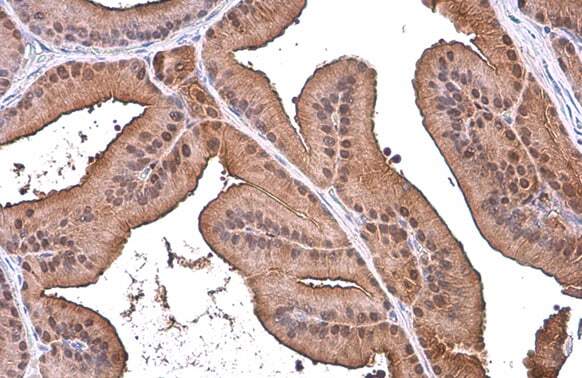
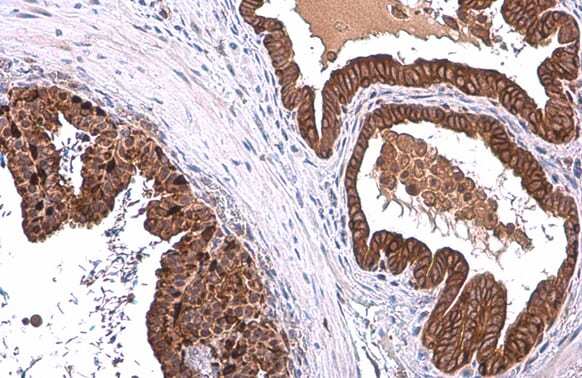
- Immunohistochemistry (Paraffin) analysis of ALDH1A3 was performed in paraffin-embedded rat prostate tissue using ALDH1A3 Polyclonal Antibody (Product # PA5-29188) at a dilution of 1:500. Antigen Retrieval: Citrate buffer, pH 6.0, 15 min.
- Submitted by
- Invitrogen Antibodies (provider)
- Main image
- Experimental details
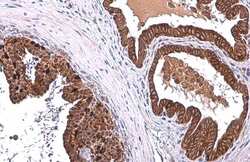
- Immunohistochemistry (Paraffin) analysis of ALDH1A3 was performed in paraffin-embedded mouse prostate tissue using ALDH1A3 Polyclonal Antibody (Product # PA5-29188) at a dilution of 1:500. Antigen Retrieval: Citrate buffer, pH 6.0, 15 min.
Supportive validation
- Submitted by
- Invitrogen Antibodies (provider)
- Main image
- Experimental details
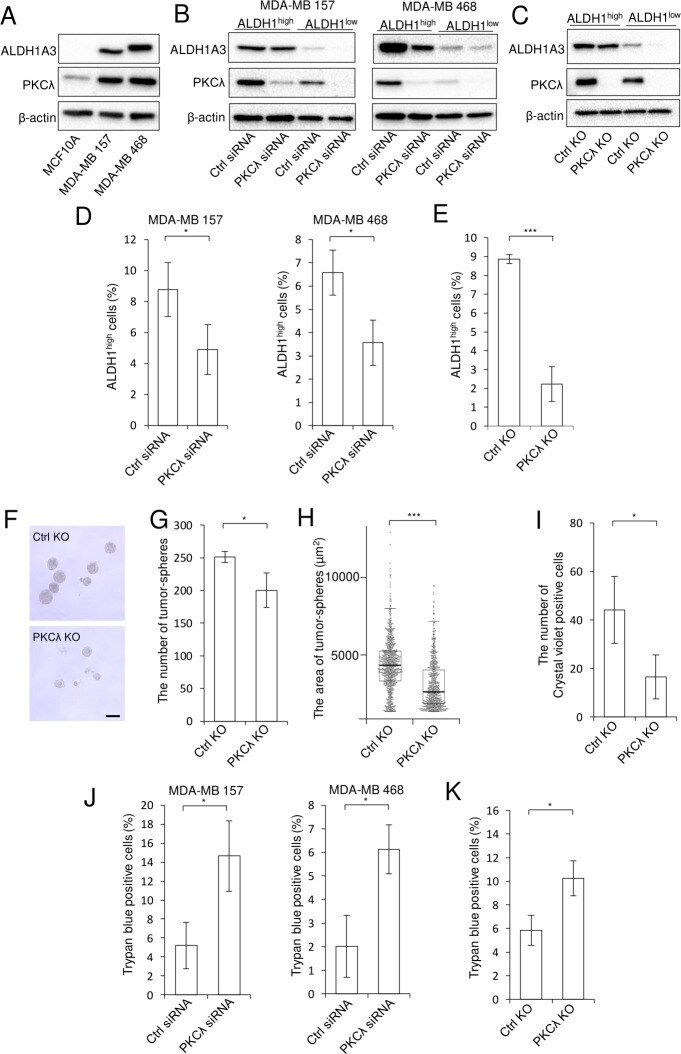
- Fig 3 PKClambda depletion reduces in vitro tumor-sphere formation and migration and increases cell death among ALDH1 high cells. (A) Immunoblot analysis of PKClambda and ALDH1A3 expression in MCF10A, MDA-MB 157 and MDA-MB 468 cells. (B) Immunoblot analysis of PKClambda and ALDH1A3 expression in ALDH1 high and ALDH1 low cells isolated after PKClambda KD using targeted siRNA in MDA-MB 157 (left) and MDA-MB 468 (right) cells. (C) Immunoblot analysis of PKClambda and ALDH1A3 in ALDH1 high and ALDH1 low cells isolated from control or MDA-MB 157 PKClambda KO cells. In panels A-C, beta-actin was used as an internal control. (D) ALDEFLUOR assays of the numbers of ALDH1 high cells isolated from among MDA-MB 157 (left) and MDA-MB 468 (right) cells after PKClambda KD using targeted siRNA. * p < 0.05, Student's t-test. (E) ALDEFLUOR assays of the numbers of ALDH1 high cells isolated from among control or MDA-MB 157 PKClambda KO cells. * p < 0.05, *** p < 0.001, Student's t-test. (F-H) in vitro tumor-sphere formation by ALDH1 high control or MDA-MB 157 PKClambda KO cells. Shown are representative images (F), numbers of tumor-spheres, * p < 0.05, Student's t-test (G), and areas of the tumor-spheres, *** p < 0.001, two-sided Mann-Whitney's U test (H). Scale bar, 50 mum. (I) Transwell migration of ALDH1 high control or MDA-MB 157 PKClambda KO cells. Cells that migrated to the lower side of the insert filter were stained with crystal violet and counted. * p < 0.05, Student's t-test. (J) Trypa
- Submitted by
- Invitrogen Antibodies (provider)
- Main image
- Experimental details
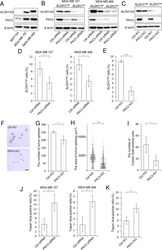
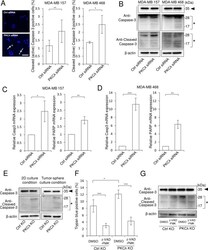
- Fig 4 PKClambda depletion leads to apoptosis in ALDH1 high cells. (A) Numbers of cleaved (active) caspase-3-positive ALDH1 high MDA-MB 157 cells 72 h after PKClambda siRNA transfection (left, representative immunofluorescent staining of cleaved (active) caspase-3 (green) and Hoechst 33342 staining (blue); right, quantitative values). * p < 0.05, ** p < 0.01 Student's t-test. Scale bar; 100 mum. (B) Immunoblot analysis of intact and cleaved caspase-3 in ALDH1 high MDA-MB 157 (left) and MDA-MB 468 (right) cells 48 h after PKClambda siRNA transfection of ALDH1 high cells. beta-actin was used as an internal control. (C-D) Quantitative PCR analysis of Casp3 and PARP in ALDH1 high cells isolated from MDA-MB 157 (C) and MDA-MB 468 (D) 48 h after PKClambda siRNA transfection. * p < 0.05, ** p < 0.01, *** p < 0.001, Student's t-test. (E) Immunoblot analysis of intact and cleaved caspase-3 in ALDH1 high control or MDA-MB 157 PKClambda KO cells under 2D (left) and tumor-sphere culture condition (right). beta-actin was used as an internal control. (F) Trypan blue assays in ALDH1 high control and MDA-MB 157 PKClambda KO cells after incubation with 0.5% DMSO (control) or 100 muM z-VAD-FMK for 48 h. * p < 0.05, *** p < 0.001, Tukey's test. (G) Immunoblot analysis of intact and cleaved caspase-3 in ALDH1 high control or MDA-MB 157 PKClambda KO cells after incubation with 0.5% DMSO (control) or 100 muM z-VAD-FMK for 48 h. The arrowheads mark intact Caspase-3, and asterisks mark Cleaved Caspas

- Submitted by
- Invitrogen Antibodies (provider)
- Main image
- Experimental details
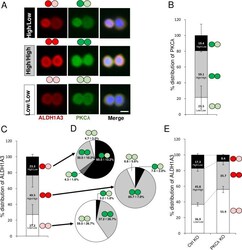
- Fig 5 PKClambda depletion leads to changes in the asymmetric distribution of ALDH1A3 in ALDH1 high cells. (A) Representative images of three types of distributed cell pairs of ALDH1 high MDA-MB 157 cells. Cells were immunostained for ALDH1A3 (red) and PKClambda (green) and with Hoechst 33342 (Blue). (B) Quantitative analysis of the percentage of cell pairs exhibiting PKClambda High/Low, High/High, and Low/Low among MDA-MB 157 ALDH1 high cells after incubation for 24 h. (C) Quantitative analysis of percentages of MDA-MB 157 ALDH1 high cell pairs exhibiting of High/Low, High/High, and Low/Low ALDH1A3 distributions after incubation for 24 h. (D) Quantitative analysis of the percentages of MDA-MB 157 ALDH1 high cell pairs exhibiting High/Low, High/High and Low/Low PKClambda distributions within each of the three ALDH1A3 distributions after incubation for 24 h. (E) Quantitative analysis of the High/High, High/Low and Low/Low ALDH1A3 distributions exhibited by pairs of control MDA-MB 157 ALDH1 high cells and PKClambda KO cells after incubation for 24 h. Data depict the mean +- SD (three independent experiments). Scale bar, 10 mum.

- Submitted by
- Invitrogen Antibodies (provider)
- Main image
- Experimental details
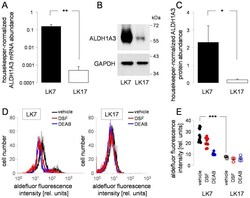
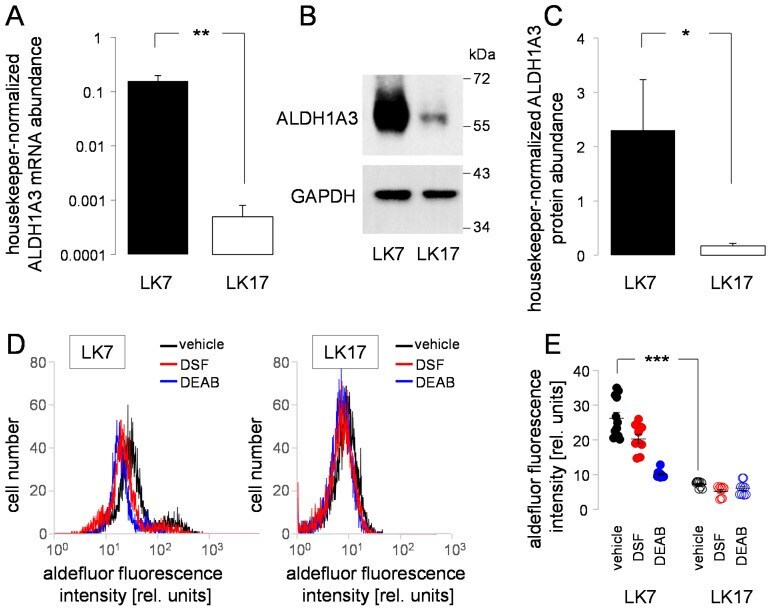
- Figure 3 Primary glioblastoma stem-cell cultures LK7 and LK17 differ in ALDH1A3 mRNA and protein abundance and in ALDH activity. ( A ) Mean (+-SE, n = 7-9) housekeeper-normalized ALDH1A3 mRNA abundance of LK7 (left) and LK17 cells (right) as quantified by real-time RT-PCR. ( B ) Representative immunoblots of total lysates from LK7 (left) and LK17 (right) cells probed against ALDH1A3 (top) and--for loading control--GAPDH (bottom). ( C ) Mean (+-SE, n = 9-10) housekeeper-normalized ALDH1A3 protein abundance of LK7 (left) and LK17 cells (right) determined as in ( B ) by immunoblotting. ( D ) Representative histograms recorded by flow cytometry showing the aldefluor-specific fluorescence intensity of LK7 (left) and LK17 (right) cells after incubation in the absence (vehicle, black) and presence of the ALDH inhibitor diethylaminobenzaldehyde (DEAB, 3 uM, blue) or disulfiram (DSF, 100 nM, red). ( E ) Individual and mean (+-SE, n = 9-12) aldefluor fluorescence intensities (geometrical means) measured as in (D) by flow cytometry in LK7 (left) and LK17 (right) cells after incubation with vehicle (black), disulfiram (red), or DEAB (blue). * and ** in ( A , C ) and *** in ( E ) indicate p
- Submitted by
- Invitrogen Antibodies (provider)
- Main image

- Experimental details
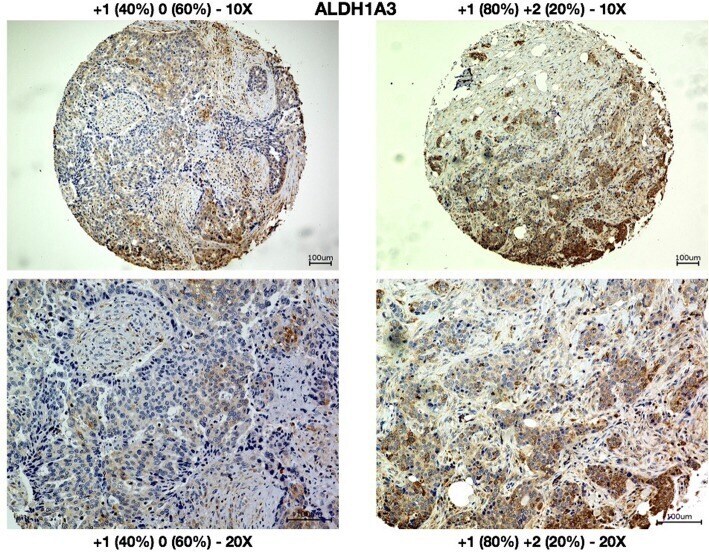
- Fig. 5 Sample cores of breast cancer specimen stained for ALDH1A3. Sample cores are shown at 10x (upper row) and 25x (lower row). Cores were scored based on the highest staining observed: Core one (left) with 40% of the cells staining + 1 and 60% staining 0 was scored + 1. Core two (right) with 80% of the cells staining + 1 and 20% staining + 2 was scored + 2. Scale bars = 100 mum