Explore
 Validate
 Learn
Learn Flow cytometry
Antibody data
- Antibody Data
- Antigen structure
- References [16]
- Comments [0]
- Validations
- Flow cytometry [2]
- Other assay [9]
Submit
Validation data
Reference
Comment
Report error
- Product number
- 25-0338-42 - Provider product page

- Provider
- Invitrogen Antibodies
- Product name
- CD33 Monoclonal Antibody (WM-53 (WM53)), PE-Cyanine7, eBioscience™
- Antibody type
- Monoclonal
- Antigen
- Other
- Description
- Description: The WM-53 monoclonal antibody reacts with human CD33, also known as GP67 and P67, a 67 kDa type I transmembrane glycoprotein that is a member of the Siglec (sialic acid-binding Ig superfamily lectin) family. It is highly specific to the hematopoietic compartment and is expressed on monocytes, activated T cells, granulocytes, myeloid progenitors, and mast cells. Applications Reported: This WM-53 (WM53) antibody has been reported for use in flow cytometric analysis. Applications Tested: This WM-53 (WM53) antibody has been pre-titrated and tested by flow cytometric analysis of normal human peripheral blood cells. This can be used at 5 µL (0.25 µg) per test. A test is defined as the amount (µg) of antibody that will stain a cell sample in a final volume of 100 µL. Cell number should be determined empirically but can range from 10^5 to 10^8 cells/test. Light sensitivity: This tandem dye is sensitive photo-induced oxidation. Please protect this vial and stained samples from light. Fixation: Samples can be stored in IC Fixation Buffer (Product # 00-822-49) (100 µL cell sample + 100 µL IC Fixation Buffer) or 1-step Fix/Lyse Solution (Product # 00-5333-54) for up to 3 days in the dark at 4°C with minimal impact on brightness and FRET efficiency/compensation. Some generalizations regarding fluorophore performance after fixation can be made, but clone specific performance should be determined empirically. Excitation: 488-561 nm; Emission: 775 nm; Laser: Blue Laser, Green Laser, Yellow-Green Laser. Filtration: 0.2 µm post-manufacturing filtered.
- Reactivity
- Human
- Host
- Mouse
- Isotype
- IgG
- Antibody clone number
- WM-53 (WM53)
- Vial size
- 100 Tests
- Concentration
- 5 µL/Test
- Storage
- 4°C, store in dark, DO NOT FREEZE!
Submitted references Connecting METTL3 and intratumoural CD33(+) MDSCs in predicting clinical outcome in cervical cancer.
Galectin-9 promotes a suppressive microenvironment in human cancer by enhancing STING degradation.
Using antagonistic pleiotropy to design a chemotherapy-induced evolutionary trap to target drug resistance in cancer.
Generation of Human Immunosuppressive Myeloid Cell Populations in Human Interleukin-6 Transgenic NOG Mice.
Exosomal transfer of mitochondria from airway myeloid-derived regulatory cells to T cells.
The creatine kinase pathway is a metabolic vulnerability in EVI1-positive acute myeloid leukemia.
Surrogate in vitro activation of innate immunity synergizes with interleukin-7 to unleash rapid antigen-driven outgrowth of CD4+ and CD8+ human peripheral blood T-cells naturally recognizing MUC1, HER2/neu and other tumor-associated antigens.
Antithymocyte Globulin at Clinically Relevant Concentrations Kills Leukemic Blasts.
Genetic Variability Overrides the Impact of Parental Cell Type and Determines iPSC Differentiation Potential.
Defining human dendritic cell progenitors by multiparametric flow cytometry.
A novel autosomal recessive TERT T1129P mutation in a dyskeratosis congenita family leads to cellular senescence and loss of CD34+ hematopoietic stem cells not reversible by mTOR-inhibition.
Metabolic regulation of hepatitis B immunopathology by myeloid-derived suppressor cells.
Replication of Salmonella enterica Serovar Typhimurium in Human Monocyte-Derived Macrophages.
SYK regulates mTOR signaling in AML.
Characterization of a novel population of low-density granulocytes associated with disease severity in HIV-1 infection.
Targeting CDK1 promotes FLT3-activated acute myeloid leukemia differentiation through C/EBPα.
Ni HH, Zhang L, Huang H, Dai SQ, Li J
Journal of translational medicine 2020 Oct 15;18(1):393
Journal of translational medicine 2020 Oct 15;18(1):393
Galectin-9 promotes a suppressive microenvironment in human cancer by enhancing STING degradation.
Zhang CX, Huang DJ, Baloche V, Zhang L, Xu JX, Li BW, Zhao XR, He J, Mai HQ, Chen QY, Zhang XS, Busson P, Cui J, Li J
Oncogenesis 2020 Jul 6;9(7):65
Oncogenesis 2020 Jul 6;9(7):65
Using antagonistic pleiotropy to design a chemotherapy-induced evolutionary trap to target drug resistance in cancer.
Lin KH, Rutter JC, Xie A, Pardieu B, Winn ET, Bello RD, Forget A, Itzykson R, Ahn YR, Dai Z, Sobhan RT, Anderson GR, Singleton KR, Decker AE, Winter PS, Locasale JW, Crawford L, Puissant A, Wood KC
Nature genetics 2020 Apr;52(4):408-417
Nature genetics 2020 Apr;52(4):408-417
Generation of Human Immunosuppressive Myeloid Cell Populations in Human Interleukin-6 Transgenic NOG Mice.
Hanazawa A, Ito R, Katano I, Kawai K, Goto M, Suemizu H, Kawakami Y, Ito M, Takahashi T
Frontiers in immunology 2018;9:152
Frontiers in immunology 2018;9:152
Exosomal transfer of mitochondria from airway myeloid-derived regulatory cells to T cells.
Hough KP, Trevor JL, Strenkowski JG, Wang Y, Chacko BK, Tousif S, Chanda D, Steele C, Antony VB, Dokland T, Ouyang X, Zhang J, Duncan SR, Thannickal VJ, Darley-Usmar VM, Deshane JS
Redox biology 2018 Sep;18:54-64
Redox biology 2018 Sep;18:54-64
The creatine kinase pathway is a metabolic vulnerability in EVI1-positive acute myeloid leukemia.
Fenouille N, Bassil CF, Ben-Sahra I, Benajiba L, Alexe G, Ramos A, Pikman Y, Conway AS, Burgess MR, Li Q, Luciano F, Auberger P, Galinsky I, DeAngelo DJ, Stone RM, Zhang Y, Perkins AS, Shannon K, Hemann MT, Puissant A, Stegmaier K
Nature medicine 2017 Mar;23(3):301-313
Nature medicine 2017 Mar;23(3):301-313
Surrogate in vitro activation of innate immunity synergizes with interleukin-7 to unleash rapid antigen-driven outgrowth of CD4+ and CD8+ human peripheral blood T-cells naturally recognizing MUC1, HER2/neu and other tumor-associated antigens.
Pathangey LB, McCurry DB, Gendler SJ, Dominguez AL, Gorman JE, Pathangey G, Mihalik LA, Dang Y, Disis ML, Cohen PA
Oncotarget 2017 Feb 14;8(7):10785-10808
Oncotarget 2017 Feb 14;8(7):10785-10808
Antithymocyte Globulin at Clinically Relevant Concentrations Kills Leukemic Blasts.
Dabas R, Lee R, Servito MT, Dharmani-Khan P, Modi M, van Slyke T, Luider J, Durand C, Larratt L, Brandwein J, Morris D, Daly A, Khan FM, Storek J
Biology of blood and marrow transplantation : journal of the American Society for Blood and Marrow Transplantation 2016 May;22(5):815-24
Biology of blood and marrow transplantation : journal of the American Society for Blood and Marrow Transplantation 2016 May;22(5):815-24
Genetic Variability Overrides the Impact of Parental Cell Type and Determines iPSC Differentiation Potential.
Kyttälä A, Moraghebi R, Valensisi C, Kettunen J, Andrus C, Pasumarthy KK, Nakanishi M, Nishimura K, Ohtaka M, Weltner J, Van Handel B, Parkkonen O, Sinisalo J, Jalanko A, Hawkins RD, Woods NB, Otonkoski T, Trokovic R
Stem cell reports 2016 Feb 9;6(2):200-12
Stem cell reports 2016 Feb 9;6(2):200-12
Defining human dendritic cell progenitors by multiparametric flow cytometry.
Breton G, Lee J, Liu K, Nussenzweig MC
Nature protocols 2015 Sep;10(9):1407-22
Nature protocols 2015 Sep;10(9):1407-22
A novel autosomal recessive TERT T1129P mutation in a dyskeratosis congenita family leads to cellular senescence and loss of CD34+ hematopoietic stem cells not reversible by mTOR-inhibition.
Stockklausner C, Raffel S, Klermund J, Bandapalli OR, Beier F, Brümmendorf TH, Bürger F, Sauer SW, Hoffmann GF, Lorenz H, Tagliaferri L, Nowak D, Hofmann WK, Buergermeister R, Kerber C, Rausch T, Korbel JO, Luke B, Trumpp A, Kulozik AE
Aging 2015 Nov;7(11):911-27
Aging 2015 Nov;7(11):911-27
Metabolic regulation of hepatitis B immunopathology by myeloid-derived suppressor cells.
Pallett LJ, Gill US, Quaglia A, Sinclair LV, Jover-Cobos M, Schurich A, Singh KP, Thomas N, Das A, Chen A, Fusai G, Bertoletti A, Cantrell DA, Kennedy PT, Davies NA, Haniffa M, Maini MK
Nature medicine 2015 Jun;21(6):591-600
Nature medicine 2015 Jun;21(6):591-600
Replication of Salmonella enterica Serovar Typhimurium in Human Monocyte-Derived Macrophages.
Lathrop SK, Binder KA, Starr T, Cooper KG, Chong A, Carmody AB, Steele-Mortimer O
Infection and immunity 2015 Jul;83(7):2661-71
Infection and immunity 2015 Jul;83(7):2661-71
SYK regulates mTOR signaling in AML.
Carnevale J, Ross L, Puissant A, Banerji V, Stone RM, DeAngelo DJ, Ross KN, Stegmaier K
Leukemia 2013 Nov;27(11):2118-28
Leukemia 2013 Nov;27(11):2118-28
Characterization of a novel population of low-density granulocytes associated with disease severity in HIV-1 infection.
Cloke T, Munder M, Taylor G, Müller I, Kropf P
PloS one 2012;7(11):e48939
PloS one 2012;7(11):e48939
Targeting CDK1 promotes FLT3-activated acute myeloid leukemia differentiation through C/EBPα.
Radomska HS, Alberich-Jordà M, Will B, Gonzalez D, Delwel R, Tenen DG
The Journal of clinical investigation 2012 Aug;122(8):2955-66
The Journal of clinical investigation 2012 Aug;122(8):2955-66
No comments: Submit comment
Supportive validation
- Submitted by
- Invitrogen Antibodies (provider)
- Main image
- Experimental details
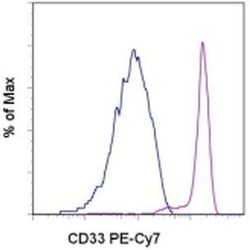
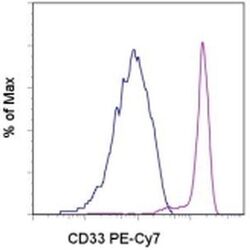
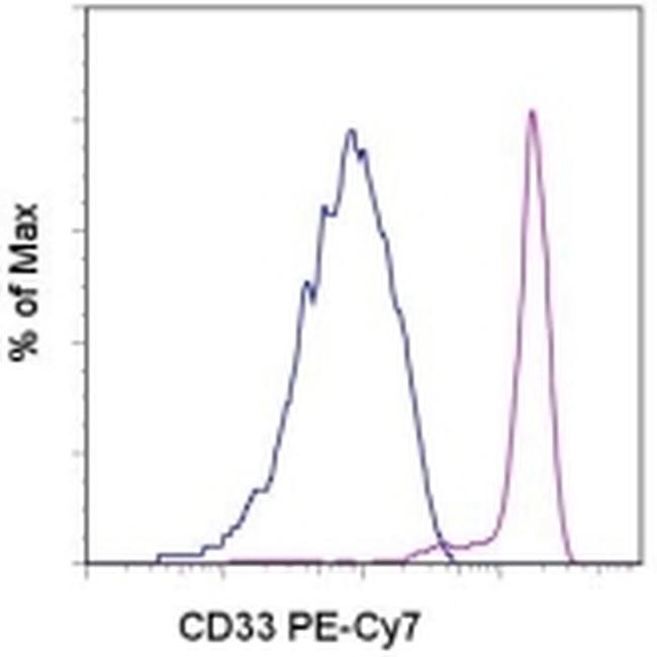
- Staining of normal human peripheral blood cells with Mouse IgG1 kappa Isotype Control PE-Cyanine7 (Product # 25-4714-80) (blue histogram) or Anti-Human CD33 PE-Cyanine7 (purple histogram). Cells in the monocyte gate were used for analysis.
- Submitted by
- Invitrogen Antibodies (provider)
- Main image
- Experimental details
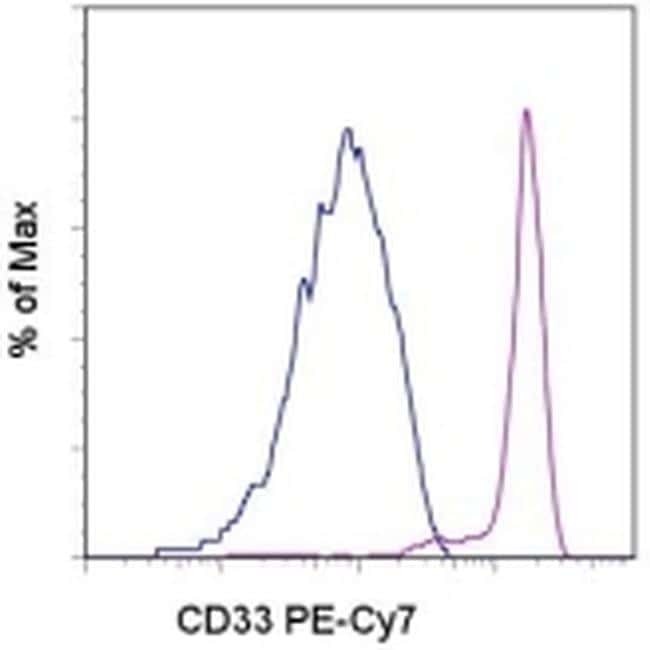
- Staining of normal human peripheral blood cells with Mouse IgG1 kappa Isotype Control PE-Cyanine7 (Product # 25-4714-80) (blue histogram) or Anti-Human CD33 PE-Cyanine7 (purple histogram). Cells in the monocyte gate were used for analysis.
Supportive validation
- Submitted by
- Invitrogen Antibodies (provider)
- Main image

- Experimental details
- NULL
- Submitted by
- Invitrogen Antibodies (provider)
- Main image
- Experimental details
- NULL
- Submitted by
- Invitrogen Antibodies (provider)
- Main image
- Experimental details
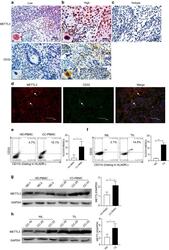
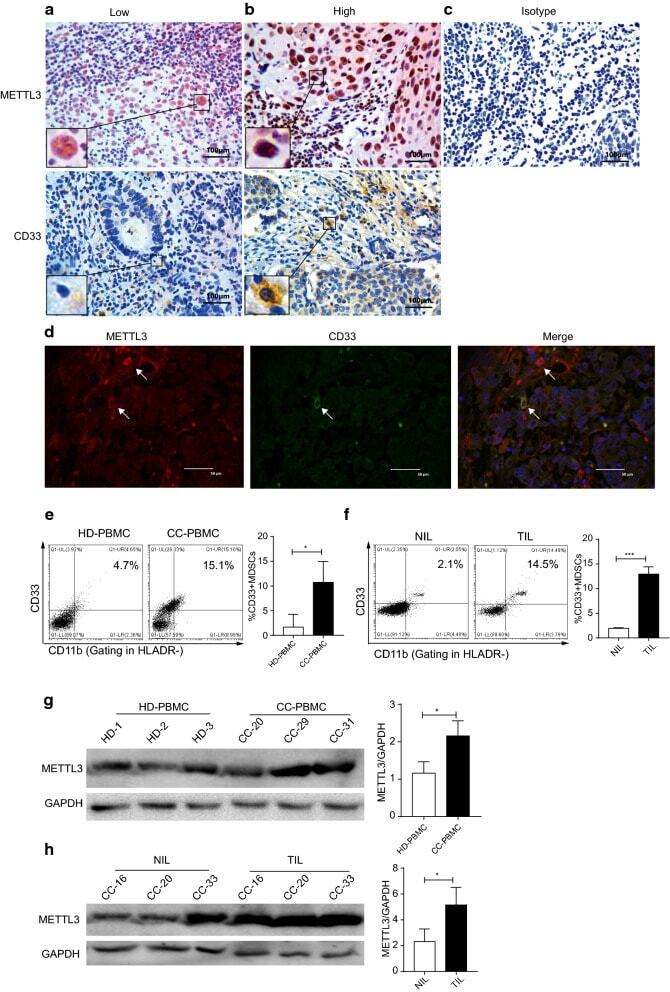
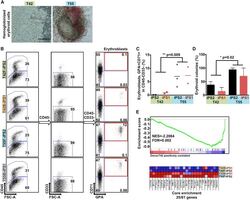
- Fig. 1 METTL3 expression and CD33 + MDSC distribution in patients with CC. a , b The immunohistochemical staining for METL3 and CD33 CC specimens (x 400). c The isotype antibody IgG was included (x 400). d Immunofluorescence staining for METTL3 (red) and CD33 + (green) in CC specimens; the white arrows point to the METTL3 + and CD33 + cells. The images were taken by fluorescence microscope. HLA-DR - CD33 + CD11b + cells were gated by a FACS gating strategy and were defined as MDSCs in this study. e , f Representative density plots showed the MDSC population in the peripheral blood of healthy donors (HD) or CC patients, as well as in the immune cells from tumour tissues (TIL) or tumour-adjacent tissues (NIL). A statistical graph is included for the comparison between the indicated groups. (G-H) Representative immunoblotting shows the expression of METTL3 in the peripheral blood, TILs and NILs. A statistical graph is included for the comparison between the indicated groups. The experiments in e , f were performed at least three times, and the data were plotted as the mean +- SEM. Statistics were conducted with an unpaired Student''s t test, * P < 0.05, and *** P < 0.001 vs. the corresponding control
- Submitted by
- Invitrogen Antibodies (provider)
- Main image
- Experimental details
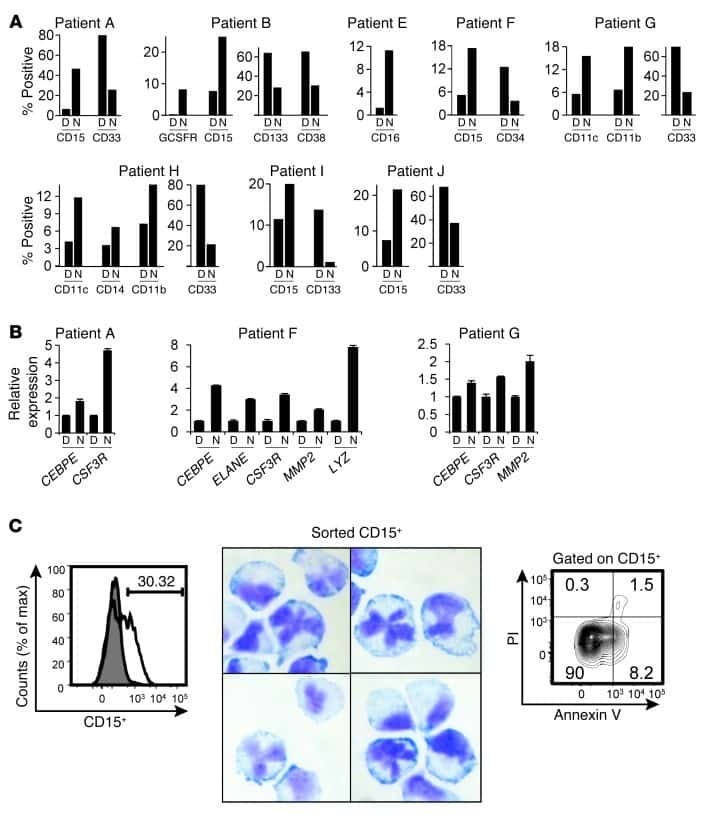
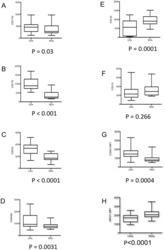
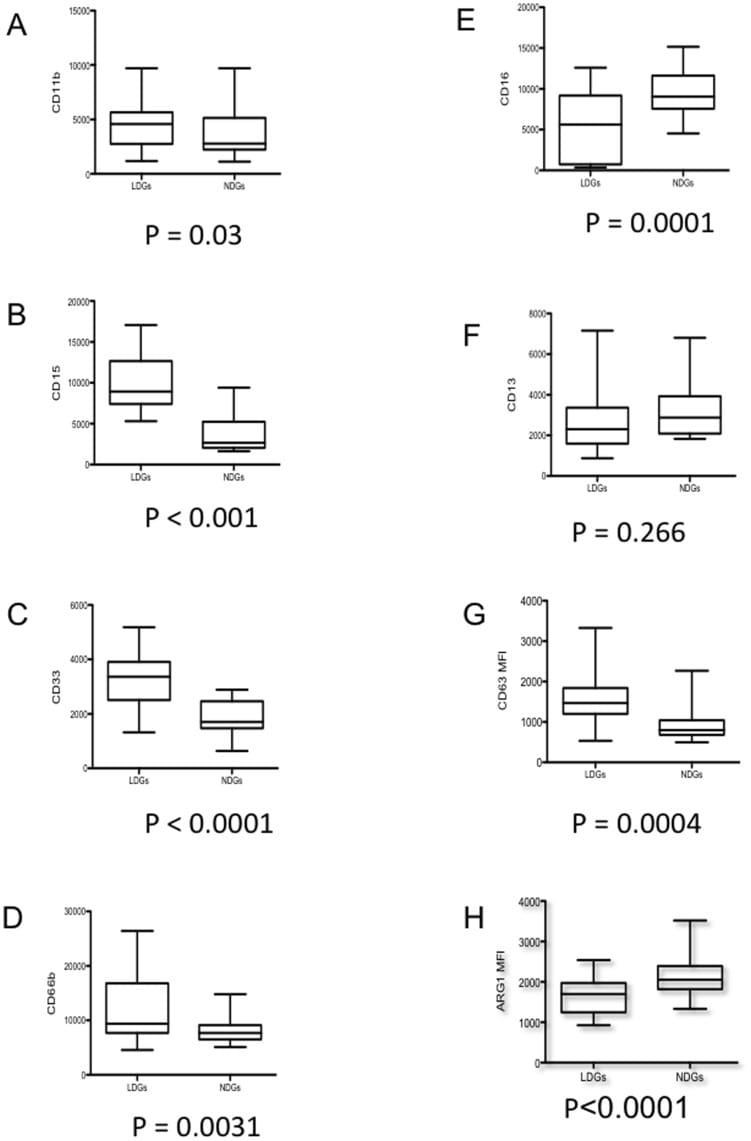
- Figure 2 Phenotypic analysis of LDGs and NDGs. LDGs and NDGs were isolated as described in materials and methods (n = 22) and the expression levels of CD11b (A), CD15 (B), CD33 (C), CD66b (D), CD16 (E), CD13 (F), CD63 (G) and arginase 1 (H) were determined by flow cytometry. Isotype controls:
- Submitted by
- Invitrogen Antibodies (provider)
- Main image

- Experimental details
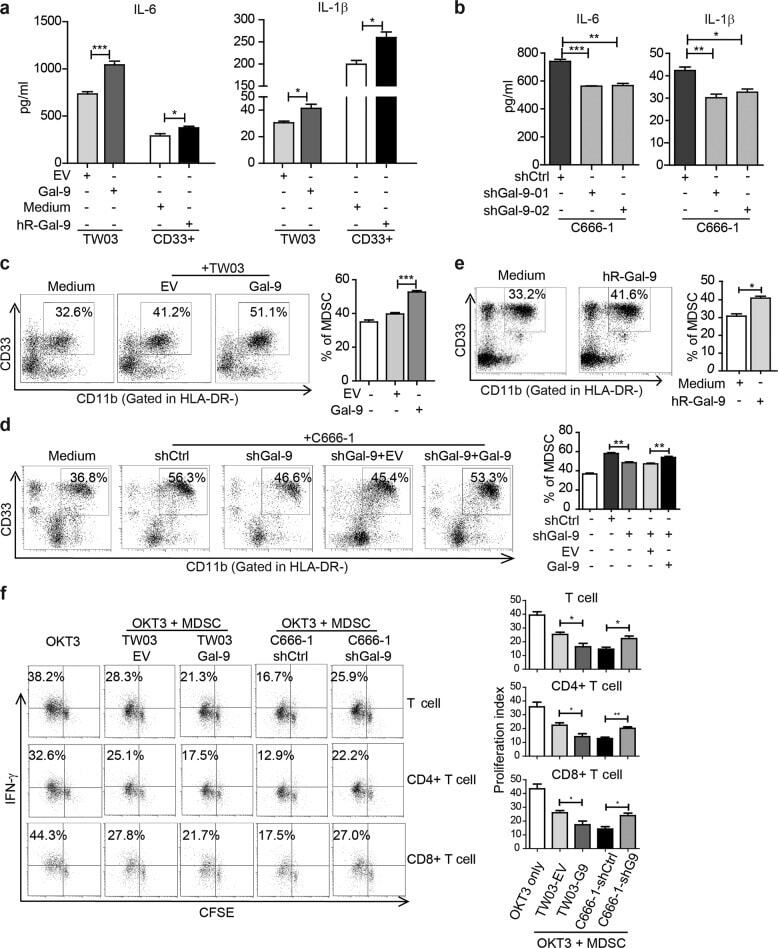
- Fig. 2 The effect of intra- and extra-cellular Gal-9 on MDSC differentiation and expansion in vitro. ELISA assay of IL-6 and IL-1beta concentrations in the conditioned media of TW03-EV and TW03-Gal-9 cells or CD33 + cells ( a ) or Gal-9 knockdown (shGal9-01 and shGal9-02) and control C666-1 cells ( b ) with or without addition of human recombinant Gal-9 (hR-Gal-9). c Differentiation of CD33 + cells isolated from healthy PBMCs investigated after treatment with control medium, co-cultivation with TW03-EV or TW03-Gal-9. Representative flow cytometry plots ( left ) and histogram ( right ) of MDSC differentiation assays showing the percentage of CD33 + CD11b + cells in the HLA-DR - gate arising from CD33 + cells. d Similar experiment based on co-cultivation with C666-1 cells using four experimental conditions: C666-1-shCtrl cells (shCtrl), unmodified C666-1-shGal9-01 (shGal-9), C666-1-shGal9-01 co-transfected with a control lentiviral vector (shGal9 + EV) or a Gal-9 lentiviral vector (ShGal-9+Gal-9). e Representative flow cytometry plots ( left ) and histogram ( right ) of MDSC differentiation assays showing the percentage of CD33 + CD11b + cells in the HLA-DR - gate arising from CD33 + cells with or without addition of human recombinant Gal-9 (hR-Gal-9). f Representative flow cytometry plots ( left ) and histogram ( right ) of the IFN-gamma-positive, proliferating T cells (CSFE assay) to test the immune-suppressive activity of MDSC cells induced by TW03-EV and TW03-Gal-9 or C666-
- Submitted by
- Invitrogen Antibodies (provider)
- Main image
- Experimental details
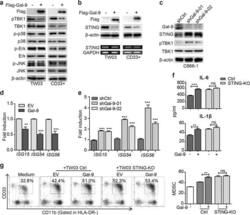
- Fig. 3 Endogenous Gal-9 downregulates STING leading to tumor-associated MDSC expansion depending on cytokine-induction. a The extracts of TW03 cells stably expressing Flag-tagged-EV or Gal-9 (left) and CD33 + cells transfected with lenti-flag-tagged-EV or lenti-flagged-Gal-9 vector (right) were subjected to immunoblot with the indicated antibodies. b Upper panel: the lysates of TW03 cells and CD33 + cells expressing Flag-tagged EV or Gal-9 were subjected to immunoblot with the indicated antibodies. Lower panel: RT-PCR analysis of STING mRNA; GAPDH mRNA served as a transcript of reference. c The lysates of C666-1 cells transfected with Gal-9-specific shRNAs were subjected to immunoblot with the indicated antibodies. The mRNA expression levels of ISG genes were determined in TW03 cells transfected with the Gal-9-expressing vector or EV ( d ) C666-1 cells transfected with shRNA targeting Gal-9 ( e ) or corresponding control vectors using quantitative real time PCR (qRT-PCR). f ELISA assay of IL-6 and IL-1beta concentrations in the supernatants from control or STING-KO TW03 cells, transfected with Flag-EV and Flag-Gal-9 for 48 h. g Representative flow cytometry plots ( left ) and histogram ( right ) of MDSC differentiation assay for CD33 + cells co-cultured with Control (Ctrl) or STING-KO TW03 cells, transfected with Flag- EV or Flag-Gal-9 for 48 h. All experiments were performed at least three times, and the quantification data were plotted as the mean +- SEM. Statistics were co

- Submitted by
- Invitrogen Antibodies (provider)
- Main image
- Experimental details
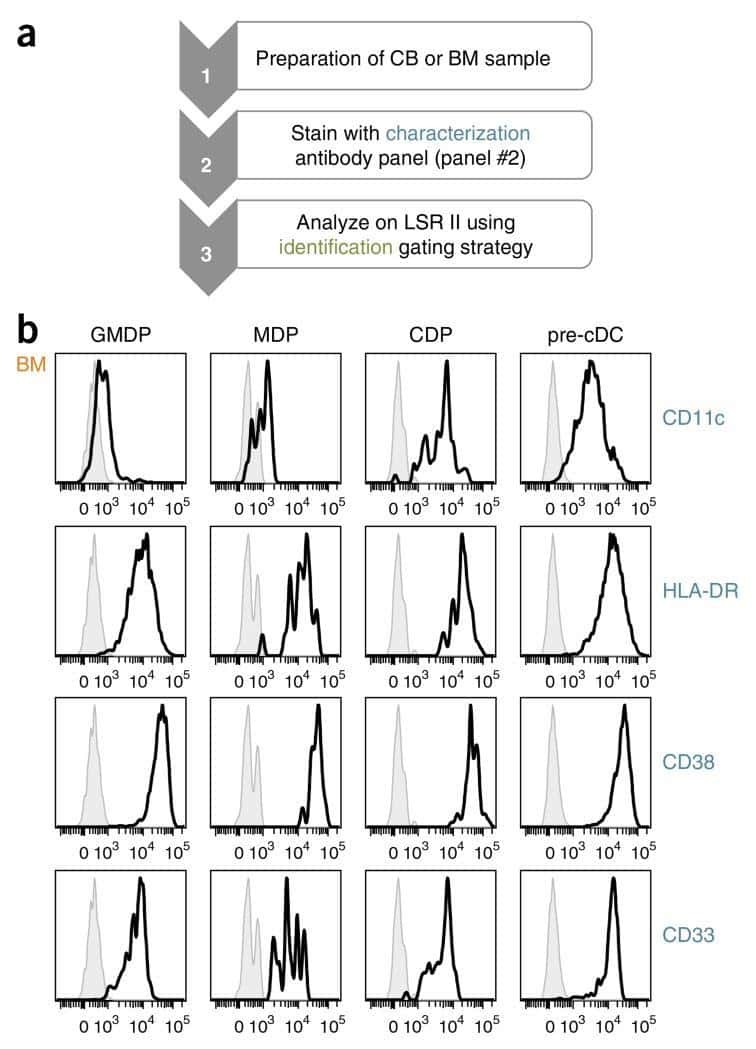
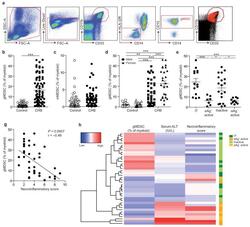
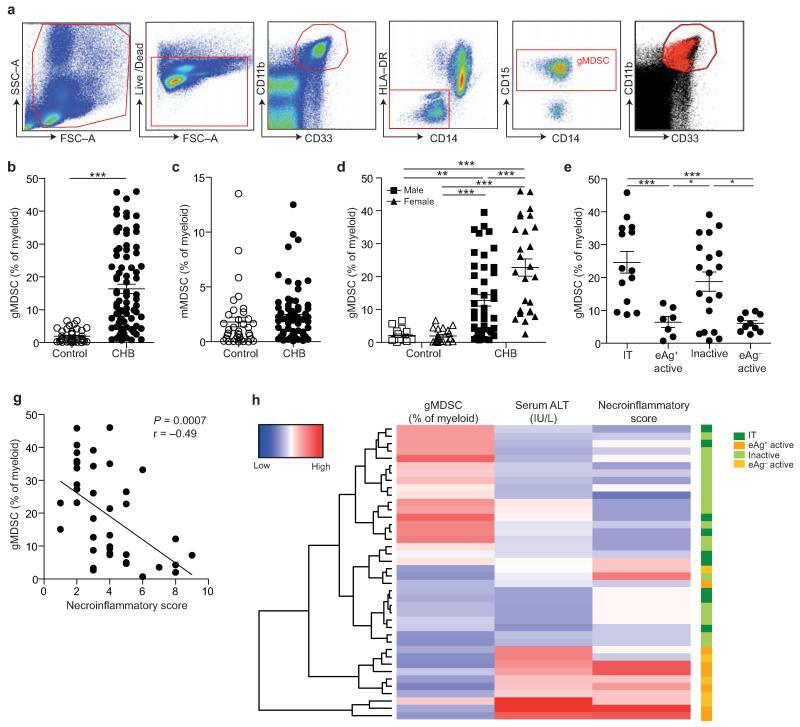
- Figure 1 gMDSC expand in subjects replicating HBV in the absence of immunopathology a ) Sequential gating strategy for gMDSC identification (CD11b high CD33 + HLA-DR - CD14 - CD15 + ) using 11-color flow cytometry from freshly isolated PBMC (doublet discrimination not shown). gMDSC population (superimposed in red) was calculated as a percentage of myeloid cells (CD11b high CD33 + ). Cumulative dot plots showing circulating b ) gMDSC and c ) mMDSC frequencies (n=44, healthy controls; n=84, CHB). d ) gMDSC frequencies analyzed by gender. e ) Summary plot of frequencies classified by disease phase using a subset of the cohort with clearly defined disease phases: 14 ""immunotolerants"" (HBeAg + , HBV DNA >10 7 IU/ml, ALT 5x10 5 IU/ml, ALT >60 IU/L), 21 ""inactive disease"" (HBeAg - , HBV DNA 60 IU/L). f ) gMDSC frequencies according to hepatic necroinflammatory score (n=42, CHB). g ) Unsupervised hierarchical clustering using Euclidean distance; dendrogram displaying similarity between clusters. Clinically assigned disease phase, shown adjacent to plot; immunotolerant: dark green, eAg + active disease: dark yellow, inactive disease: pale green, eAg - active disease: pale yellow (not used for analysis). Increasing color intensity (blue-red) corresponds to increasing gMDSC frequency, ALT (IU/L) or necroinflammatory score (n=42, CHB; maximum
- Submitted by
- Invitrogen Antibodies (provider)
- Main image
- Experimental details
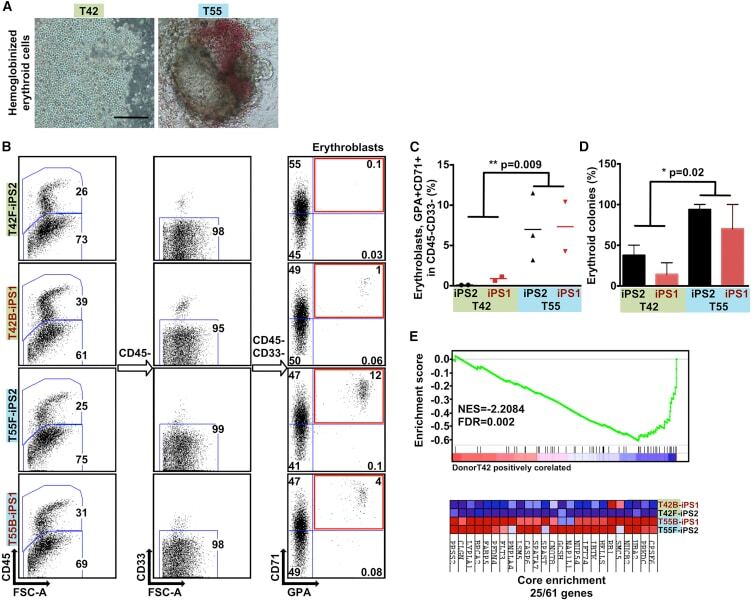
- Figure 5 iPSCs Derived from Different Donors Show Variable Erythroid Lineage Differentiation Propensity (A) Representative micrographs showing the hematopoietic cells differentiated from iPSCs with reduced hemoglobinized erythroid cells in iPSCs derived from T42 (left panel). Scale bar, 100 mum. (B) Representative FACS plots of differentiated genetically matched F- and B-iPSC lines (n = 4) showing the percentage of erythroblasts (GPA+ CD71+ gated from CD45- CD33-). (C) Scatter graphs presenting percentage of erythroblasts generated from the genetically matched F- and B-iPSC lines. Each dot represents an independent experiment. (D) Percentage of erythroid colonies out of the total colony number generated from iPSC lines. Values are mean +- SEM. Statistics performed by Student's t test, in three or four biological replicates. (E) Gene set enrichment plot and heatmap showing the genes constituting the core enrichment of overlap between multi-potent progenitors sorted from the bone marrow of DBA patients and iPSC lines derived from T42 cells. T42 iPSC lines show decreased expression levels of genes that are downregulated in Diamond-Blackfan anemia patients.
- Submitted by
- Invitrogen Antibodies (provider)
- Main image
- Experimental details
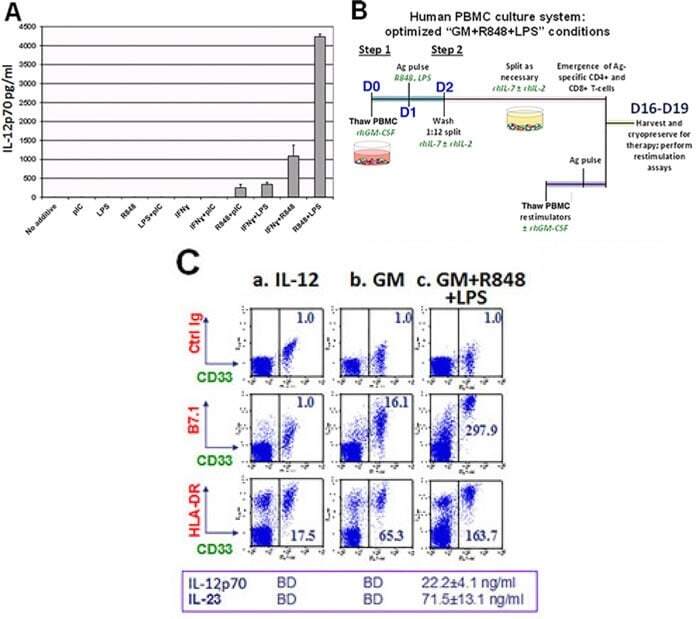
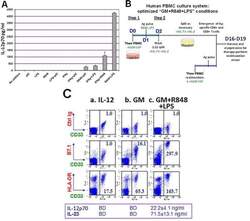
- Figure 1 Unfractionated PBMC contain highly serviceable, readily activated myeloid Ag-presenting cells A . Cryopreserved healthy donor PBMC derived by leukapheresis were thawed on d0, cultured overnight in RPMI 1640 with standard additives,10% heat deactivated human AB serum, 40ng/ml rhGM-CSF and 20ng/ml rhIL-4, then exposed on d1 to single or paired danger signals (pIC 50mug/ml, R848 10muM, LPS 50ng/ml, IFNgamma 2000 IU/ml). Supernatants were harvested for ELISA on d2 to determine production of IL-12 (functionally assembled IL-12p70 dimer), pg/ml, 6 million PBMC/ml. This is representative of 8 biological replicates. B . Scheme depicting Steps 1 and 2 of culture for groups receiving rhGM-CSF+R848+LPS. C . d2 analyses of PBMC cultured three different ways: (a) standard ""IL-12"" culture group (2 days prior to their initial exposure to rhIL-12 and rhIL-2); (b) ""GM"" conditioned culture group which received rhGM-CSF (40 ng/ml) on d0; (c) ""GM+R848+LPS"" group, same as ""GM"" group but also receiving R848+LPS on d1. d2 supernatants were assayed for IL-12p70 and IL-23 (BD = below detection) and resuspended PBMC were analyzed by FACS for B7.1 and HLA-DR expression within the CD33+ myeloid subpopulation. Mean fluorescent indices (MFI) were normalized relative to isotype control values of 1.0, and are representative of 5 biological replicates. D . Same groups as in C ., carried forward in culture after pulsation either with Candida albicans extract at a 1:10 dilution (CAN) or with r