Explore
 Validate
 Learn
Learn11-7096-81
antibody from Invitrogen Antibodies
Targeting: CCL2
GDCF-2, HC11, MCAF, MCP-1, MCP1, MGC9434, SCYA2, SMC-CF
 Flow cytometry
Antibody data
- Antibody Data
- Antigen structure
- References [6]
- Comments [0]
- Validations
- Flow cytometry [1]
- Other assay [3]
Submit
Validation data
Reference
Comment
Report error
- Product number
- 11-7096-81 - Provider product page

- Provider
- Invitrogen Antibodies
- Product name
- CCL2 (MCP-1) Monoclonal Antibody (2H5), FITC, eBioscience™
- Antibody type
- Monoclonal
- Antigen
- Other
- Description
- Description: The 2H5 monoclonal antibody reacts with mouse, rat, and human monocyte chemoattractant protein-1 (MCP-1), also known as CCL2 and MCAF.
- Conjugate
- Green dye
- Antibody clone number
- 2H5
- Concentration
- 0.5 mg/mL
Submitted references Apoptotic vesicles restore liver macrophage homeostasis to counteract type 2 diabetes.
Astrocytic interleukin-3 programs microglia and limits Alzheimer's disease.
Conditioned medium from umbilical cord mesenchymal stem cells induces migration and angiogenesis.
Mechanisms underlying renoprotection during renin-angiotensin system blockade.
Mechanisms underlying renoprotection during renin-angiotensin system blockade.
Macrophage inflammatory protein-2 and KC induce chemokine production by mouse astrocytes.
Zheng C, Sui B, Zhang X, Hu J, Chen J, Liu J, Wu D, Ye Q, Xiang L, Qiu X, Liu S, Deng Z, Zhou J, Liu S, Shi S, Jin Y
Journal of extracellular vesicles 2021 May;10(7):e12109
Journal of extracellular vesicles 2021 May;10(7):e12109
Astrocytic interleukin-3 programs microglia and limits Alzheimer's disease.
McAlpine CS, Park J, Griciuc A, Kim E, Choi SH, Iwamoto Y, Kiss MG, Christie KA, Vinegoni C, Poller WC, Mindur JE, Chan CT, He S, Janssen H, Wong LP, Downey J, Singh S, Anzai A, Kahles F, Jorfi M, Feruglio PF, Sadreyev RI, Weissleder R, Kleinstiver BP, Nahrendorf M, Tanzi RE, Swirski FK
Nature 2021 Jul;595(7869):701-706
Nature 2021 Jul;595(7869):701-706
Conditioned medium from umbilical cord mesenchymal stem cells induces migration and angiogenesis.
Shen C, Lie P, Miao T, Yu M, Lu Q, Feng T, Li J, Zu T, Liu X, Li H
Molecular medicine reports 2015 Jul;12(1):20-30
Molecular medicine reports 2015 Jul;12(1):20-30
Mechanisms underlying renoprotection during renin-angiotensin system blockade.
Taal MW, Chertow GM, Rennke HG, Gurnani A, Jiang T, Shahsafaei A, Troy JL, Brenner BM, Mackenzie HS
American journal of physiology. Renal physiology 2001 Feb;280(2):F343-55
American journal of physiology. Renal physiology 2001 Feb;280(2):F343-55
Macrophage inflammatory protein-2 and KC induce chemokine production by mouse astrocytes.
Luo Y, Fischer FR, Hancock WW, Dorf ME
Journal of immunology (Baltimore, Md. : 1950) 2000 Oct 1;165(7):4015-23
Journal of immunology (Baltimore, Md. : 1950) 2000 Oct 1;165(7):4015-23
No comments: Submit comment
Supportive validation
- Submitted by
- Invitrogen Antibodies (provider)
- Main image

- Experimental details
- Staining of 1-day LPS-stimulated human peripheral blood cells with 0.5 µg of Armenian Hamster IgG Isotype Control FITC (Product # 11-4888-81) (open histogram) or 0.5 µg of Anti-CCL2 (MCP-1) FITC (filled histogram). Cells in the monocyte gate were used for analysis.
- Conjugate
- Green dye

Supportive validation
- Submitted by
- Invitrogen Antibodies (provider)
- Main image

- Experimental details
- FIGURE 3 Efferocytosis of MSC-derived apoVs by liver macrophages alleviates macrophage infiltration in the type 2 diabetes (T2D) liver. (a) Representative confocal microscopy images showing distribution of PKH26-labeled apoVs (red) in the liver, counterstained by Hoechst (blue). After removal of unbound PKH, the stained apoVs were resuspended in PBS and underwent centrifugation, after which the supernatant was used as the negative control (NC) and injected. Scale bars, 50 mum. (b) Representative confocal microscopy images showing uptake of apoVs (red) by macrophages (green) in the liver, counterstained by Hoechst (blue). Scale bars, 50 mum in low magnification images and 25 mum in high magnification images. (c) Flow cytometric analysis showing the uptake of apoVs by macrophages in the liver. KCs, Kupffer cells; MoMFs, monocyte-derived macrophages. (d) Representative immunofluorescent (IF) staining images of F4/80 (green) and CD11b (green) in the liver, counterstained by Hoechst (blue). Ctrl, control mice; DIO, mice with diet-induced obesity; apoV, DIO mice treated by apoVs. Scale bars, 50 mum. (e) Flow cytometric analysis and the corresponding quantification of the percentages of KCs and MoMFs in hepatic CD45 + cells. N = 6 per group. (f) Representative IF staining images of chemokine (C-C motif) ligand 2 (CCL2) (red) in the liver, counterstained by Hoechst (blue). Scale bars, 50 mum. (g) Enzyme-linked immunosorbent assay (ELISA) analysis of CCL2 in liver lysate and serum. N
- Conjugate
- Green dye

- Submitted by
- Invitrogen Antibodies (provider)
- Main image

- Experimental details
- FIGURE 8 CRT mediates efferocytosis of MSC-derived apoVs to modulate T2D liver macrophages in vivo. (a) Representative immunofluorescent (IF) staining images of F4/80 (green) and CD11b (green) in the liver, counterstained by Hoechst (blue). DIO, mice with diet-induced obesity; si-NC-apoV, DIO mice treated by apoVs derived from MSCs transfected by siRNA-negative control; si- CRT -apoV, DIO mice treated by apoVs derived from MSCs transfected by siRNA- CRT . Scale bars, 50 mum. (b) Flow cytometric analysis and the corresponding quantification of the percentages of KCs and MoMFs in hepatic CD45 + cells. KCs, Kupffer cells; MoMFs, monocyte-derived macrophages. N = 5-6 per group. (c) Representative IF staining images of chemokine (C-C motif) ligand 2 (CCL2) (red) in the liver, counterstained by Hoechst (blue). Scale bars, 50 mum. (d and e) ELISA analysis of CCL2 in liver lysate (d) and serum (e). N = 6 per group. (f and g) Representative IF staining images of tumor necrosis factor-alpha (TNF-alpha) (red) and CD206 (green) in the liver, counterstained by Hoechst (blue), and the corresponding quantification of fold changes over the DIO group. Scale bars, 50 mum. N = 5-6 per group. (h and i) Quantitative real time polymerase chain reaction (qRT-PCR) analysis of mRNA expression levels of Tnf (h) and interleukin 10 ( Il10 ) (i) in the liver, normalized to beta-actin ( Actb ), and quantification of fold changes over the DIO group. N = 5 per group. (j and k) Enzyme-linked immunosorbent as
- Conjugate
- Green dye

- Submitted by
- Invitrogen Antibodies (provider)
- Main image
- Experimental details
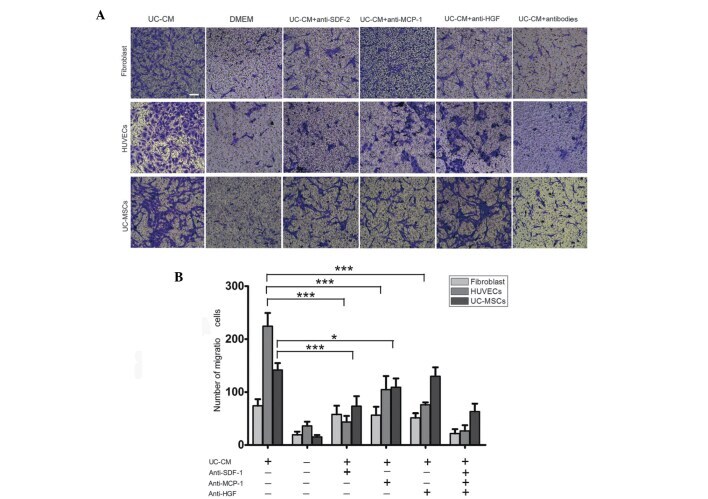
- Figure 5 Migration of fibroblasts, HUVECs and UC-MSCs in response to UC-CM. (A) A total of 5x10 4 cells were collected and allowed to migrate. Lane 1, UC-CM; lane 2, DMEM; lanes 3-6, in the presence or absence of anti-SDF-1 (20 mu g/ml), anti-MCP-1 (20 mu g/ml) or anti-HGF (20 mu g/ml), respectively. Results are from a representative experiment and are expressed as the mean number of migrated cells in three random fields, scale bar=200 mu m. Cells that crossed the matrigel membrane were stained with crystal violet (magnification, x40). (B) Graphical presentation of the quantified data, presented as the number of migrated cells and expressed as the mean +- standard error of the mean. HUVECs, human umbilical vein endothelial cells; UC-MSCs, umbilical cord mesenchymal stem cells; UC-CM, UC-MSCs conditioned medium; DMEM, Dulbecco's modified Eagle's medium; SDF-1, stromal cell-derived factor 1; MCP-1, monocyte chemotactic protein 1; HGF, hepatocyte growth factor.
- Conjugate
- Green dye