Explore
 Validate
 Learn
Learn Western blot
 Immunocytochemistry
Antibody data
- Antibody Data
- Antigen structure
- References [3]
- Comments [0]
- Validations
- Immunocytochemistry [1]
- Immunohistochemistry [5]
- Other assay [5]
Submit
Validation data
Reference
Comment
Report error
- Product number
- PA5-79713 - Provider product page

- Provider
- Invitrogen Antibodies
- Product name
- B-Myb Polyclonal Antibody
- Antibody type
- Polyclonal
- Antigen
- Synthetic peptide
- Description
- Reconstitute with 0.2 mL of distilled water to yield a concentration of 500 µg/mL. Positive Control - WB: human Raji whole cell. IHC: human tonsil tissue, mouse liver tissue, rat liver tissue.
- Reactivity
- Human, Mouse, Rat
- Host
- Rabbit
- Isotype
- IgG
- Vial size
- 100 μg
- Concentration
- 500 μg/mL
- Storage
- -20°C
Submitted references Downstream Regulatory Network of MYBL2 Mediating Its Oncogenic Role in Melanoma.
MYBL2 disrupts the Hippo-YAP pathway and confers castration resistance and metastatic potential in prostate cancer.
MYBL2 in synergy with CDC20 promotes the proliferation and inhibits apoptosis of gastric cancer cells.
Zhong F, Liu J, Gao C, Chen T, Li B
Frontiers in oncology 2022;12:816070
Frontiers in oncology 2022;12:816070
MYBL2 disrupts the Hippo-YAP pathway and confers castration resistance and metastatic potential in prostate cancer.
Li Q, Wang M, Hu Y, Zhao E, Li J, Ren L, Wang M, Xu Y, Liang Q, Zhang D, Lai Y, Liu S, Peng X, Zhu C, Ye L
Theranostics 2021;11(12):5794-5812
Theranostics 2021;11(12):5794-5812
MYBL2 in synergy with CDC20 promotes the proliferation and inhibits apoptosis of gastric cancer cells.
Deng Q, Wu L, Li Y, Zou L
Advances in clinical and experimental medicine : official organ Wroclaw Medical University 2021 Sep;30(9):957-966
Advances in clinical and experimental medicine : official organ Wroclaw Medical University 2021 Sep;30(9):957-966
No comments: Submit comment
Supportive validation
- Submitted by
- Invitrogen Antibodies (provider)
- Main image
- Experimental details
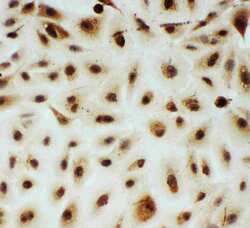
- Immunocytochemistry analysis of B-Myb in A549 cells. Sample was incubated with B-Myb polyclonal antibody (Product # PA5-79713).
Supportive validation
- Submitted by
- Invitrogen Antibodies (provider)
- Main image
- Experimental details
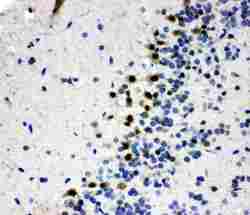
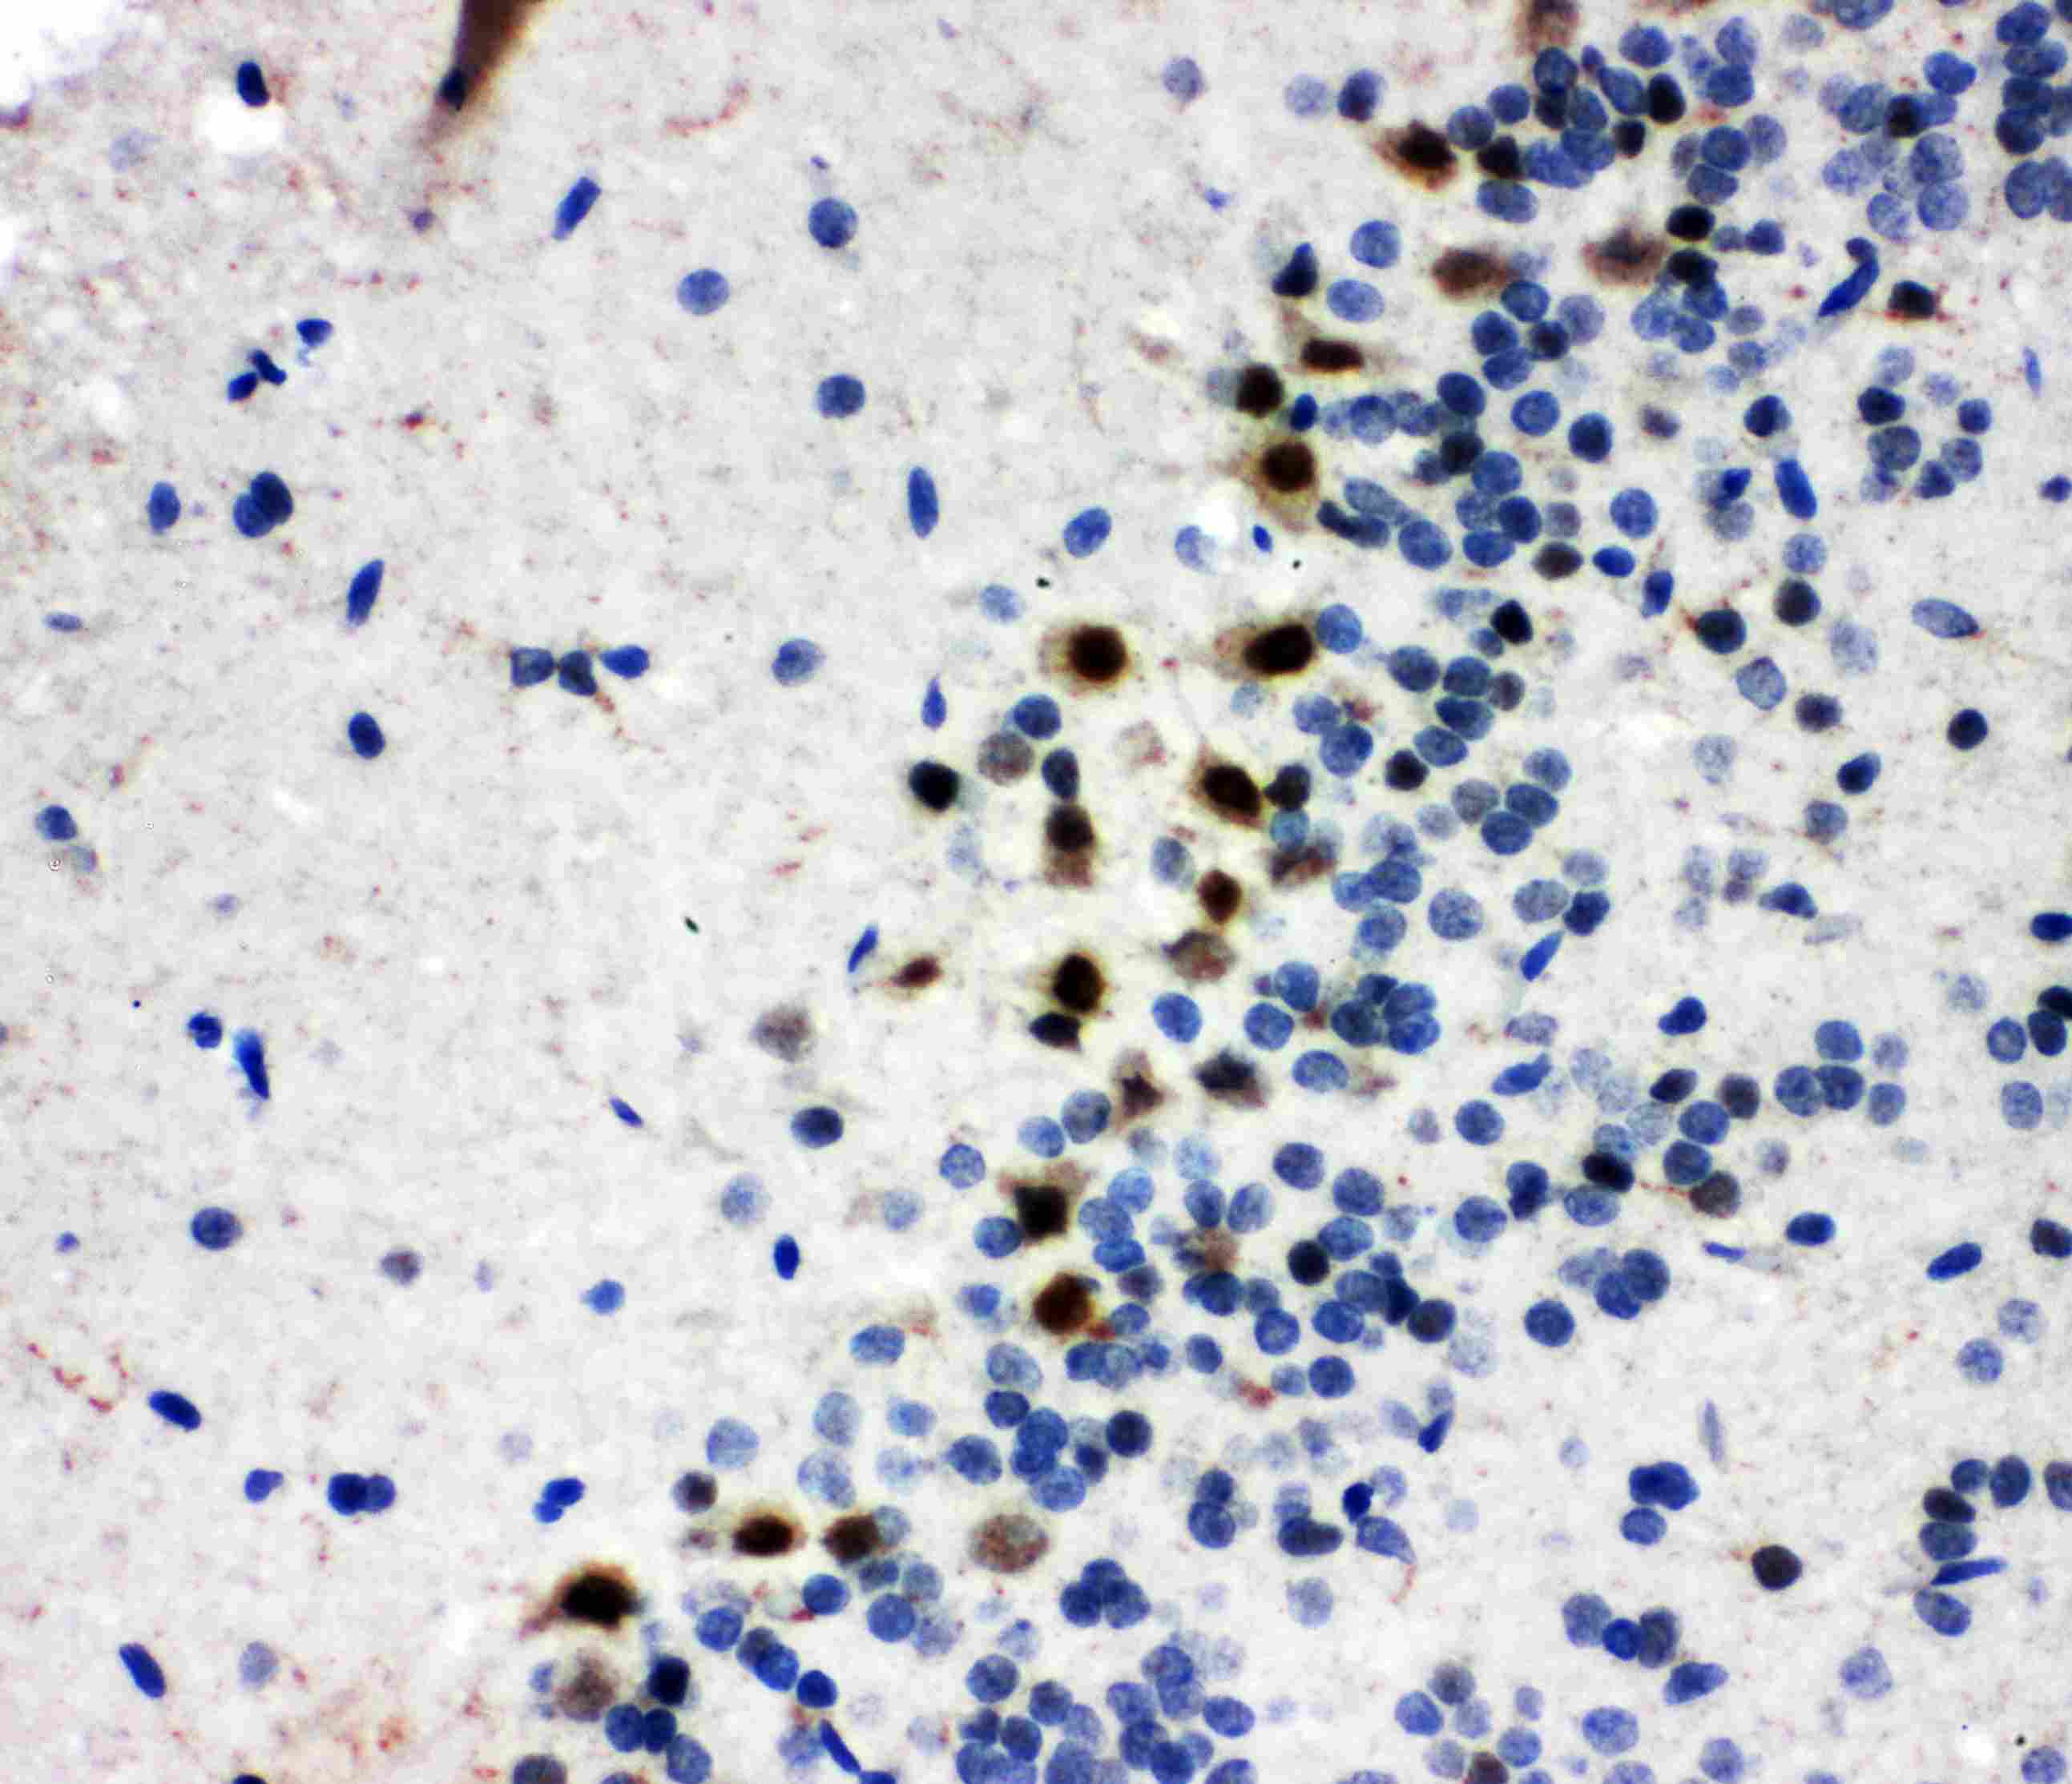
- Immunohistochemistry analysis of B-Myb on paraffin-embedded rat brain tissue. Sample was incubated with B-Myb polyclonal antibody (Product# PA5-79713).
- Submitted by
- Invitrogen Antibodies (provider)
- Main image

- Experimental details
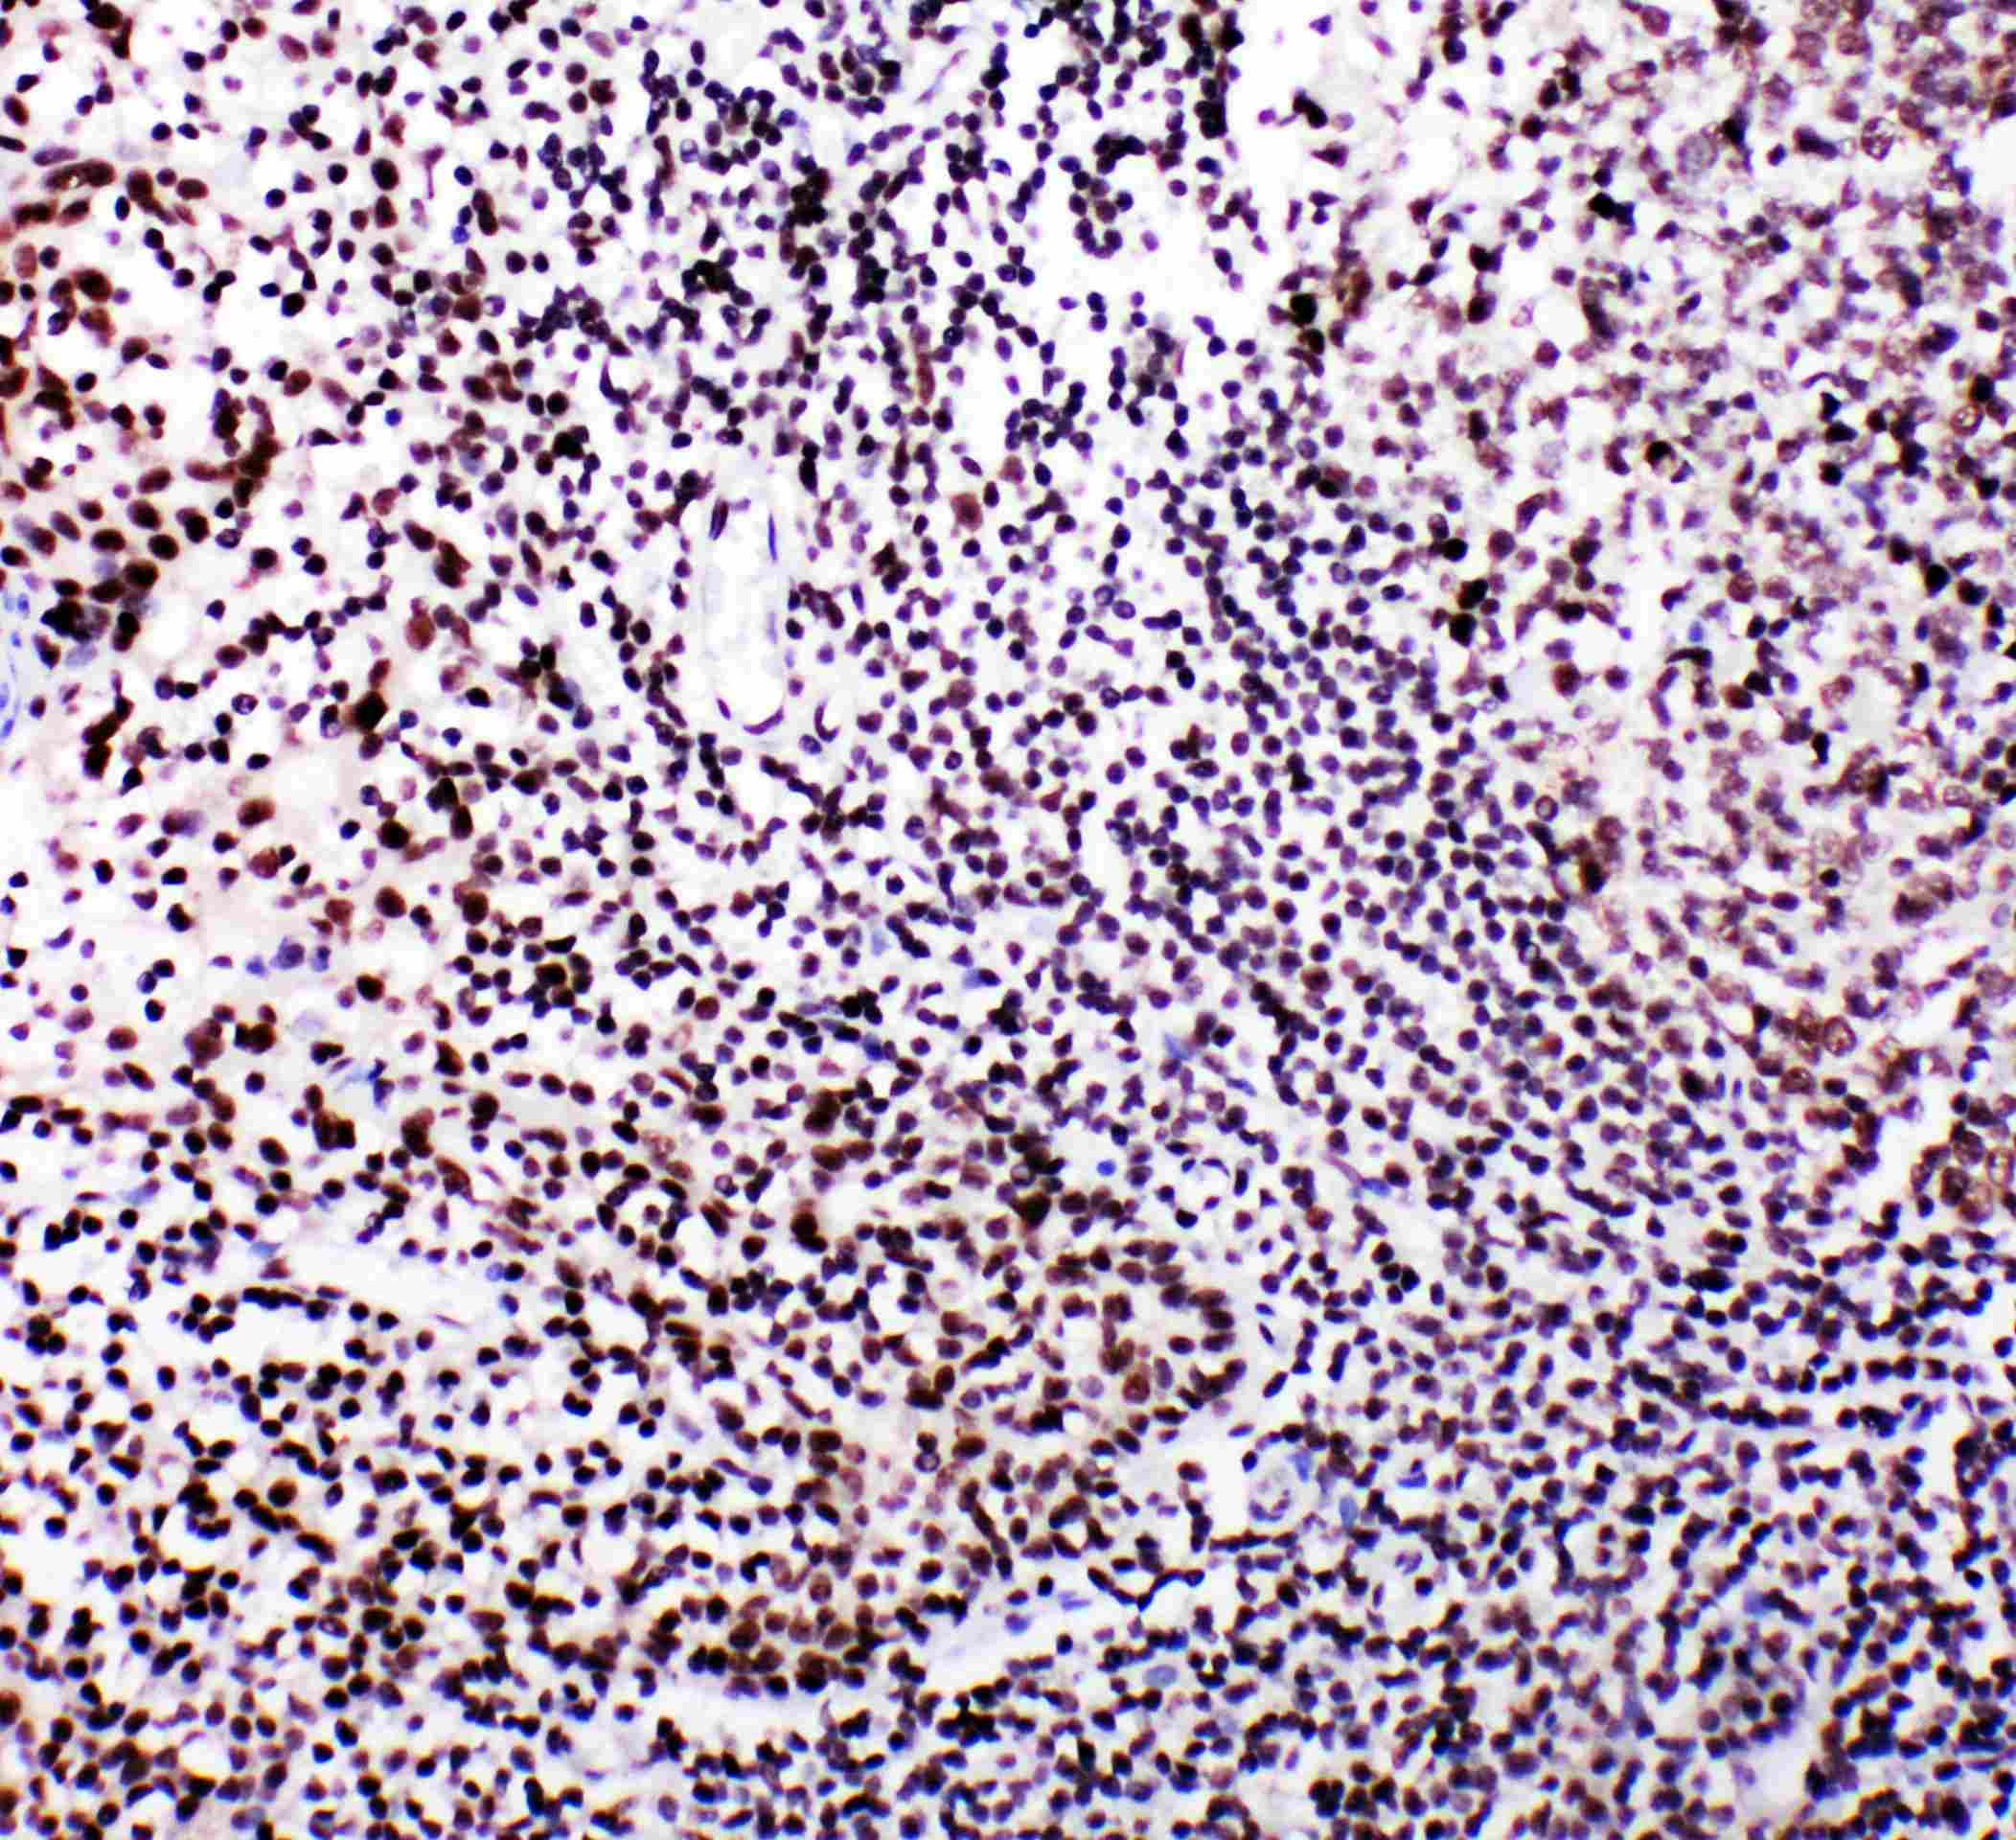
- Immunohistochemistry analysis of B-Myb on paraffin-embedded human tonsil tissue. Sample was incubated with B-Myb polyclonal antibody (Product# PA5-79713).
- Submitted by
- Invitrogen Antibodies (provider)
- Main image
- Experimental details
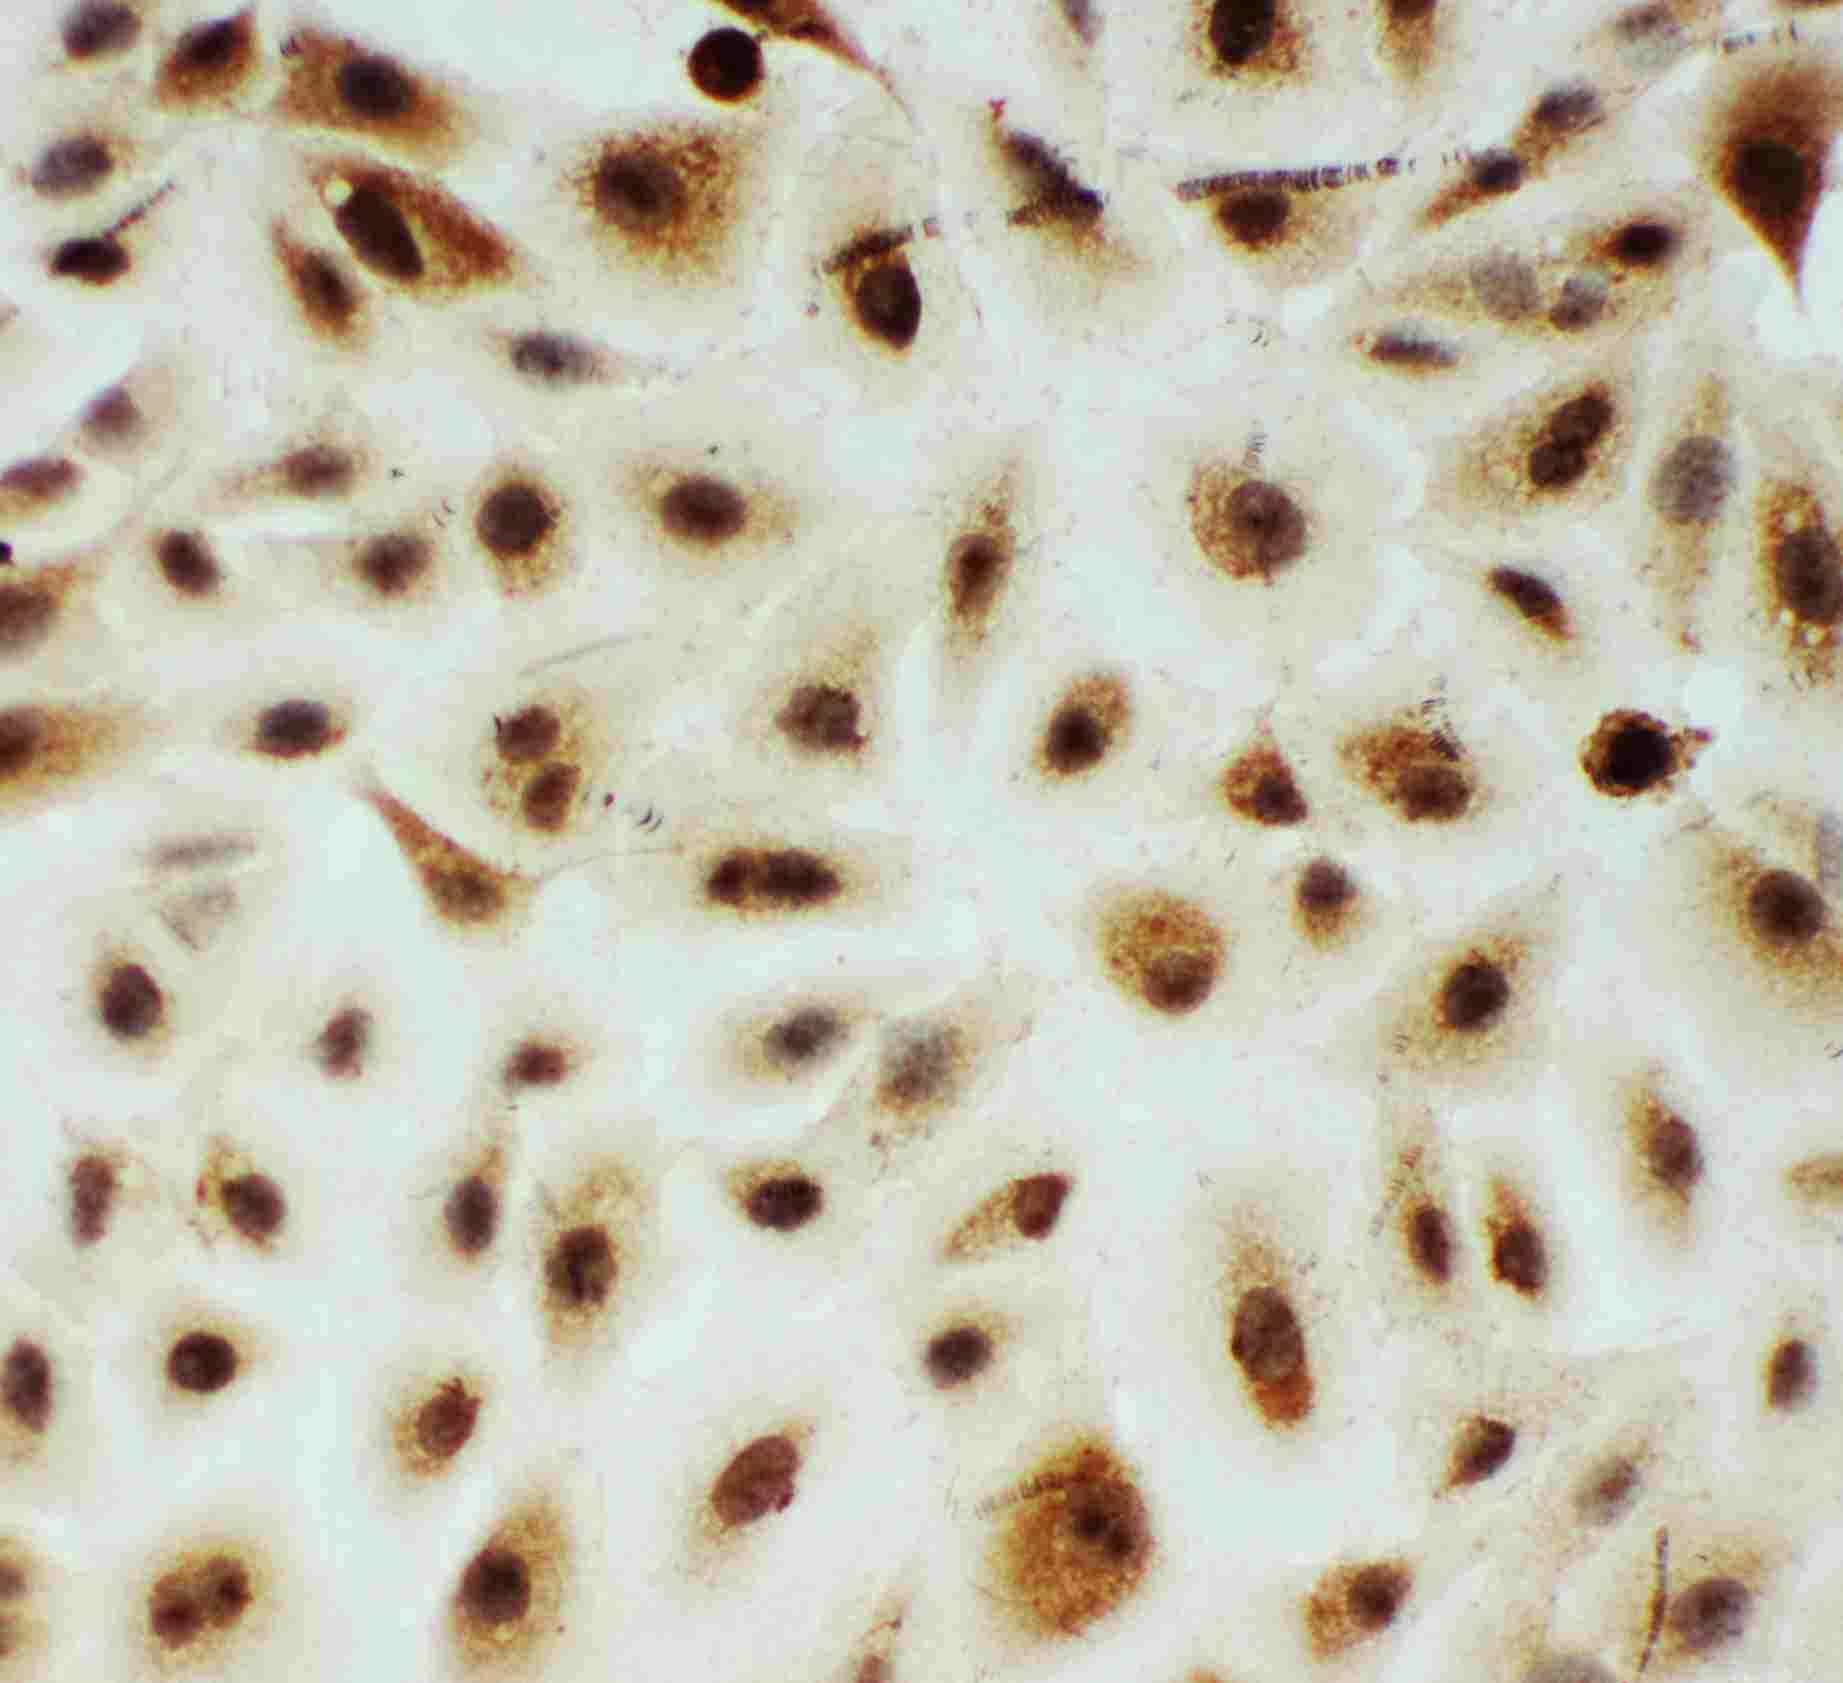
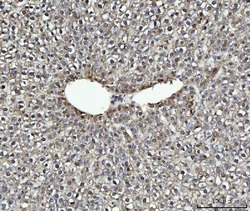
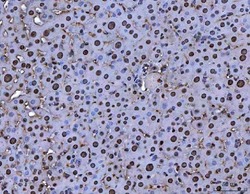
- Immunohistochemistry (Paraffin) analysis of B-Myb in paraffin-embedded section of rat liver tissue using B-Myb Polyclonal Antibody (Product # PA5-79713). Heat mediated antigen retrieval was performed in EDTA buffer (pH 8.0, epitope retrieval solution). The tissue section was blocked with 10% goat serum. The tissue section was then incubated with the primary antibody at a 2 µg/mL dilution overnight at 4°C. Peroxidase conjugated goat anti-rabbit IgG was used as secondary antibody and incubated for 30 minutes at 37°C. The tissue section was developed using HRP Conjugated Rabbit IgG Super Vision Assay Kit with DAB as the chromogen.
- Submitted by
- Invitrogen Antibodies (provider)
- Main image
- Experimental details
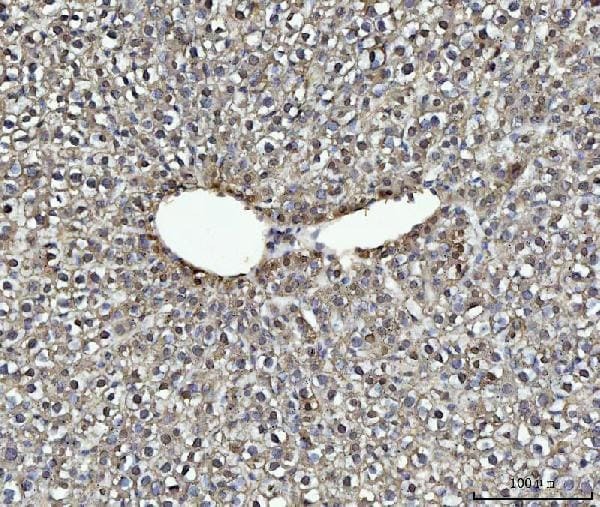
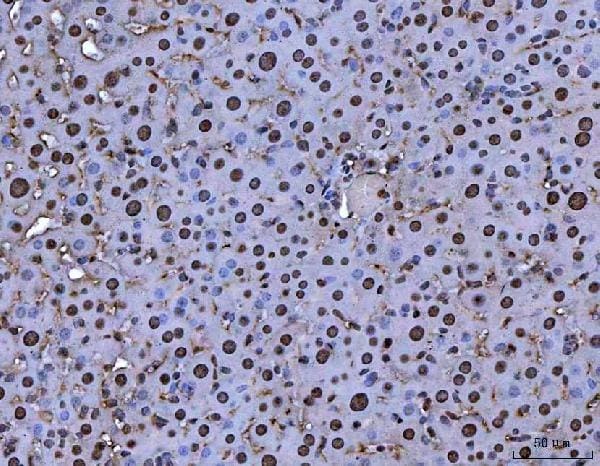
- Immunohistochemistry (Paraffin) analysis of B-Myb in paraffin-embedded section of mouse liver tissue using B-Myb Polyclonal Antibody (Product # PA5-79713). Heat mediated antigen retrieval was performed in EDTA buffer (pH 8.0, epitope retrieval solution). The tissue section was blocked with 10% goat serum. The tissue section was then incubated with the primary antibody at a 2 µg/mL dilution overnight at 4°C. Peroxidase conjugated goat anti-rabbit IgG was used as secondary antibody and incubated for 30 minutes at 37°C. The tissue section was developed using HRP Conjugated Rabbit IgG Super Vision Assay Kit with DAB as the chromogen.
- Submitted by
- Invitrogen Antibodies (provider)
- Main image
- Experimental details
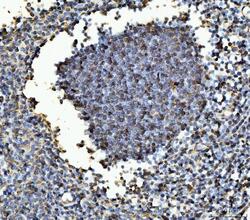
- Immunohistochemistry (Paraffin) analysis of B-Myb in paraffin-embedded section of human tonsil tissue using B-Myb Polyclonal Antibody (Product # PA5-79713). Heat mediated antigen retrieval was performed in EDTA buffer (pH 8.0, epitope retrieval solution). The tissue section was blocked with 10% goat serum. The tissue section was then incubated with the primary antibody at a 2 µg/mL dilution overnight at 4°C. Peroxidase conjugated goat anti-rabbit IgG was used as secondary antibody and incubated for 30 minutes at 37°C. The tissue section was developed using HRP Conjugated Rabbit IgG Super Vision Assay Kit with DAB as the chromogen.

Supportive validation
- Submitted by
- Invitrogen Antibodies (provider)
- Main image
- Experimental details
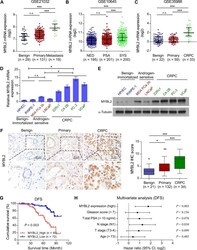
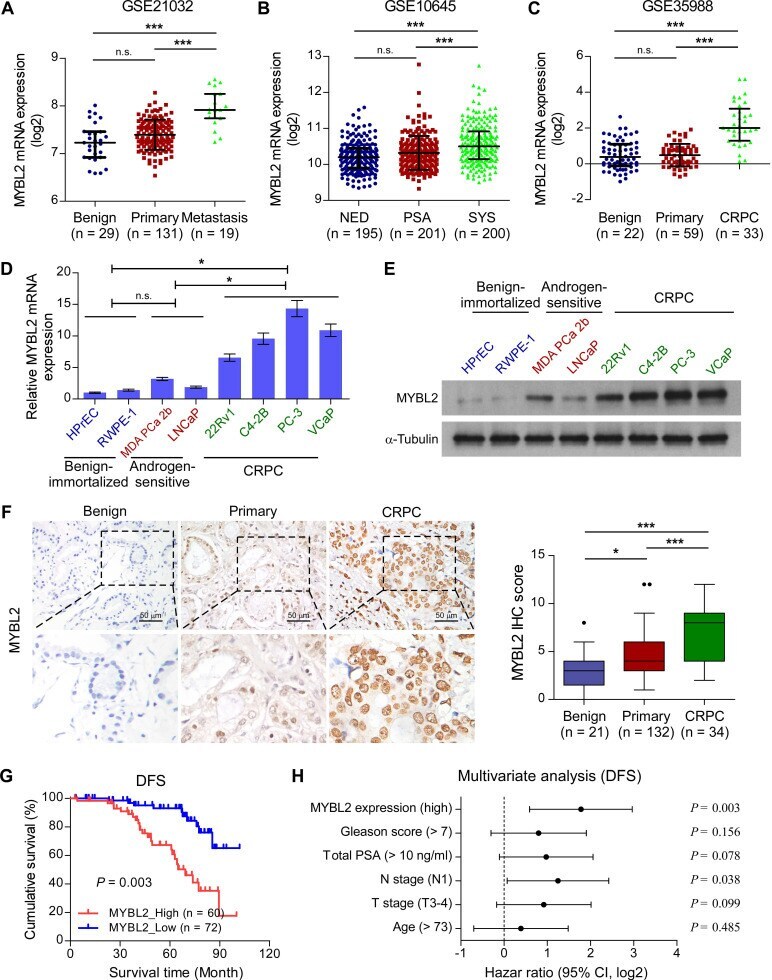
- Figure 1 Upregulation of MYBL2 contributes to the development of CRPC. (A-C) MYBL2 mRNA levels in PCa tissues were assessed by analyzing the GSE21032 (A), GSE10645 (B), and GSE35988 (C) PCa mRNA datasets (NED control: No evidence of disease, PSA control: PSA recurrence but no evidence of clinical progression within 5 years, SYS: Systemic progression within 5 years after PSA recurrence, CRPC: Castration-resistant prostate cancer). (D) QRT-PCR analysis of MYBL2 expression in the indicated cell lines. GAPDH was used an internal control. In (A-D), P -values were determined by one-way ANOVA test. (E) Western blotting analysis of MYBL2 expression in the indicated cell lines. alpha-Tubulin was used as a loading control. (F) Left panel: Representative IHC images of MYBL2 in benign prostate tissues (n = 21), primary tissues (n = 132), and CRPC tissues (n = 34). Scale bars: 50 mum. Right panel: Statistical quantification of the MYBL2 IHC score (one-way ANOVA test). (G) Kaplan-Meier analysis of disease-free survival (DFS) curves for patients with PCa with low MYBL2 expression versus high MYBL2 expression (log-rank test, n = 132). (H) Multivariate analysis of DFS by Cox-regression analysis in patients with PCa (n = 132 cases). Data were presented as mean +- SD. * P < 0.05, *** P < 0.001, n.s, no significance.
- Submitted by
- Invitrogen Antibodies (provider)
- Main image

- Experimental details
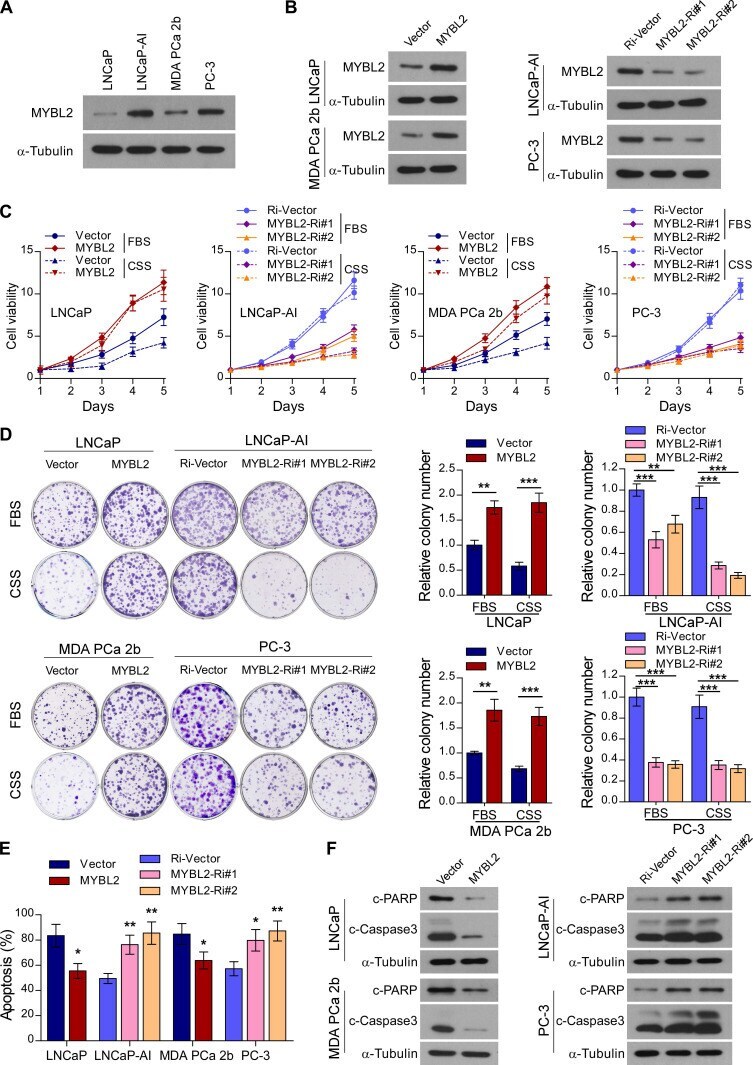
- Figure 2 MYBL2 confers resistance to androgen-deprivation treatment in PCa cells in vitro . (A and B) Western blotting analysis of MYBL2 expression in the indicated cell lines. alpha-Tubulin was used as a loading control. (C) Cell viability was assessed in the indicated cells, cultured either in medium with fetal bovine serum (FBS) or with charcoal-stripped serum (CSS), every day for 5 days after seeding (two-way ANOVA test). (D) Representative images (left panel) and quantification (right panel) of colonies formed by the indicated cell lines cultured either in medium with FBS or CSS. (E) Apoptosis assessed by flow cytometry using Annexin V-FITC/PI staining in the indicated cells treated in medium supplemented with 0.5% CSS for 4 days. In (D-E), P -values were determined by two-tailed student''s t test when comparing two groups and one-way ANOVA test when comparing three groups. (F) Western blotting analysis of the indicated protein expression in the indicated cells cultured in medium with CSS. alpha-tubulin was used as a loading control. Data were presented as mean +- SD, ** P < 0.01, *** P < 0.001.
- Submitted by
- Invitrogen Antibodies (provider)
- Main image

- Experimental details
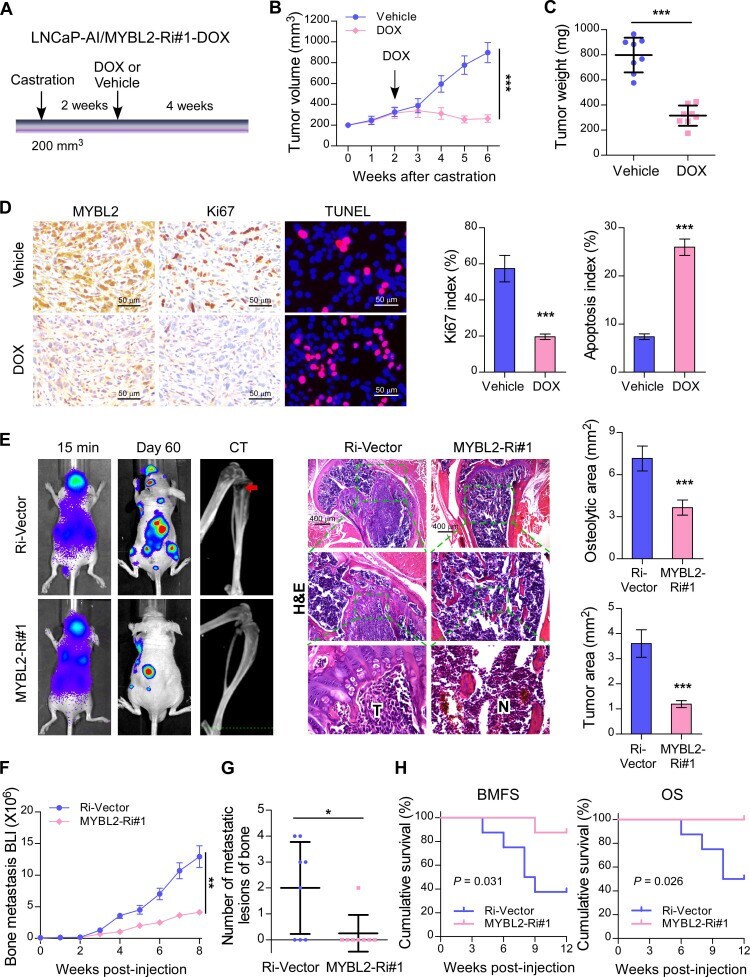
- Figure 3 Silencing of MYBL2 suppresses castration-resistant growth and bone metastatic capacity of CRPC cells. (A) Schematic illustration of in vivo models of castration therapy performed in the mice bearing tumor xenografts formed by LNCaP-AI/MYBL2-Ri#1-DOX cells, followed by treatment with vehicle or doxycycline (DOX). (B) Tumor growth curves of the indicated xenograft tumors (n = 8/group) during the experiments shown in (A) (two-way ANOVA test). (C) Quantification of the xenograft tumor weight at the end of the experiments shown in (A). (D) Representative images (left panel) and quantification (right panel) of IHC staining of MYBL2 and Ki67, and TUNEL analysis of apoptotic cells in the xenografts tissues. Scale bars: 50 mum. (E) Representative BLI, Micro-CT, and histological images (H&E) of bone lesions from mice inoculated intracardially with PC-3/Ri-vector or PC-3/MYBL2-Ri#1 cells in each experimental group (n = 8/group). T, tumor tissues; N, normal tissues. Scale bars: 400 mum. Quantification of hind-limb osteolysis in each experimental group using Micro-CT analysis (right upper panel). Histomorphometric quantification of the tumor area in hind limbs from each experimental group (right lower panel). In (C-E), P -values were determined by two-tailed student''s t test. (F) The growth curve for bone metastasis burden as quantified by BLI in each group (two-way ANOVA test). (G) Numbers of metastatic lesions in bones from each mouse in two groups (Student''s t test). (H) Kap
- Submitted by
- Invitrogen Antibodies (provider)
- Main image

- Experimental details
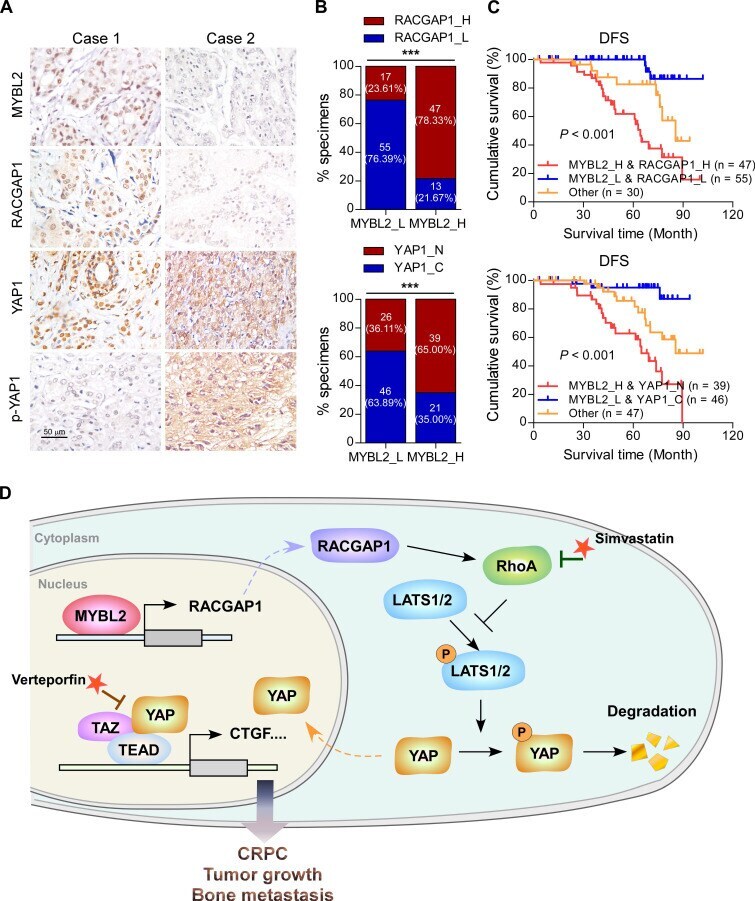
- Figure 7 Clinical relevance of the MYBL2/RACGAP1/YAP axis in human PCa. (A) Representative images of MYBL2, RACGAP1, YAP1, and p-YAP1 IHC staining in 132 breast cancer patient specimens. Scale bars: 50 mum. (B) Percentage of PCa specimens showing MYBL2 expression relative to the level of RACGAP1 and nuclear YAP1 (chi 2 test). *** P < 0.001. (C) Kaplan-Meier survival analysis of patients with PCa (n = 132). The log-rank test P-values are shown. (D) Model: overexpression of MYBL2 stimulates the YAP signaling through inducing RACGAP1-mediated RhoA activation, ultimately leading to castration-resistant growth and bone metastasis in PCa.
- Submitted by
- Invitrogen Antibodies (provider)
- Main image
- Experimental details
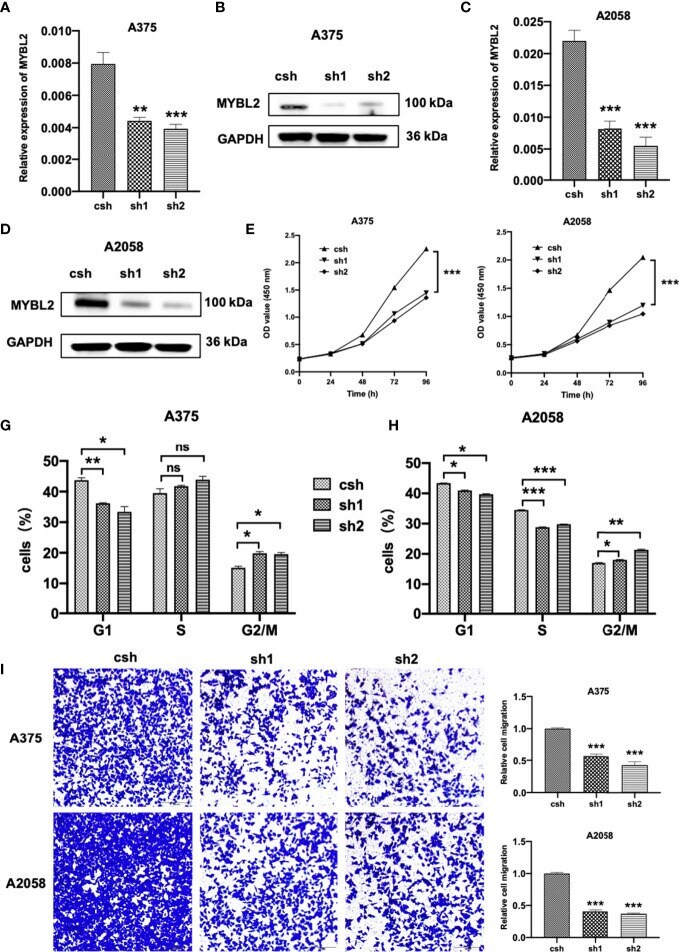
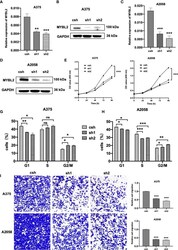
- Figure 2 MYBL2 is essential to cell survival in melanoma cells. (A-D) qPCR and Western blot analyses of MYBL2 in melanoma cell lines A375 and A2058 using pLL3.7 lentivirus-expressing control shRNA (csh) and 2 different MYBL2 shRNAs (sh1 and sh2). (E, F) Proliferation of cells with csh, sh1, and sh2 targeting MYBL2 at 0, 24, 48, and 96 h was detected. (G, H) Flow cytometric analysis was performed to assess cell cycle phase status after staining with propidium iodide (PI). (I) Images and quantitative cell migration of melanoma cells after transfection with MYBL2 -shRNAs lentiviruses. These experiments were repeated at least 3 times. * p < 0.05, ** p < 0.01, *** p < 0.001. ns P > 0.05, no significant difference.