Explore
 Validate
 Learn
Learn Western blot
 Immunohistochemistry
Antibody data
- Antibody Data
- Antigen structure
- References [1]
- Comments [0]
- Validations
- Immunohistochemistry [1]
- Other assay [1]
Submit
Validation data
Reference
Comment
Report error
- Product number
- PA5-72974 - Provider product page

- Provider
- Invitrogen Antibodies
- Product name
- PIEZO1 Polyclonal Antibody
- Antibody type
- Polyclonal
- Antigen
- Synthetic peptide
- Reactivity
- Human, Mouse, Rat, Porcine
- Host
- Rabbit
- Isotype
- IgG
- Vial size
- 100 μL
- Concentration
- 1 mg/mL
- Storage
- Store at 4°C short term. For long term storage, store at -20°C, avoiding freeze/thaw cycles.
Submitted references Compression enhances invasive phenotype and matrix degradation of breast Cancer cells via Piezo1 activation.
Luo M, Cai G, Ho KKY, Wen K, Tong Z, Deng L, Liu AP
BMC molecular and cell biology 2022 Jan 3;23(1):1
BMC molecular and cell biology 2022 Jan 3;23(1):1
No comments: Submit comment
Supportive validation
- Submitted by
- Invitrogen Antibodies (provider)
- Main image
- Experimental details
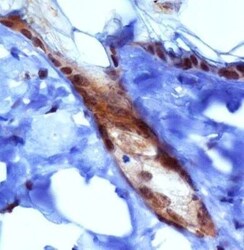
- Immunohistochemical analysis of PIEZO1 in mouse epidermis. Samples were incubated with PIEZO1 polyclonal antibody (Product # PA5-72974) followed by using DAB with hematoxylin counterstain.

Supportive validation
- Submitted by
- Invitrogen Antibodies (provider)
- Main image
- Experimental details
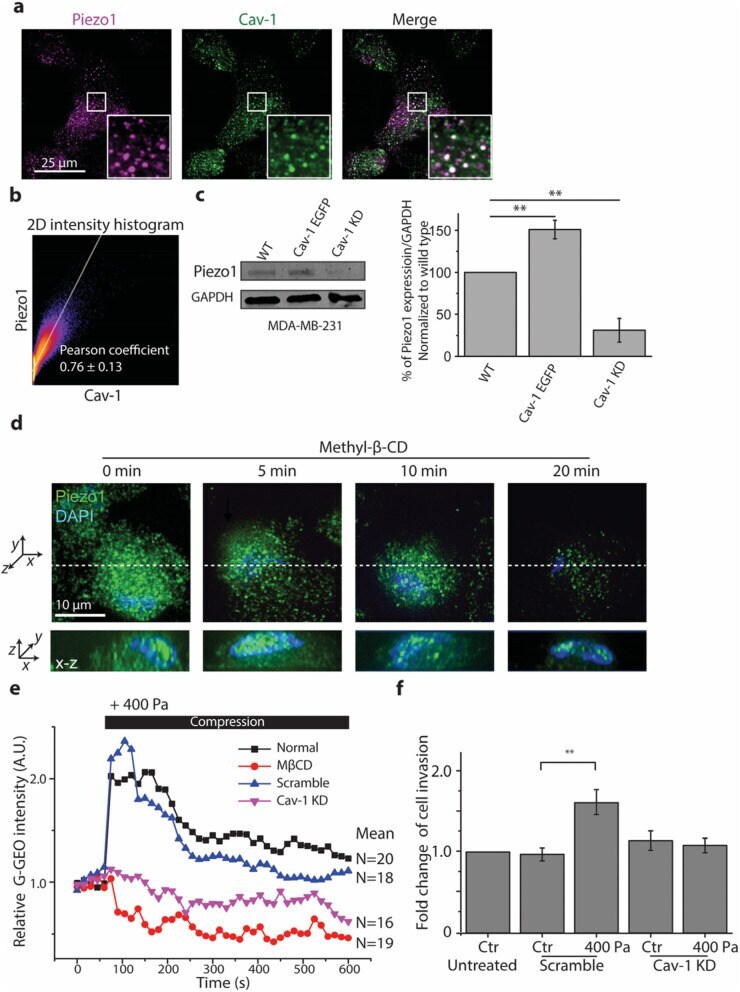
- Fig. 4 The expression and distribution of Piezo1 in MDA-MB-231 cells were regulated by caveolae. a Representative fluorescence images of Piezo1 (magenta) and caveolae (green) colocalization visualized by confocal microscopy (100X) and 2D intensity histogram output in MDA-MB-231 cells. Insets in both conditions show a magnified view of the boxed regions. b Representative image of 2D intensity histogram output of Coloc2 analysis performed using Fiji software. The text indicates the Pearson coefficient of the pixel-intensity correlation ( n = 8). c Western blot images and quantification of Piezo1 expression in wild type (WT), Cav-1 EGFP expressing, and Cav-1 KD MDA-MB-231 cells (means +- s.e.m., n = 3). Cropped images of Western blots are shown and uncropped images are shown in Fig. S8b . ** p < 0.01 versus WT groups. d , Representative fluorescence images of Piezo1 (green) and nucleus (blue) visualized by confocal microscopy (100X) after cells were treated with MbetaCD for 5 min, 10 min, and 20 min (upper panel: x - y view, lower panel: x - z view, white dashed line shows the position of a section of x-z view). e Time-courses of relative mean fluorescence intensity of G-GECO in MDA-MB-231 cells pretreated with or without MbetaCD, and Cav-1 KD in response to 400 Pa compression. Each experiment assayed 10-20 cells and repeated three times. The black bar indicates the period of compression. f Quantification of the fold change of invaded cells treated with siRNA for Cav-1 under 400