 Explore
 Validate
 Learn
LearnPA5-21320
antibody from Invitrogen Antibodies
Targeting: HMGA2
BABL, HMGIC, LIPO
 Western blot
 Immunocytochemistry Immunoprecipitation Immunohistochemistry
 Chromatin Immunoprecipitation Other assay
Antibody data
- Antibody Data
- Antigen structure
- References [1]
- Comments [0]
- Validations
- Immunocytochemistry [2]
- Immunohistochemistry [5]
- Other assay [1]
Submit
Validation data
Reference
Comment
Report error
- Product number
- PA5-21320 - Provider product page

- Provider
- Invitrogen Antibodies
- Product name
- HMGA2 Polyclonal Antibody
- Antibody type
- Polyclonal
- Antigen
- Recombinant full-length protein
- Description
- Recommended positive controls: A431, HeLa, HepG2, HCT116. Predicted reactivity: Mouse (95%), Rat (92%), Zebrafish (85%), Xenopus laevis (80%), Chicken (98%). Store product as a concentrated solution. Centrifuge briefly prior to opening the vial.
- Reactivity
- Human, Mouse, Rat
- Host
- Rabbit
- Isotype
- IgG
- Vial size
- 100 μL
- Concentration
- 0.13 mg/mL
- Storage
- Store at 4°C short term. For long term storage, store at -20°C, avoiding freeze/thaw cycles.
Submitted references HMGA2 regulates circular RNA ASPH to promote tumor growth in lung adenocarcinoma.
Xu L, Ma Y, Zhang H, Lu QJ, Yang L, Jiang GN, Liao WL
Cell death & disease 2020 Jul 27;11(7):593
Cell death & disease 2020 Jul 27;11(7):593
No comments: Submit comment
Supportive validation
- Submitted by
- Invitrogen Antibodies (provider)
- Main image

- Experimental details
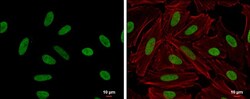
- HMGA2 antibody detects HMGA2 protein at nucleus by immunofluorescent analysis. Sample: HeLa cells were fixed in 4% paraformaldehyde at RT for 15 min. Green: HMGA2 protein stained by HMGA2 antibody (Product # PA5-21320) diluted at 1:500. Red: Phalloidin, a cytoskeleton marker, diluted at 1:200. Scale bar = 10 μm.

- Submitted by
- Invitrogen Antibodies (provider)
- Main image
- Experimental details
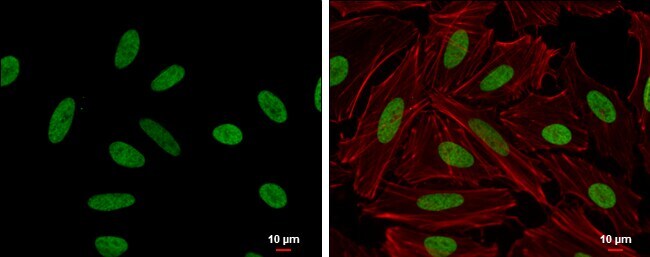
- HMGA2 antibody detects HMGA2 protein at nucleus by immunofluorescent analysis. Sample: HeLa cells were fixed in 4% paraformaldehyde at RT for 15 min. Green: HMGA2 protein stained by HMGA2 antibody (Product # PA5-21320) diluted at 1:500. Red: Phalloidin, a cytoskeleton marker, diluted at 1:200. Scale bar = 10 μm.
Supportive validation
- Submitted by
- Invitrogen Antibodies (provider)
- Main image
- Experimental details
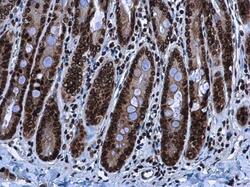
- HMGA2 antibody detects HMGA2 protein at nucleus in rat duodenum by immunohistochemical analysis. Sample: Paraffin-embedded rat duodenum. HMGA2 antibody (Product # PA5-21320) diluted at 1:500. Antigen Retrieval: Citrate buffer, pH 6.0, 15 min.

- Submitted by
- Invitrogen Antibodies (provider)
- Main image

- Experimental details
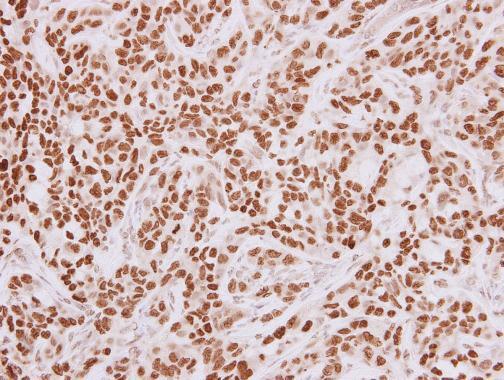
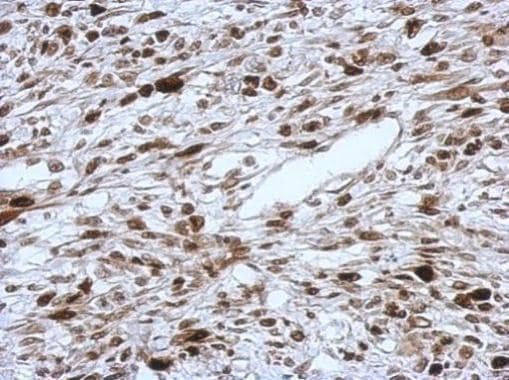
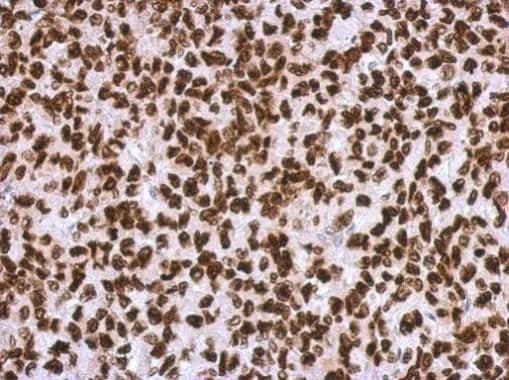
- Immunohistochemistry (Paraffin) analysis of HMGA2 was performed in paraffin-embedded human HuCCT1 xenograft tissue using HMGA2 Polyclonal Antibody (Product # PA5-21320) at a dilution of 1:250.
- Submitted by
- Invitrogen Antibodies (provider)
- Main image

- Experimental details
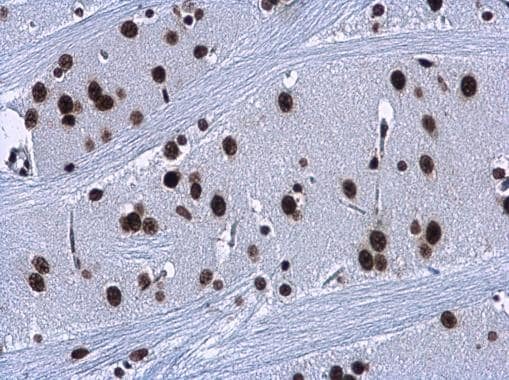
- HMGA2 antibody detects HMGA2 protein at nucleus in rat brain by immunohistochemical analysis. Sample: Paraffin-embedded rat brain. HMGA2 antibody (Product # PA5-21320) diluted at 1:500. Antigen Retrieval: Citrate buffer, pH 6.0, 15 min.
- Submitted by
- Invitrogen Antibodies (provider)
- Main image
- Experimental details
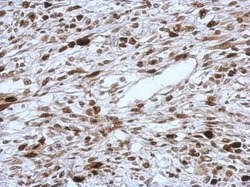
- Immunohistochemical analysis of paraffin-embedded C2C12 xenograft, using HMGA2 (Product # PA5-21320) antibody at 1:500 dilution. Antigen Retrieval: EDTA based buffer, pH 8.0, 15 min.
- Submitted by
- Invitrogen Antibodies (provider)
- Main image
- Experimental details
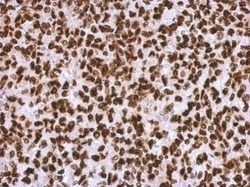
- Immunohistochemical analysis of paraffin-embedded H1299 xenograft, using HMGA2 (Product # PA5-21320) antibody at 1:500 dilution. Antigen Retrieval: EDTA based buffer, pH 8.0, 15 min.
Supportive validation
- Submitted by
- Invitrogen Antibodies (provider)
- Main image
- Experimental details
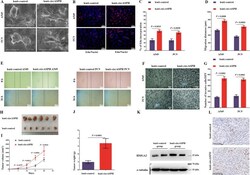
- Fig. 2 The oncogenic effects of circASPH in vitro and in vivo. a The morphologic changes in A549 and PC9 cells overexpressing circASPH were observed using a scanning electron microscopy assay. b , c DNA synthesis assessed using an EdU assay in the lenti-circASPH cells and control cells. Nuclei were stained with Hoechst 33342 (blue). The quantified data are presented as the percentage of EdU-incorporated cells. Log2 transformation was applied to deal with the ratio results and to obtain the normally distributed data. Then, T test was used to compare the difference between groups. d , e The migration of A549 and PC9 cells was significantly increased by circASPH overexpression. The migration distances (mum) of A549 and PC9 cells were quantified. f , g The invasion of A549 and PC9 cells was apparently increased by circASPH overexpression. The quantified data are presented as the number of invading cells per HPF. HPF high-power field. h - j Xenograft tumor models show that tumors grown from the circASPH-overexpressing cells were bigger than those grown from the control cells. k Western blot analysis of the levels of HMGA2 protein in the xenograft tumors. l IHC staining of the HMGA2 protein in the xenograft tumors. Every cell test was carried out in triplicate, and n = 3 for each cell group.
