 Explore
 Validate
 Learn
Learn Western blot
Antibody data
- Antibody Data
- Antigen structure
- References [13]
- Comments [0]
- Validations
- Western blot [2]
- Immunocytochemistry [1]
- Immunohistochemistry [1]
- Other assay [20]
Submit
Validation data
Reference
Comment
Report error
- Product number
- 14-5768-82 - Provider product page

- Provider
- Invitrogen Antibodies
- Product name
- Nanog Monoclonal Antibody (hNanog.2), eBioscience™
- Antibody type
- Monoclonal
- Antigen
- Other
- Description
- Description: The hNanog.2 antibody recognizes human Nanog, a homeobox transcription factor expressed in embryonic stem cells (ESC). Nanog is essential for self-renewal of ESC and the inner cell mass and is throught to function in the same capacity as other factors such as Oct4 and Sox2. Nanog plays a crucial role in embryonic cell fate specification following formation of the blastocyst by regulating proliferation and preventing differentiation. Nanog functions by directly binding DNA consensus sequences to activate or repress transcription. In differentiating ESC, Nanog binds to its own promoter leading to repression of expression. Nanog has been reported to be overexpressed in germ cell tumors of the gonads and central nervous system as well as breast and colorectal cancer. Applications Reported: This hNanog.2 antibody has been reported for use in western blotting, immunohistochemical staining of formalin-fixed paraffin embedded tissue sections, and immunocytochemistry. Applications Tested: This hNanog.2 antibody has been tested by immunoblotting of NTERA cell lysates and can be used at less than or equal to 1 µg/mL. The hNanog.2 antibody has been tested by immunohistochemistry of formalin-fixed paraffin embedded tissue using high or low pH antigen retrieval and can be used at less than or equal to 20 µg/mL. The hNanog.2 antibody has been tested by immunocytochemistry on formaldehyde fixed and permeabilized cells and can be used at less than or equal to 5 µg/mL. It is recommended that the antibody be carefully titrated for optimal performance in the assay of interest. Purity: Greater than 90%, as determined by SDS-PAGE. Aggregation: Less than 10%, as determined by HPLC. Filtration: 0.2 µm post-manufacturing filtered.
- Reactivity
- Human
- Host
- Mouse
- Isotype
- IgG
- Antibody clone number
- hNanog.2
- Vial size
- 100 µg
- Concentration
- 0.5 mg/mL
- Storage
- 4° C
Submitted references Interleukin-6 promotes primitive endoderm development in bovine blastocysts.
Generation of an induced pluripotent stem cell line (DANi-011A) from a Parkinson's disease patient with a LRRK2 p.G2019S mutation.
Expression of receptor activator of NFkB (RANK) drives stemness and resistance to therapy in ER+HER2- breast cancer.
Initiation of X Chromosome Inactivation during Bovine Embryo Development.
Alpha-synuclein delays mitophagy and targeting Miro rescues neuron loss in Parkinson's models.
Characterization of bovine embryos cultured under conditions appropriate for sustaining human naïve pluripotency.
NANOG reprograms prostate cancer cells to castration resistance via dynamically repressing and engaging the AR/FOXA1 signaling axis.
Derivation, Characterization, and Neural Differentiation of Integration-Free Induced Pluripotent Stem Cell Lines from Parkinson's Disease Patients Carrying SNCA, LRRK2, PARK2, and GBA Mutations.
A mRNA landscape of bovine embryos after standard and MAPK-inhibited culture conditions: a comparative analysis.
Nanog1 in NTERA-2 and recombinant NanogP8 from somatic cancer cells adopt multiple protein conformations and migrate at multiple M.W species.
A distinct expression pattern in mammalian testes indicates a conserved role for NANOG in spermatogenesis.
The homeoprotein Nanog is required for maintenance of pluripotency in mouse epiblast and ES cells.
Nanog: a new recruit to the embryonic stem cell orchestra.
Wooldridge LK, Ealy AD
BMC developmental biology 2021 Jan 12;21(1):3
BMC developmental biology 2021 Jan 12;21(1):3
Generation of an induced pluripotent stem cell line (DANi-011A) from a Parkinson's disease patient with a LRRK2 p.G2019S mutation.
Chen M, Maimaitili M, Buchholdt SH, Jensen UB, Febbraro F, Denham M
Stem cell research 2020 May;45:101781
Stem cell research 2020 May;45:101781
Expression of receptor activator of NFkB (RANK) drives stemness and resistance to therapy in ER+HER2- breast cancer.
Gomes I, de Almeida BP, Dâmaso S, Mansinho A, Correia I, Henriques S, Cruz-Duarte R, Vilhais G, Félix P, Alves P, Corredeira P, Barbosa-Morais NL, Costa L, Casimiro S
Oncotarget 2020 May 12;11(19):1714-1728
Oncotarget 2020 May 12;11(19):1714-1728
Initiation of X Chromosome Inactivation during Bovine Embryo Development.
Yu B, van Tol HTA, Stout TAE, Roelen BAJ
Cells 2020 Apr 19;9(4)
Cells 2020 Apr 19;9(4)
Alpha-synuclein delays mitophagy and targeting Miro rescues neuron loss in Parkinson's models.
Shaltouki A, Hsieh CH, Kim MJ, Wang X
Acta neuropathologica 2018 Oct;136(4):607-620
Acta neuropathologica 2018 Oct;136(4):607-620
Characterization of bovine embryos cultured under conditions appropriate for sustaining human naïve pluripotency.
Brinkhof B, van Tol HT, Groot Koerkamp MJ, Wubbolts RW, Haagsman HP, Roelen BA
PloS one 2017;12(2):e0172920
PloS one 2017;12(2):e0172920
NANOG reprograms prostate cancer cells to castration resistance via dynamically repressing and engaging the AR/FOXA1 signaling axis.
Jeter CR, Liu B, Lu Y, Chao HP, Zhang D, Liu X, Chen X, Li Q, Rycaj K, Calhoun-Davis T, Yan L, Hu Q, Wang J, Shen J, Liu S, Tang DG
Cell discovery 2016;2:16041
Cell discovery 2016;2:16041
Derivation, Characterization, and Neural Differentiation of Integration-Free Induced Pluripotent Stem Cell Lines from Parkinson's Disease Patients Carrying SNCA, LRRK2, PARK2, and GBA Mutations.
Momcilovic O, Sivapatham R, Oron TR, Meyer M, Mooney S, Rao MS, Zeng X
PloS one 2016;11(5):e0154890
PloS one 2016;11(5):e0154890
A mRNA landscape of bovine embryos after standard and MAPK-inhibited culture conditions: a comparative analysis.
Brinkhof B, van Tol HT, Groot Koerkamp MJ, Riemers FM, IJzer SG, Mashayekhi K, Haagsman HP, Roelen BA
BMC genomics 2015 Apr 10;16(1):277
BMC genomics 2015 Apr 10;16(1):277
Nanog1 in NTERA-2 and recombinant NanogP8 from somatic cancer cells adopt multiple protein conformations and migrate at multiple M.W species.
Liu B, Badeaux MD, Choy G, Chandra D, Shen I, Jeter CR, Rycaj K, Lee CF, Person MD, Liu C, Chen Y, Shen J, Jung SY, Qin J, Tang DG
PloS one 2014;9(3):e90615
PloS one 2014;9(3):e90615
A distinct expression pattern in mammalian testes indicates a conserved role for NANOG in spermatogenesis.
Kuijk EW, de Gier J, Lopes SM, Chambers I, van Pelt AM, Colenbrander B, Roelen BA
PloS one 2010 Jun 7;5(6):e10987
PloS one 2010 Jun 7;5(6):e10987
The homeoprotein Nanog is required for maintenance of pluripotency in mouse epiblast and ES cells.
Mitsui K, Tokuzawa Y, Itoh H, Segawa K, Murakami M, Takahashi K, Maruyama M, Maeda M, Yamanaka S
Cell 2003 May 30;113(5):631-42
Cell 2003 May 30;113(5):631-42
Nanog: a new recruit to the embryonic stem cell orchestra.
Cavaleri F, Schöler HR
Cell 2003 May 30;113(5):551-2
Cell 2003 May 30;113(5):551-2
No comments: Submit comment
Supportive validation
- Submitted by
- Invitrogen Antibodies (provider)
- Main image
- Experimental details
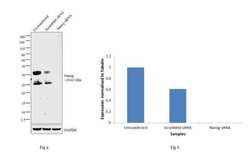
- Knockdown of Nanog was achieved by transfecting NTERA-2 cells with Nanog specific siRNAs (Silencer® select Product # s36650). Western blot analysis (Fig. a) was performed using whole cell extracts from the NTERA-2 knockdown cells (lane 3), non-specific scrambled siRNA transfected cells (lane 2) and un-transfected cells (lane 1). The blots were probed with Antibody (Product # 14-5768-82, 1µg/ml) and Goat anti-Mouse IgG (H+L) Superclonal™ Secondary Antibody, HRP conjugate (Product # A28177, 0.25µg/ml, 1:4000 dilution). Densitometry analysis of this western blot is shown in histogram (Fig b). Decrease in signal upon siRNA mediated knock down confirms that antibody is specific to Nanog.

- Submitted by
- Invitrogen Antibodies (provider)
- Main image

- Experimental details
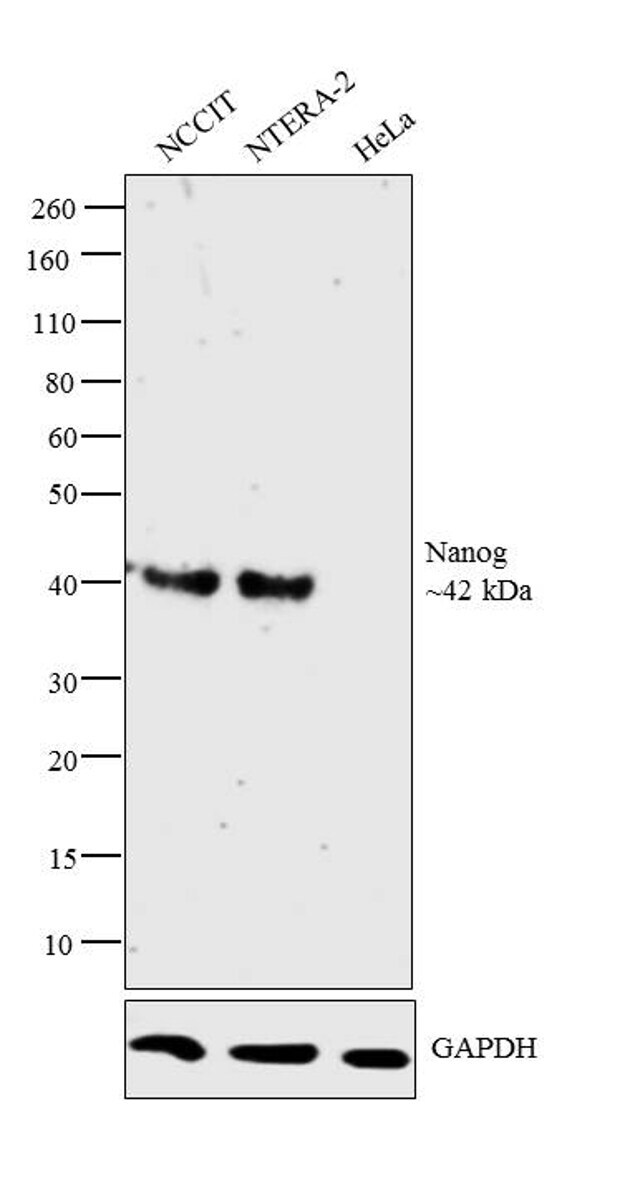
- Western blot analysis was performed on modified whole cell lysate (1% SDS) (30 µg lysate) of NCCIT (Lane 1), NTERA-2 (Lane 2) and HeLa (Lane 3). The blot was probed with anti-Nanog Monoclonal Antibody (Product # 14-5768-82, 1 µg/mL) and detected by chemiluminescence using Goat anti-Mouse IgG (H+L) Superclonal™ Secondary Antibody, HRP conjugate (Product # A28177, 0.25 µg/mL, 1:4000 dilution). A 42 kDa band corresponding to Nanog was observed across the cell lines tested but not in HeLa which is reported to be negative for Nanog expression.
Supportive validation
- Submitted by
- Invitrogen Antibodies (provider)
- Main image

- Experimental details
- Immunocytochemistry of formaldehyde-fixed and permeabilized N-Tera cells using 5 µg/mL Anti-Human Nanog Purified, followed by 10 µg/mL F (ab')2 Anti-Mouse IgG eFluor® 570.Nuclei are stained with DAPI, colocalization appears pink.

Supportive validation
- Submitted by
- Invitrogen Antibodies (provider)
- Main image

- Experimental details
- Immunohistochemistry of formalin-fixed paraffin embedded human infiltrating ductal carcinoma using 20 µg/mL Anti-Human Nanog Purified, followed by Anti-Mouse IgG Biotin, Avidin HRP, and DAB visualization.Nuclei are counterstained with hematoxylin.

Supportive validation
- Submitted by
- Invitrogen Antibodies (provider)
- Main image
- Experimental details
- NULL

- Submitted by
- Invitrogen Antibodies (provider)
- Main image

- Experimental details
- NULL

- Submitted by
- Invitrogen Antibodies (provider)
- Main image

- Experimental details
- NULL

- Submitted by
- Invitrogen Antibodies (provider)
- Main image

- Experimental details
- Figure 4 Expression of NANOG in dog testis as determined by immunofluorescence. (A-F) NANOG expression in differentiating male germ cells. Roman figures in panels represent the stage of the canine epithelial cycle (G-I) high magnification image of section in which the primary antibody was replaced by blocking solution, to control for non-specific binding of the secondary antibody; (J-L) image of testis section that was incubated with a rabbit IgG isotype control, to control for non-specific binding of the primary antibody.

- Submitted by
- Invitrogen Antibodies (provider)
- Main image

- Experimental details
- Figure 6 Expression of NANOG in pig testis as determined by immunofluorescence. (A-C) NANOG expression in differentiating male germ cells; (D-F) high magnification image of NANOG expression in pachytene spermatocytes; (G-I) image of section in which the primary antibody was replaced by blocking solution, to control for non-specific binding of the secondary antibody; (J-K) representative high magnification image of testis section that was incubated with a rabbit IgG isotype control, to control for non-specific binding of the primary antibody. Dashed lines in panels A-C and G-I mark the boundaries of the tubules.

- Submitted by
- Invitrogen Antibodies (provider)
- Main image
- Experimental details
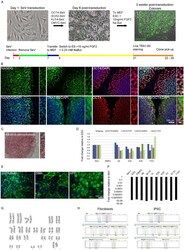
- Fig 1 Characterization of patient-specific induced pluripotent stem cell (iPSC) lines. A: Schematic representation of the reprogramming process. B: Immunocytochemistry for pluripotency factors OCT4, NANOG, SOX2, and TRA1-60. C: Alkaline phosphatase reactivity. Inserts: Images taken at higher magnification. D: qPCR analysis of total and endogenous expression of pluripotency genes OCT4, SOX2, and NANOG. ACTB served as an endogenous reference, and data were normalized against ESC sample. E: Immunocytochemistry for markers of the three germ layers in embryoid bodies. Scale bar as marked. F: qPCR analysis of the expression of SeV-specific transcripts. ACTB served as an endogenous reference, and data were normalized against SeV sample (cells collected a week after transduction with SeV). Fold change is shown on logarithmic scale G: Karyotype analysis in SNCA triplication line A6. H: STR profiles of parent fibroblast and iPSC A6 line..

- Submitted by
- Invitrogen Antibodies (provider)
- Main image

- Experimental details
- Figure 4 The relative expression of XCI related genes in inner cell mass (ICM) cells (black bars) and trophectoderm (TE) cells (white bars), and XIST RNA FISH combined with immunofluorescence in female embryos. The relative expression of XCI related genes ( A ). Relative expression in ICM set at 1; * ( p < 0.05) and ** ( p < 0.05) indicate significant differences. Error bars indicate standard deviations of three biological replicates. XIST RNA FISH combined with double staining of H3K27me3 and CDX2 ( B ) or NANOG ( C ) from day 7 (D7) to day 9 (D9) blastocysts, scale bar = 50 um. BL = blastocyst.

- Submitted by
- Invitrogen Antibodies (provider)
- Main image

- Experimental details
- Fig. 2 Changes in ICM cell populations over time in culture. Blastocysts were cultured in SOF-BE1 until day 8, 9 or 10 post-fertilization, then immunofluorescence staining for PE (GATA6 + ), EPI (NANOG + ) and TE (CDX2 + ) was completed. Panel a : Example of a day 8 blastocyst immunostained for GATA6 (red), NANOG (blue) and/or CDX2 (green). A higher magnification of the ICM is also shown for the triple-stained image. Cells positive for both GATA6 and NANOG were considered UN cells (purple). Panel b : Analysis of TE, ICM, PE, EPI and UN cell numbers over time ( n = 16, 51, and 40 total blastocysts from day 8, 9 and 10, respectively; 3 replicate studies). Different superscripts indicate differences for each cell type ( P < 0.05)

- Submitted by
- Invitrogen Antibodies (provider)
- Main image

- Experimental details
- Fig. 4 IL6 preferentially stimulates pSTAT3 Y705 nuclear localization in PE cells. Day 9 blastocysts were treated with 100 ng/ml IL6 for 30 min before fixation and fluorescent immunostaining. Panel a : Example of a blastocyst immunostained for pSTAT3 Y705 (red) and NANOG (blue). Dual-positive nuclei will be purple. Panel b : Number and percentage of blastocysts with either some or all ICM nuclei staining for both NANOG and pSTAT3 Y705 ( n = 24 pSTAT3 Y705 positive blastocysts over 4 replicate studies) Panel c : Example of a blastocyst immunostained for pSTAT3 Y705 (green) and GATA6 (red). Dual-positive nuclei will be yellow. Panel d : Number and percentage of blastocysts with either some or all ICM nuclei staining for both GATA6 and pSTAT3 Y705 ( n = 26 pSTAT3 Y705 positive blastocysts over 3 replicate studies)

- Submitted by
- Invitrogen Antibodies (provider)
- Main image

- Experimental details
- Figure 2 RANK OE cells exhibit mesenchymal and stem-cell like characteristics. ( A ) Expression of epithelial-mesenchymal markers was analyzed by western blot and beta-Actin was used as loading control. ( B ) Cell migration was quantified after 24 h of stimuli with 2.5 mug/ml RANKL (+/-MAB626) or 10%FBS. ( C ) Expression of stemness-related markers was analyzed by western blot and beta-Actin was used as loading control. ( D ) beta-catenin was analyzed by western blot upon stimulus with 1 mug/ml RANKL for 90 min. beta-Actin was used as loading control. ( E ) Sphere Forming Capacity (SFC) quantification as the number of tumorspheres > 50 mum/number of cells seeded x 100, after 7 days in non-adherent conditions. ( n = 3) ( F ) Spheroids area with median and 95% CI considering all tumorspheres > 50 mum in diameter. ( G ) Cell viability was measured 72 h after exposure to paclitaxel (PTX) and doxorubicin (Doxo). ( n = 3). ( H ) Flow cytometry analysis of MDR1 expression in MCF-7 and T47D cells ( n = 2). ( I - K ) Interest gene expression in the ER+HER2- TCGA cohort ( n = 587) according to RANK expression. FiJi was used to obtain the best contrast for western blot band visualization, and background was removed for band densitometry analysis. Results are presented as the mean +- SEM. * p < 0.05, ** p < 0.01, *** p < 0.001.

- Submitted by
- Invitrogen Antibodies (provider)
- Main image
- Experimental details
- Figure 7 Expression of NANOG in human testis as determined by immunofluorescence in paraffin-embedded sections. (A-C) NANOG expression in differentiating male germ cells; dashed lines mark the boundaries of tubules.

- Submitted by
- Invitrogen Antibodies (provider)
- Main image

- Experimental details
- Figure 6 Reactivity of rNanogP8 and rNanog proteins towards 8 anti-Nanog Abs. WB analysis using 8 anti-Nanog Abs (A-H). Cell types from which the initial cDNAs were cloned are indicated on top. Individual Abs are indicated on the right and M.W on the left. For some Abs, both a long (LE) and short (SE) exposures were shown. N: non-induced; I: induced by IPTG (see Methods ). The red arrowheads in each panel indicate the 42 kD major Nanog protein and green arrows point to minor upper bands. In panel F, the two arrows point to the ~48/54 kD doublets recognized by the BioLegend Rb pAb.

- Submitted by
- Invitrogen Antibodies (provider)
- Main image

- Experimental details
- Figure 7 rNanogP8 protein ID using IP and mass spectrometry. ( A ) IP in rNanogP8 proteins using the SC pAb H-155 followed by WB using the R& D goat pAb. RbIgG was used as the control Ab. Red arrowhead, the 42 kD band; green arrowhead, the faster migrating major band in MCF7 rNanogP8; IgH, IgG heavy chain. ( B ) IP using the R&D goat pAb followed by WB using the eBioscience mAb. Goat IgG was used as the control Ab. Red arrowhead, the 42 kD band; green arrowheads, the two lower bands; IgH, IgG heavy chain. In this experiment, NTERA-2 NE and cytosol and HPCa rNanogP8 were also loaded in WB analysis. ( C-D ) Mass spectrometry ID of rNanogP8 proteins. The HPCa5 rNanogP8 protein made in pET-28b was used in IP with either H-155 or Kamiya Rb pAb (RbIgG as the Ab control). The immunoprecipitates were subjected to SDS-PAGE, stained with SYPRO Ruby, and 9 bands (rN1 - rN9) cut out for protein ID (C). M, protein marker. The identified peptides were presented in D. ( E-F ) Mass spectrometry ID of rNanogP8 proteins in a separate experiment using conditions as above. Four bands (RH1-RH4) were cut out for protein ID (E) and identified peptides presented in F.

- Submitted by
- Invitrogen Antibodies (provider)
- Main image

- Experimental details
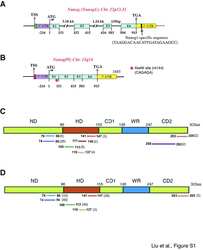
- Figure 1 WB analysis of endogenous Nanog1 protein species in NTERA-2 cells. ( A ) Schematic of the human Nanog protein and 8 anti-Nanog Abs used in this study. Shown in parentheses are epitopes of individual Abs. ND, N-terminus domain; HD, homeodomain; CD1 and CD2, C-terminus domain 1 and 2; WR, tryptophan-rich domain. The asterisk in ND indicates the Leu61 residue recognized by the eBioscience mAb (arrow) mapped from our present studies. (B-H) WB analysis in NTERA-2 NE (N, two different batches) or cytosol (C) using 8 anti-Nanog Abs. Individual Ab is indicated at the bottom and M.W on the left. Black arrowhead, the predicted 35 kD Nanog protein; red arrowhead, the main 42 kD band; green arrows, additional bands (especially after longer exposures).

- Submitted by
- Invitrogen Antibodies (provider)
- Main image

- Experimental details
- Figure 3 IP and ID studies with 5 anti-Nanog antibodies in NTERA-2 and cancer cells. ( A ) The NE of NTERA-2 and various cancer cells was used in IP with the Kamiya anti-Nanog Rb pAb followed by WB with the eBioscience mAb. Lanes 1-6 were regular WB with either cytosol (C) or NE. Red arrowhead, the 42 kD Nanog band; IgH, IgG heavy chain (~53 kD). Note that the prominent 42 kD protein band was detected on WB (lane 4) and immunoprecipitated down (lane 9) only in NTERA-2 NE. ( B ) The NTERA-2 NE or Du145 cytosol (cyto) or NE was used in IP with the CS anti-Nanog rabbit mAb followed by WB with the R&D goat pAb. Lanes 1-3 were regular WB. Red arrowhead, the 42 kD Nanog band; IgH, IgG heavy chain. Note that the 42 kD Nanog protein was detected on WB (lane 1) and immunoprecipitated down (lane 9) only in NTERA-2 NE. ( C ) The NE of NTERA-2 and Du145 cells was used in IP with the SC anti-Nanog rabbit pAb H155 followed by WB with eBioscience mAb. Lanes 1-4 were regular WB using two independent preparations of Du145 or NTERA-2 NE. Red arrowhead, the 42-kD band; black arrowhead, the 35-kD Nanog band; IgH, IgG heavy chain. Note that the 42-kD protein band was detected on WB (lane 3 and 4) and immunoprecipitated down (lane 8) only in NTERA-2 NE. The right-pointing bracket indicates the cluster of Nanog protein bands below the dominant 42 kD band. ( D ) The NE of NTERA-2 cells and MCF7 cells (two independent preparations) was used in IP with the R&D anti-Nanog goat pAb (goat IgG used as the

- Submitted by
- Invitrogen Antibodies (provider)
- Main image

- Experimental details
- Figure 8 Evidence that rNanogP8 proteins can spontaneously form high M.W species. ( A ) rNanogP8 proteins from HPCa1 and MCF7, before and after purification, were used in WB using the R&D goat pAb. Note that prior to purification, the HPCa1 and MCF7 rNanogP8 proteins migrated at ~42 kD and ~37 kD, respectively, with a minor upper band detected for both proteins. After purification, the intensity of the upper bands (in the rectangle) became significantly stronger. ( B-C ) rNanogP8 proteins (from the indicated cell types) stored at -80degC for 8 days (B) or 5 weeks (C) were used in protein purification. Aliquots (20 ul) of 4 fractions (Frac.) for each sample, together with NTERA-2 non-induced (N) or induced (I) bacterial lysate (B) or LNCaP total bacterial lysate (Lys) or supernatant (Sup) (C), were used in WB with the eBioscience mAb. The arrows indicate the ~42 kD rNanogP8 proteins and right-hand brackets indicate high M.W ladders. ( D ) The HPCa5 and HPCa1 rNanogP8 proteins stored for 2 years was utilized in WB with the Kamiya pAb and eBioscience mAb, respectively. ( E ) Coomassie brilliant blue R-250 staining of rNanogP8 protein made from HPCa5 cDNA in pET-28a. The arrows indicate the high levels of rNanogP8 proteins under the induced conditions. M, protein marker; N, non-induced; I, induced by IPTG. ( F ) Coomassie brilliant blue R-250 staining of HPCa5 rNanogP8 proteins from refolding dialysis experiment. The inclusion bodies of rNanogP8 protein were first dissolved in 7

- Submitted by
- Invitrogen Antibodies (provider)
- Main image

- Experimental details
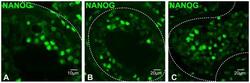
- Figure 1 Requirement of NANOG for CRPC growth. ( a ) NANOG western blot analysis (Cell Signaling, D73G4; Supplementary Table S1 ) in LAPC4 and LAPC9 tumors serially passaged in castrated (AI; passage number indicated) vs intact (AD) hosts. The blot was probed for AR, FOXA1 and GAPDH. *, a non-specific band. Note that the NANOG band upregulated in LAPC9 AI tumors was relatively faint, although the upregulation was corroborated by immunohistochemical (IHC) ( b ) and confocal immunofluorescence (IF) analysis ( c ). ( b ) IHC staining for NANOG (Kamiya; Supplementary Table S1 ) in AD vs AI LAPC4 and LAPC9 xenografts. Shown on top is the NANOG staining of LNCaP tumors grown in castrated hosts (pLVX, control cells expressing empty vector). ( c ) Representative confocal IF images for NANOG (Cell Signaling, D73G4) in AD vs AI LAPC9 tumors. ( d , e ) Freshly purified LAPC4 and LAPC9 AI cells were transduced with the indicated lentiviral Nanog-short interfering RNA construct (vs LL3.7 control) and subcutaneously injected (1 K or 10 K) in castrated nonobese diabetic/severe combined immunodeficiency mice ( n =8-12). Endpoint tumor weight (mean+-s.d.), P -values for weight (Student's t -test) and tumor incidence ( chi 2 -test for statistic) are indicated. ( f ) Enzalutamide resistance in LNCaP cells overexpressing NP8 relative to pLVX control. LNCaP-pLVX and LNCaP-NP8 cells were plated in the presence of DOX (1 mug ml -1 , 48 h) and then cultured in charcoal-dextran stripped serum plus 40

- Submitted by
- Invitrogen Antibodies (provider)
- Main image

- Experimental details
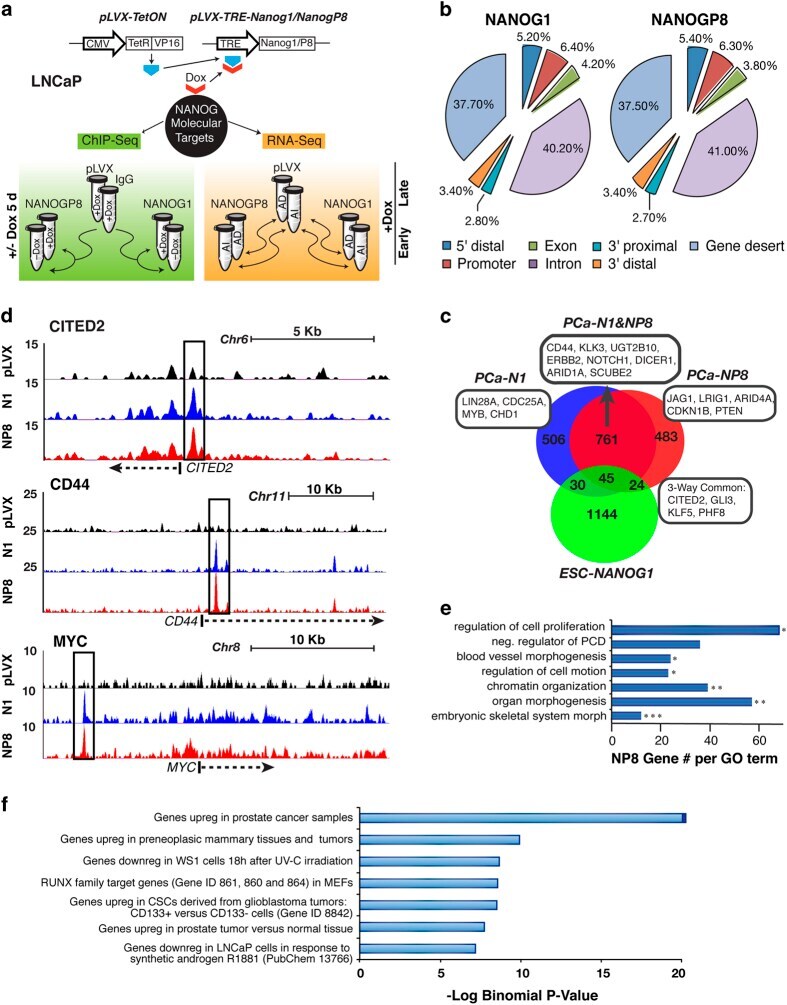
- Figure 2 Distinct genomic occupancy of NANOG. ( a ) Scheme for ChIP-Seq and RNA-Seq in LNCaP cells expressing NANOG1 (N1) or NANOGP8 (NP8) vs vector control (pLVX) for the indicated time with or without DOX. ( b ) Genomic distribution of NANOG occupancy relative to the transcription start site (TSS) or transcription end site (TES) of the nearest gene. 5' distal (-15 kb to -5 kb from the TSS), promoter (-5 kb to +0.5 kb from the TSS), 3' proximal (-0.5 kb to +5 kb from TES), 3' distal (+5 kb to +15 kb from the TES); gene desert is all other genomic regions. ( c ) Venn diagram of the promoter region (-8 kb to +2 kb) occupancy of NANOG in ESCs [ 16 ] vs N1 and NP8 in LNCaP cells. ( d ) Representative ChIP-Seq traces recovered from the UCSC genome browser. ( e ) Promoter region (-8 kb to +2 kb) occupancy gene ontology (GO) analysis via DAVID. Presented are GO Term Biological Processes, level 4; * P
- Submitted by
- Invitrogen Antibodies (provider)
- Main image

- Experimental details
- Figure 4 NANOG co-localizes and interacts with AR and FOXA1. ( a ) Multispectral confocal immunofluorescence analysis of NANOG (rabbit mAb, green), AR (mouse mAb, red) and FOXA1 (goat pAb, gray) in LNCaP-NP8 cells (the lower right panel being the four-color merge). Cells were counterstained by 4,6-diamidino-2-phenylindole (blue). Arrows indicate NP8- or AR-expressing cells, whereas the arrowhead marks a NP8/AR co-expressing cell. Shown below are semi-quantitative spectral peaks of four cells (left) circumscribed on the right image in white dashed line. ( b ) CentriMo analysis of the positional distribution of FOXA family motifs (motif 1, FOXA1 and FOXA2) +-500 bp of the pinnacle. ( c ) CentriMo analysis of the positional distribution of AR family motifs (AR full motif MA0007.1 and AR half motifs ARE_A and ARE_B) +-500 bp of the pinnacle. ( d , e ) NANOG interacts with both AR and FOXA1 in LNCaP cells. Whole-cell lysate from the indicated cell types (that is, LNCaP-pLVX control and LNCaP-overexpressing NANOG1 or NP8) were used in immunoprecipitation (IP) with either anti-AR rabbit pAb followed by western blot (WB) with anti-AR mouse mAb, anti-FOXA1 goat pAb and anti-NANOG mouse mAb ( d ) or IP with anti-FOXA1 goat pAb followed by WB with anti-FOXA1 rabbit pAb, anti-AR mouse mAb and anti-NANOG rabbit mAb ( e ). N-tera EC cell lysate was used as a positive control for NANOG (42 kDa; lane 1). ( f ) Recombinant NP8 interacts with both AR and FOXA1 in cell-free systems. GST pull-do

- Submitted by
- Invitrogen Antibodies (provider)
- Main image

- Experimental details
- Figure 7 Biological integration of NANOG-reprogrammed PCa cell resistance to androgen deprivation. ( a ) WB analysis of two AR-regulated differentiation proteins (PSA and NKX3.1) in LNCaP cells expressing NANOG1 (N1) or NANOGP8 (NP8) under regular culture (AD) conditions. ( b , c ) ChIP-qPCR analysis of NANOG binding to the promoter (Prom) and/or enhancers (Enh) of the indicated genes (see Supplementary Figure S8A for locations of the loci) in Dox-induced LNCaP cells under AD ( b ) and AI ( c ) conditions. ChIP was performed with R&D anti-NANOG goat pAb. ( d ) Functional analysis of NANOG target genes by siRNA-mediated knockdown. NP8-expressing and control (pLVX) LNCaP cells maintained in charcoal-dextran stripped serum and transfected with the siRNAs (100 n m , 72 h) against UBE2C or MYC (positive control) were used in cell proliferation assays. Presented are % EdU + cells (mean+-s.e.m.; n =3). ( e ) A model depicting modes of operation (a-d) of NANOG during reprogramming of androgen-dependent PCa cells to the CRPC state.
