Explore
 Validate
 Learn
Learn Western blot
Antibody data
- Antibody Data
- Antigen structure
- References [1]
- Comments [0]
- Validations
- Western blot [3]
- ELISA [1]
- Immunocytochemistry [2]
- Other assay [4]
Submit
Validation data
Reference
Comment
Report error
- Product number
- PA5-85110 - Provider product page

- Provider
- Invitrogen Antibodies
- Product name
- Nanog Polyclonal Antibody
- Antibody type
- Polyclonal
- Antigen
- Recombinant full-length protein
- Description
- Keep as concentrated solution.
- Concentration
- 0.5 mg/mL
Submitted references Androgen Receptor, Although Not a Specific Marker For, Is a Novel Target to Suppress Glioma Stem Cells as a Therapeutic Strategy for Glioblastoma.
Zhao N, Wang F, Ahmed S, Liu K, Zhang C, Cathcart SJ, DiMaio DJ, Punsoni M, Guan B, Zhou P, Wang S, Batra SK, Bronich T, Hei TK, Lin C, Zhang C
Frontiers in oncology 2021;11:616625
Frontiers in oncology 2021;11:616625
No comments: Submit comment
Supportive validation
- Submitted by
- Invitrogen Antibodies (provider)
- Main image

- Experimental details
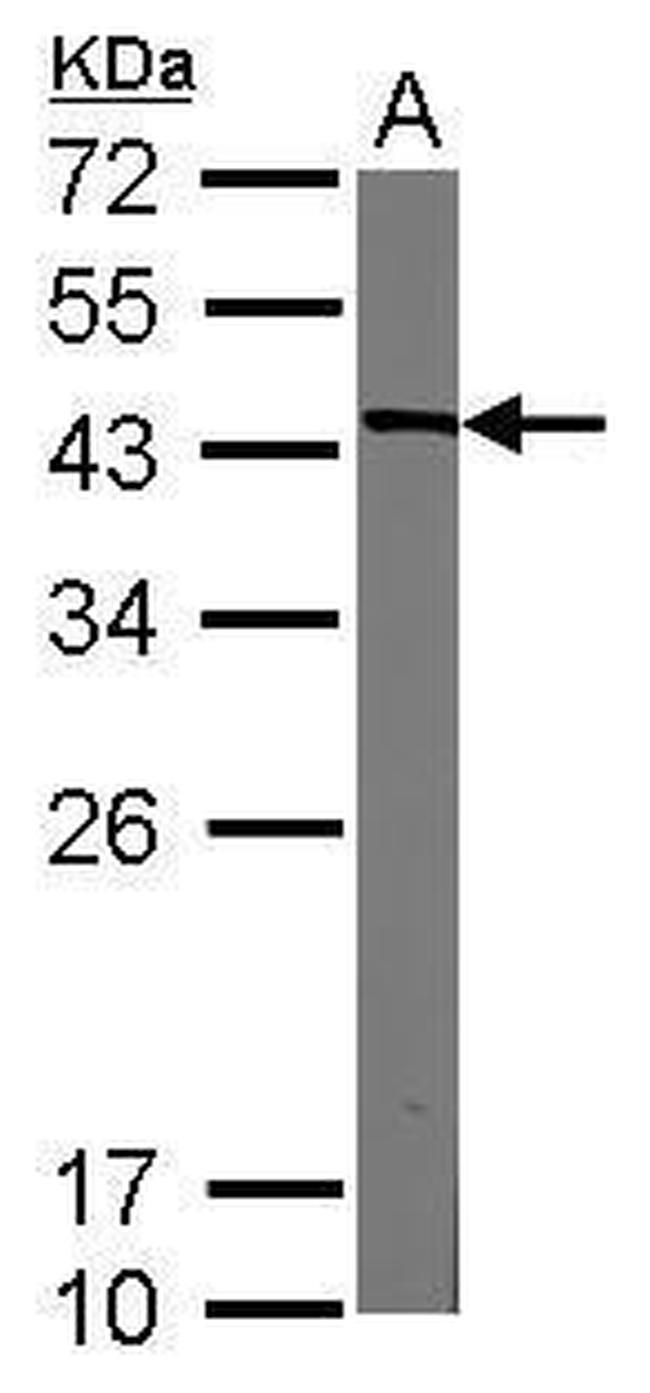
- Western blot analysis of Nanog in A) mouse ESC using Nanog polyclonal antibody (Product # PA5-85110) using 20 µg of sample at a dilution of 1:3000. Sample was then incubated with HRP-conjugated anti-rabbit IgG secondary antibody. Prior to incubation with primary antibody, the sample was separated on 12% SDS-PAGE.
- Submitted by
- Invitrogen Antibodies (provider)
- Main image

- Experimental details
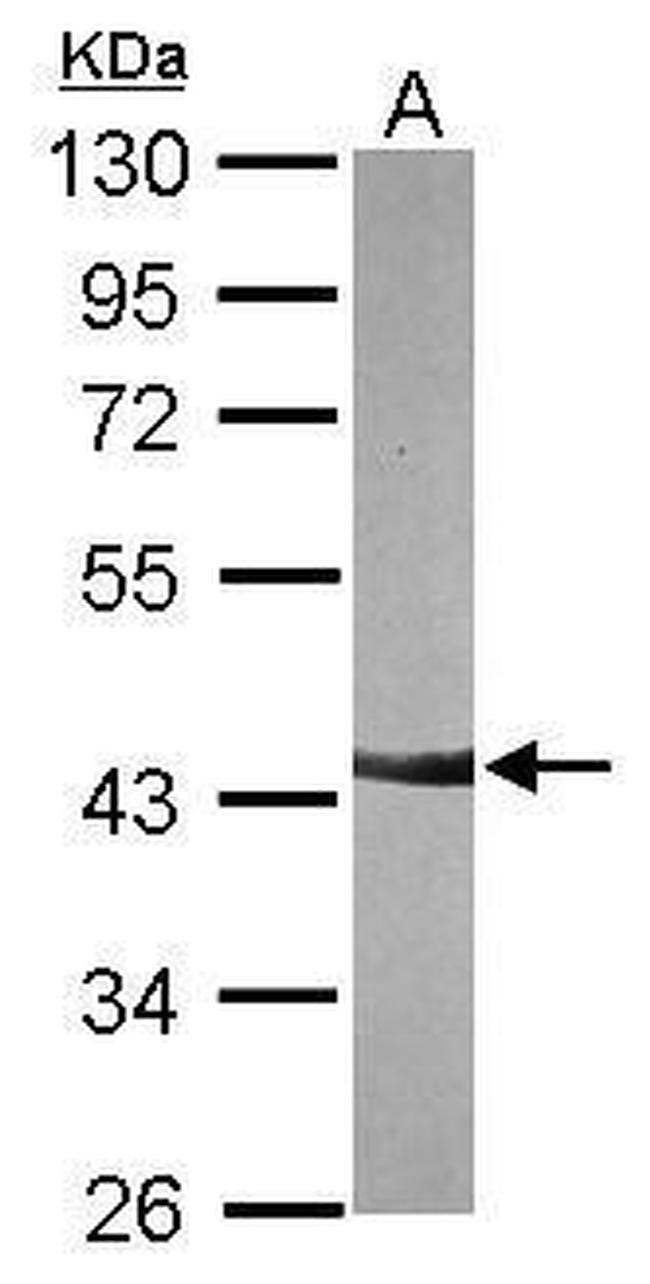
- Western blot analysis of Nanog in A) NIH-3T3 using Nanog polyclonal antibody (Product # PA5-85110) using 30 µg of sample at a dilution of 1:3000. Sample was then incubated with HRP-conjugated anti-rabbit IgG secondary antibody. Prior to incubation with primary antibody, the sample was separated on 10% SDS-PAGE.
- Submitted by
- Invitrogen Antibodies (provider)
- Main image
- Experimental details
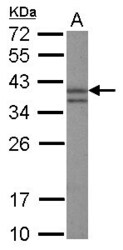
- Western Blot using Nanog Polyclonal Antibody (Product # PA5-85110). Sample (30 µg of whole cell lysate). Lane A: HeLa nucleus. 12% SDS PAGE. Nanog Polyclonal Antibody (Product # PA5-85110) diluted at 1:3,000. The HRP-conjugated anti-rabbit IgG antibody was used to detect the primary antibody.

Supportive validation
- Submitted by
- Invitrogen Antibodies (provider)
- Main image
- Experimental details
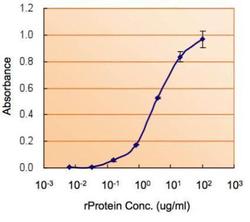
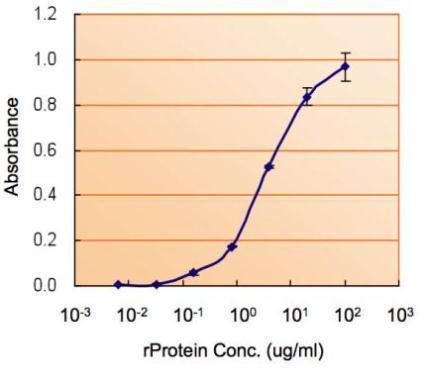
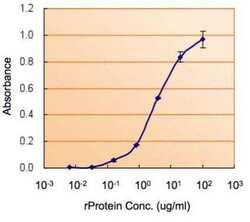
- ELISA detection of NANOG using Nanog Polyclonal Antibody (Product # PA5-85110) for capture at a concentration of 5 µg/mL and a second Nanog Polyclonal Antibody for detection at a concentration of 5 µg/mL.
Supportive validation
- Submitted by
- Invitrogen Antibodies (provider)
- Main image
- Experimental details
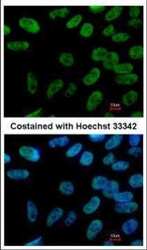
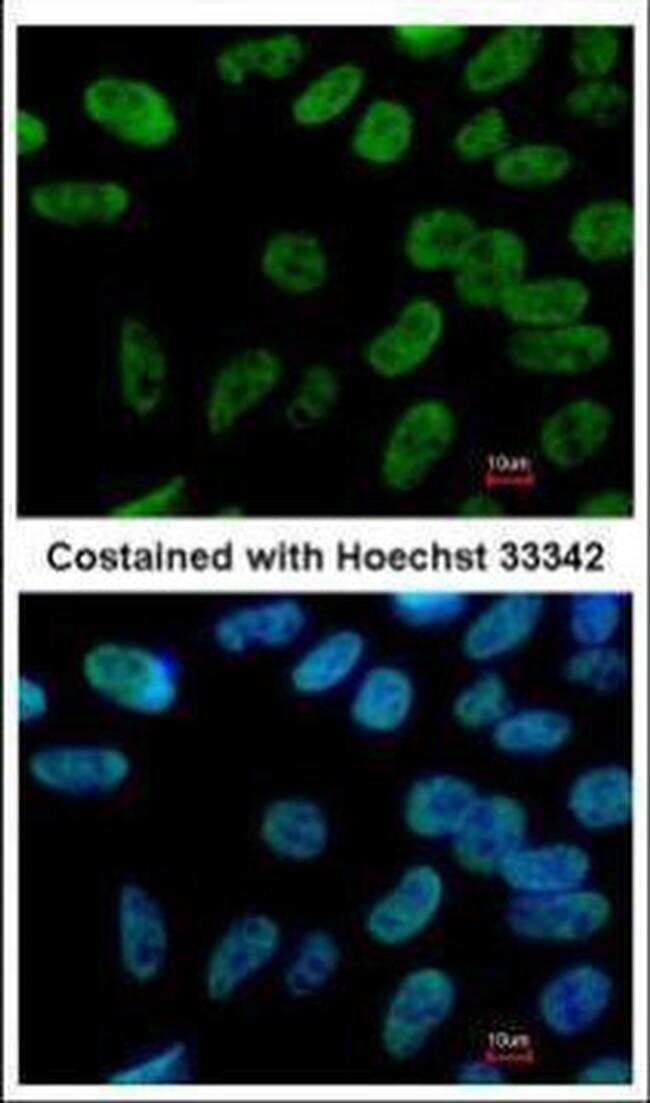
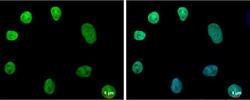
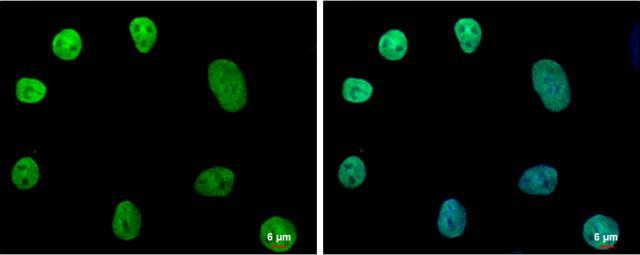
- Immunocytochemistry analysis of Nanog in 4% paraformaldehyde-fixed human embryonic stem cells using Nanog polyclonal antibody (Product # PA5-85110) at a dilution of 1:400.
- Submitted by
- Invitrogen Antibodies (provider)
- Main image
- Experimental details
- NANOG antibody [N3C3] detects NANOG protein at nucleus by immunofluorescent analysis. Sample: NT2D1 cells were fixed in 2% paraformaldehyde/culture medium at RT for 30 min. Green: NANOG protein stained by NANOG antibody [N3C3] (Product # PA5-85110) diluted at 1:500. Blue: Hoechst 33342 staining. Scale bar = 6 µm.
Supportive validation
- Submitted by
- Invitrogen Antibodies (provider)
- Main image
- Experimental details
- ELISA analysis of Nanog using Nanog polyclonal antibody (Product # PA5-85110) at a dilution of 5 µg/mL.

- Submitted by
- Invitrogen Antibodies (provider)
- Main image
- Experimental details
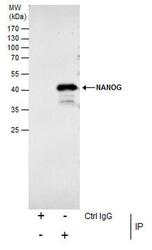
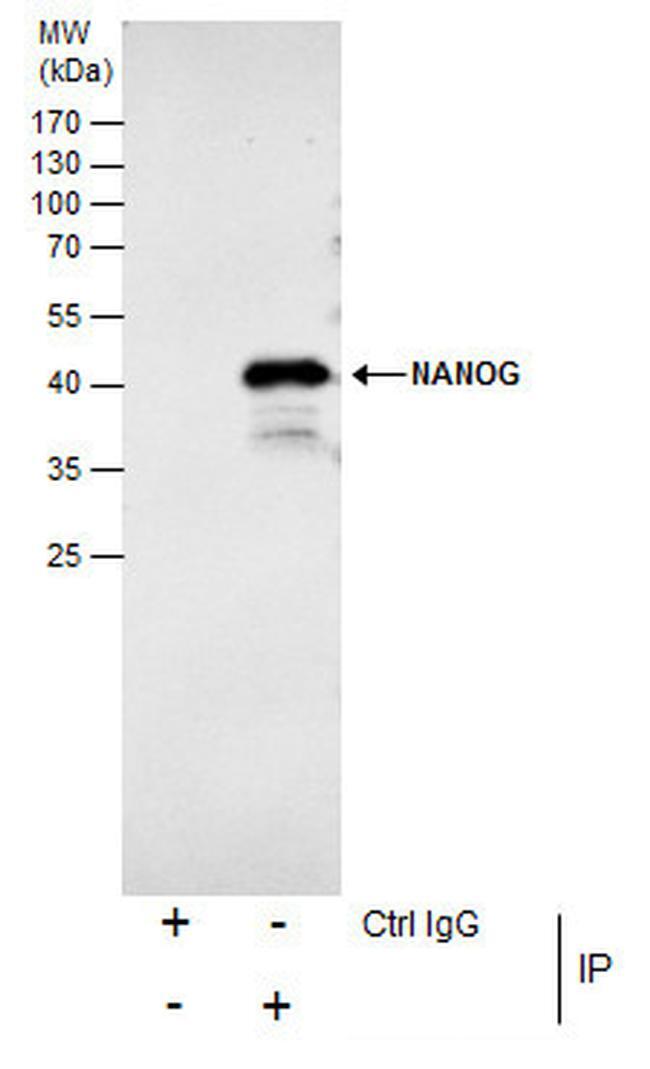
- Immunoprecipitation analysis of Nanog in NT2D1 whole cell extract with Nanog polyclonal antibody (Product # PA5-85110) using 5 µg of sample, followed by anti-Rabbit IgG secondary antibody.
- Submitted by
- Invitrogen Antibodies (provider)
- Main image

- Experimental details
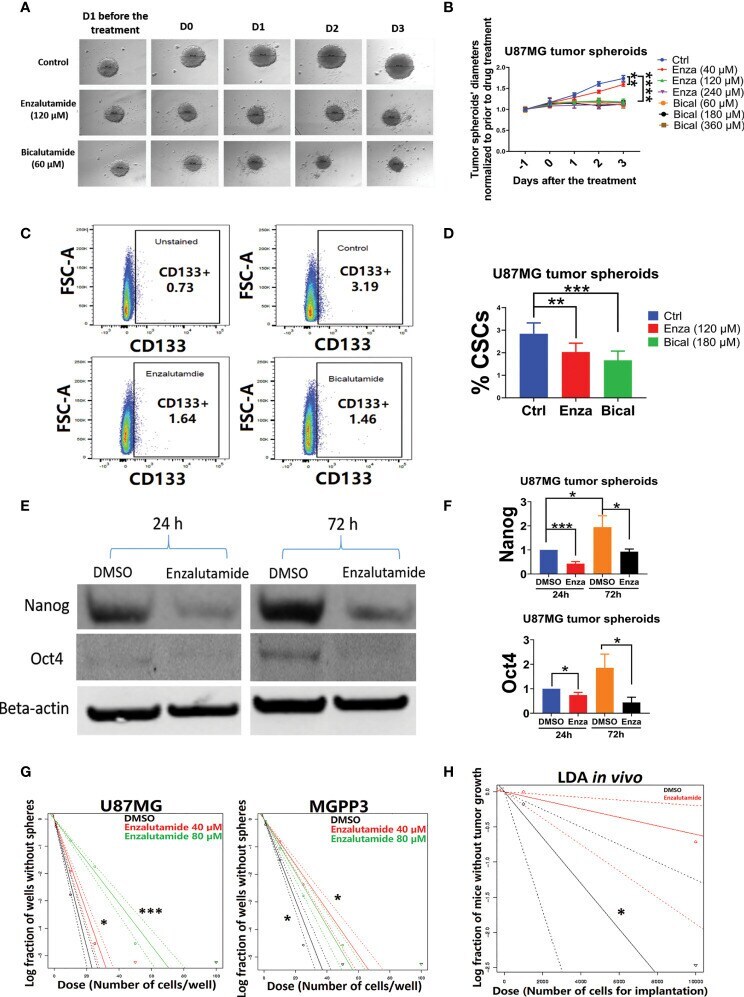
- Figure 4 AR antagonists decrease the cancer stem cell population in U87MG GBM cells in vitro . U87MG spheroids were cultured in low serum medium (0.5%) for 2 days and then treated with DMSO (negative control), enzalutamide (120 uM), or bicalutamide (180 uM) for another 4 days with diameters of spheroids measured daily. (A) Representative figures of the U87MG spheroids before and after the treatment of enzalutamide (120 uM) or bicalutamide (60 uM). (B) Measured diameters of the spheroids normalized to before the treatment during drug treatment with increasing concentrations of enzalutamide (40, 120, and 240 uM) or bicalutamide (60, 180, and 360 uM). (C) Representative flow cytometry gating strategy with dissociated cells from U87MG spheroids. Upper left: no drug treatment and no CD133 antibody staining; upper right: DMSO only (no drug treatment control); lower left: enzalutamide (120 uM); lower right: bicalutamide (180 uM). (D) CSC populations (CD133+) were compared in dissociated cells from spheroids with or without treatment of AR antagonists using flow cytometry as shown in (C) Eight replicates per group were used for flow cytometry with mean values presented in the histogram. (E) Western blotting assays showed decreased expression levels of CSC markers, Nanog and Oct4, after enzalutamide treatment for 24 and 72 h. (F) Quantification of Nanog and Oct4 protein levels before and after the treatment of enzalutamide for 24 and 72 h. All experiments were performed with three ind
- Submitted by
- Invitrogen Antibodies (provider)
- Main image

- Experimental details
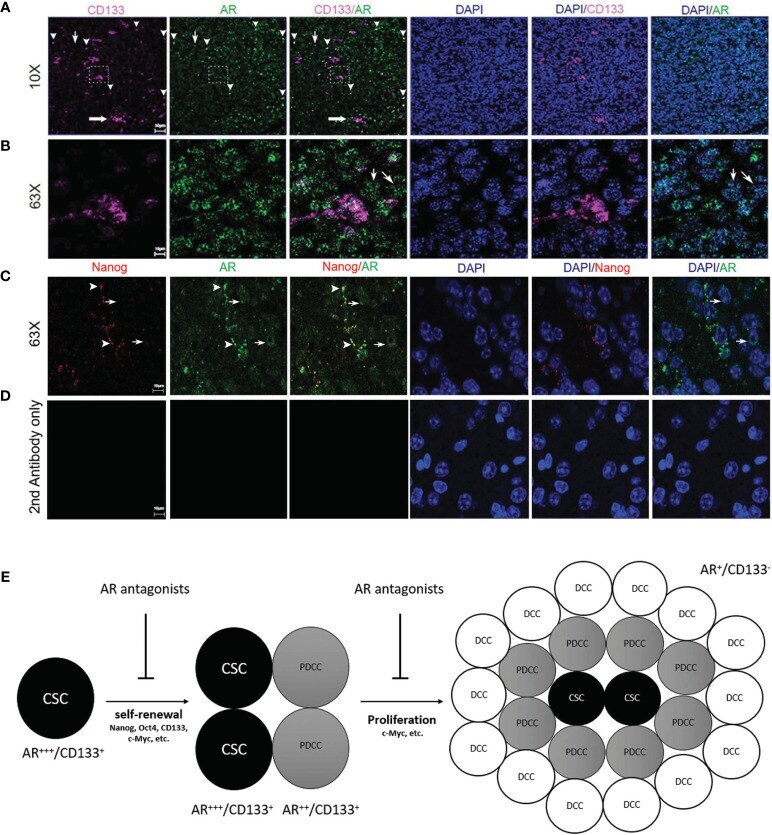
- Figure 7 Immunofluorescence confocal microscopy on mouse GBM FFPE specimen (5 um thickness) showing the subcellular localizations of AR (green), CD133 (pink) and DAPI-stained nuclei (blue). (A) Low magnification images (10x) and (B) high magnification images (63x) which were scanned from areas in the dash line boxes in (A) demonstrated co-expression of CD133 in AR-expressing (AR+) cells with high staining intensity (arrowheads). AR expression can be seen in CD133 negative cells but with low AR staining intensity (thin arrows). (C) High magnification images (63x) demonstrated co-expression of Nanog in AR+ cells with high AR staining intensity (arrowheads). Cells with negative Nanog staining could be AR+ but showed weaker AR staining intensities than Nanog+ cells (thin arrows). (D) High magnification images (63x) with slides stained with secondary antibodies only as negative controls. (E) Schematic figure showing the proposed mechanisms of AR antagonists inhibiting both cancer stem cells maintenance and cancer proliferation from more differentiated cells. CSC, cancer stem cell; PDCC, partially differentiated cancer cell; DCC, differentiated cancer cell.