Explore
 Validate
 Learn
Learn Western blot
 Immunocytochemistry
Antibody data
- Antibody Data
- Antigen structure
- References [11]
- Comments [0]
- Validations
- Immunocytochemistry [8]
- Immunohistochemistry [1]
- Chromatin Immunoprecipitation [2]
- Other assay [8]
Submit
Validation data
Reference
Comment
Report error
- Product number
- PA1-097 - Provider product page

- Provider
- Invitrogen Antibodies
- Product name
- Nanog Polyclonal Antibody
- Antibody type
- Polyclonal
- Antigen
- Recombinant full-length protein
- Description
- This antibody is not recommended for mouse testes tissue or human ovarian carcinoma in IHC applications.
- Reactivity
- Human
- Host
- Rabbit
- Isotype
- IgG
- Vial size
- 100 μg
- Concentration
- 1 mg/mL
- Storage
- -20°C
Submitted references Glioblastoma Cells Counteract PARP Inhibition through Pro-Survival Induction of Lipid Droplets Synthesis and Utilization.
Uncovering the Metabolic and Stress Responses of Human Embryonic Stem Cells to FTH1 Gene Silencing.
Mesenchymal stem cells combined with liraglutide relieve acute lung injury through apoptotic signaling restrained by PKA/β-catenin.
Establishment and characterization of induced pluripotent stem cells (iPSCs) from central nervous system lupus erythematosus.
FACT Sets a Barrier for Cell Fate Reprogramming in Caenorhabditis elegans and Human Cells.
Modeling Short QT Syndrome Using Human-Induced Pluripotent Stem Cell-Derived Cardiomyocytes.
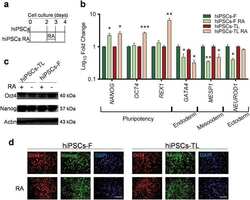
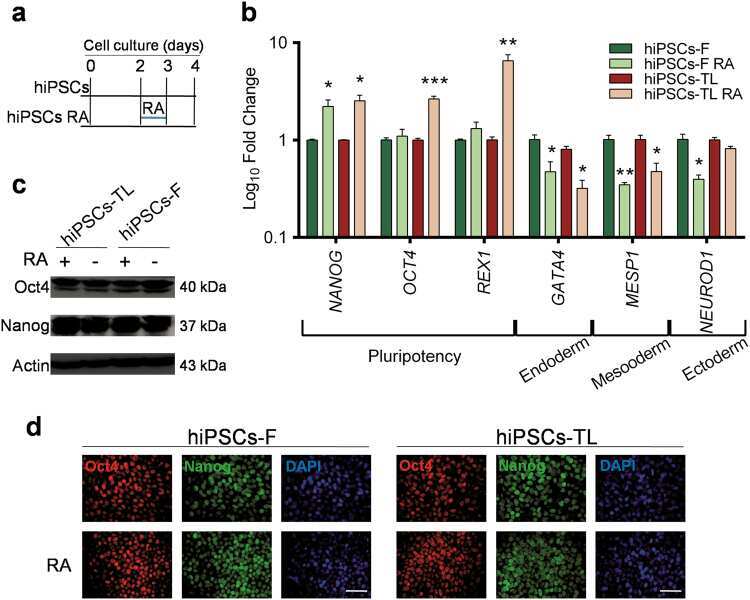
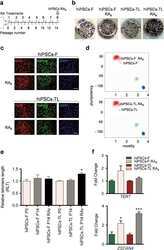
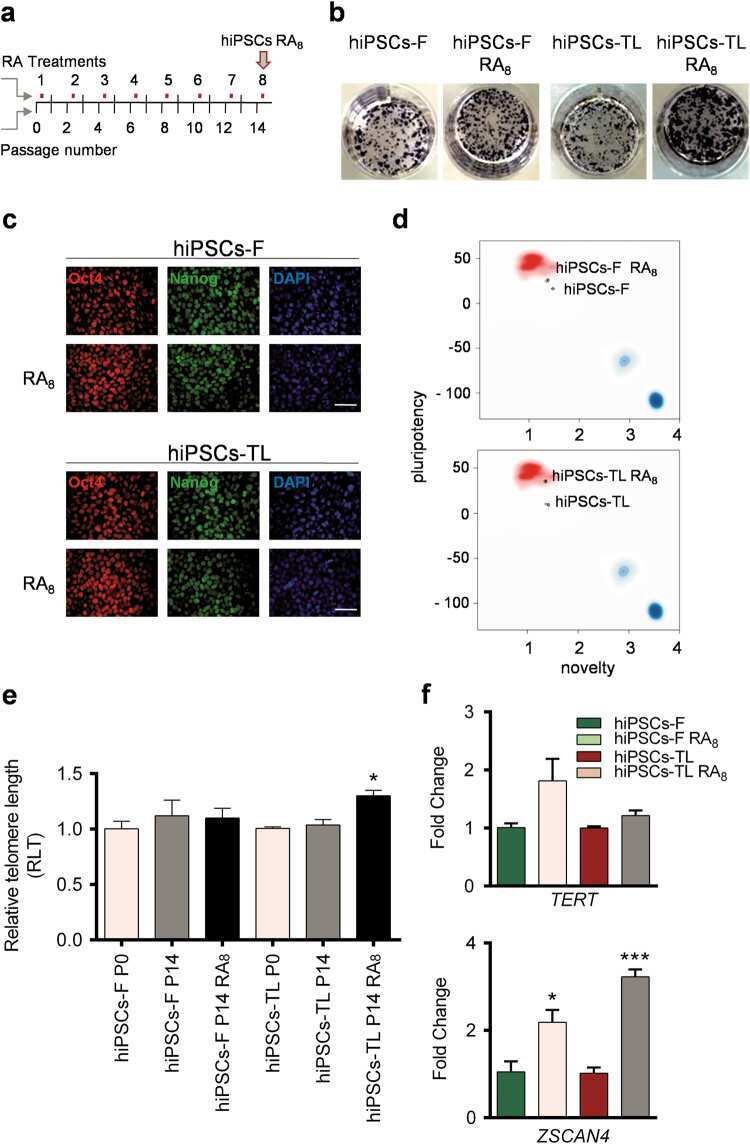
Short-term retinoic acid treatment sustains pluripotency and suppresses differentiation of human induced pluripotent stem cells.
Comprehensive characterization of chorionic villi-derived mesenchymal stromal cells from human placenta.
Directed reprogramming of comprehensively characterized dental pulp stem cells extracted from natal tooth.
MicroRNAs-Proteomic Networks Characterizing Human Medulloblastoma-SLCs.
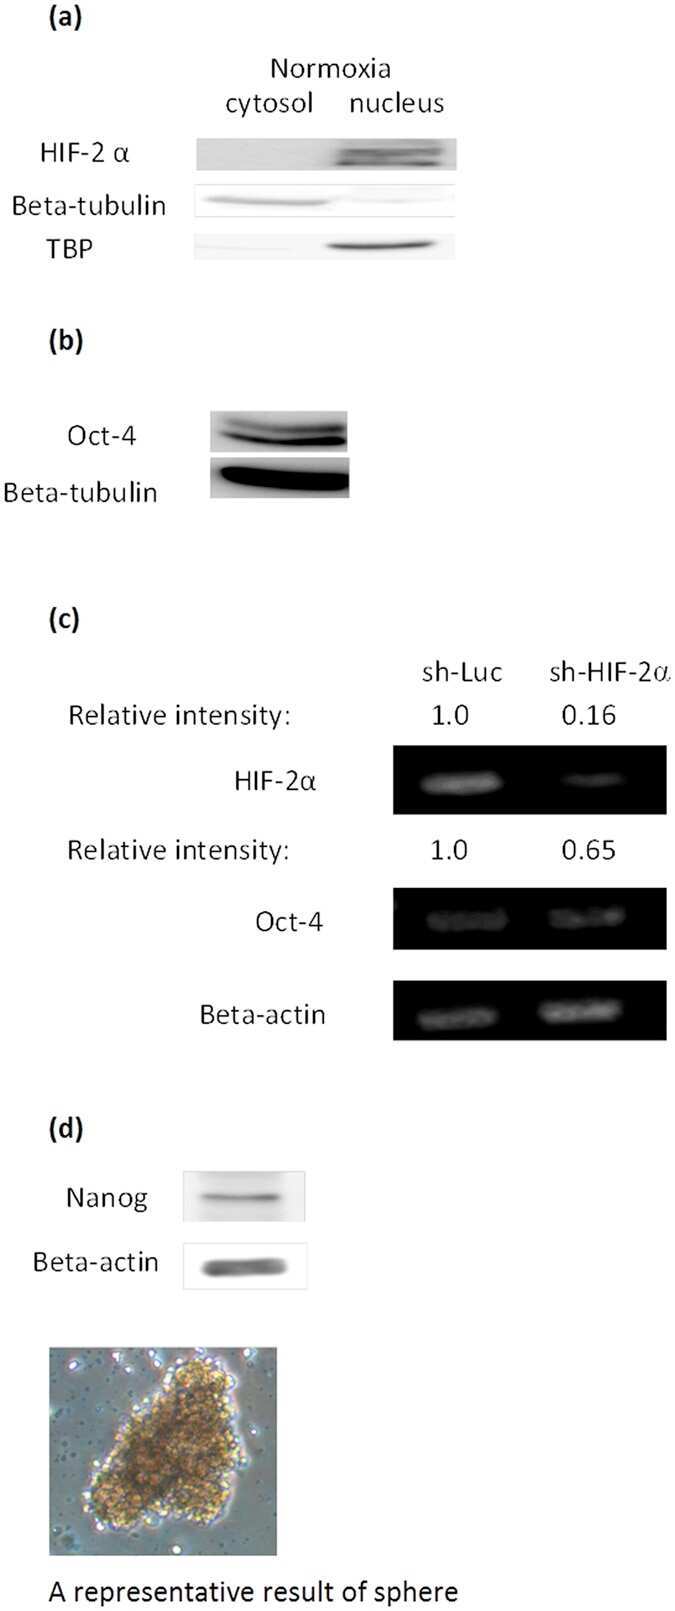
Genome-wide analysis of HIF-2α chromatin binding sites under normoxia in human bronchial epithelial cells (BEAS-2B) suggests its diverse functions.
Majuelos-Melguizo J, Rodríguez-Vargas JM, Martínez-López N, Delgado-Bellido D, García-Díaz Á, Yuste VJ, García-Macía M, López LM, Singh R, Oliver FJ
Cancers 2022 Jan 30;14(3)
Cancers 2022 Jan 30;14(3)
Uncovering the Metabolic and Stress Responses of Human Embryonic Stem Cells to FTH1 Gene Silencing.
Scaramuzzino L, Lucchino V, Scalise S, Lo Conte M, Zannino C, Sacco A, Biamonte F, Parrotta EI, Costanzo FS, Cuda G
Cells 2021 Sep 15;10(9)
Cells 2021 Sep 15;10(9)
Mesenchymal stem cells combined with liraglutide relieve acute lung injury through apoptotic signaling restrained by PKA/β-catenin.
Yang X, Ma X, Don O, Song Y, Chen X, Liu J, Qu J, Feng Y
Stem cell research & therapy 2020 May 19;11(1):182
Stem cell research & therapy 2020 May 19;11(1):182
Establishment and characterization of induced pluripotent stem cells (iPSCs) from central nervous system lupus erythematosus.
De Angelis MT, Santamaria G, Parrotta EI, Scalise S, Lo Conte M, Gasparini S, Ferlazzo E, Aguglia U, Ciampi C, Sgura A, Cuda G
Journal of cellular and molecular medicine 2019 Nov;23(11):7382-7394
Journal of cellular and molecular medicine 2019 Nov;23(11):7382-7394
FACT Sets a Barrier for Cell Fate Reprogramming in Caenorhabditis elegans and Human Cells.
Kolundzic E, Ofenbauer A, Bulut SI, Uyar B, Baytek G, Sommermeier A, Seelk S, He M, Hirsekorn A, Vucicevic D, Akalin A, Diecke S, Lacadie SA, Tursun B
Developmental cell 2018 Sep 10;46(5):611-626.e12
Developmental cell 2018 Sep 10;46(5):611-626.e12
Modeling Short QT Syndrome Using Human-Induced Pluripotent Stem Cell-Derived Cardiomyocytes.
El-Battrawy I, Lan H, Cyganek L, Zhao Z, Li X, Buljubasic F, Lang S, Yücel G, Sattler K, Zimmermann WH, Utikal J, Wieland T, Ravens U, Borggrefe M, Zhou XB, Akin I
Journal of the American Heart Association 2018 Mar 24;7(7)
Journal of the American Heart Association 2018 Mar 24;7(7)
Short-term retinoic acid treatment sustains pluripotency and suppresses differentiation of human induced pluripotent stem cells.
De Angelis MT, Parrotta EI, Santamaria G, Cuda G
Cell death & disease 2018 Jan 5;9(1):6
Cell death & disease 2018 Jan 5;9(1):6
Comprehensive characterization of chorionic villi-derived mesenchymal stromal cells from human placenta.
Ventura Ferreira MS, Bienert M, Müller K, Rath B, Goecke T, Opländer C, Braunschweig T, Mela P, Brümmendorf TH, Beier F, Neuss S
Stem cell research & therapy 2018 Feb 5;9(1):28
Stem cell research & therapy 2018 Feb 5;9(1):28
Directed reprogramming of comprehensively characterized dental pulp stem cells extracted from natal tooth.
Pisal RV, Suchanek J, Siller R, Soukup T, Hrebikova H, Bezrouk A, Kunke D, Micuda S, Filip S, Sullivan G, Mokry J
Scientific reports 2018 Apr 18;8(1):6168
Scientific reports 2018 Apr 18;8(1):6168
MicroRNAs-Proteomic Networks Characterizing Human Medulloblastoma-SLCs.
Catanzaro G, Besharat ZM, Garg N, Ronci M, Pieroni L, Miele E, Mastronuzzi A, Carai A, Alfano V, Po A, Screpanti I, Locatelli F, Urbani A, Ferretti E
Stem cells international 2016;2016:2683042
Stem cells international 2016;2016:2683042
Genome-wide analysis of HIF-2α chromatin binding sites under normoxia in human bronchial epithelial cells (BEAS-2B) suggests its diverse functions.
Lee MC, Huang HJ, Chang TH, Huang HC, Hsieh SY, Chen YS, Chou WY, Chiang CH, Lai CH, Shiau CY
Scientific reports 2016 Jul 4;6:29311
Scientific reports 2016 Jul 4;6:29311
No comments: Submit comment
Supportive validation
- Submitted by
- Invitrogen Antibodies (provider)
- Main image
- Experimental details
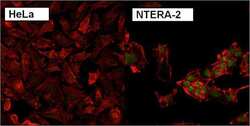
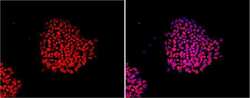
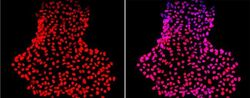
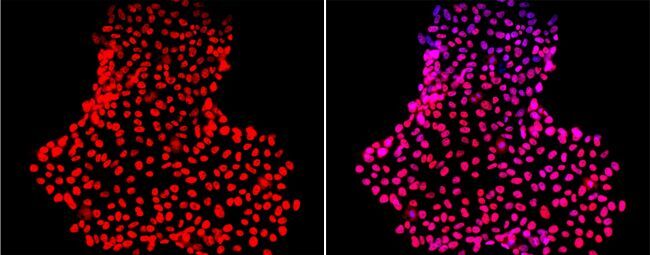
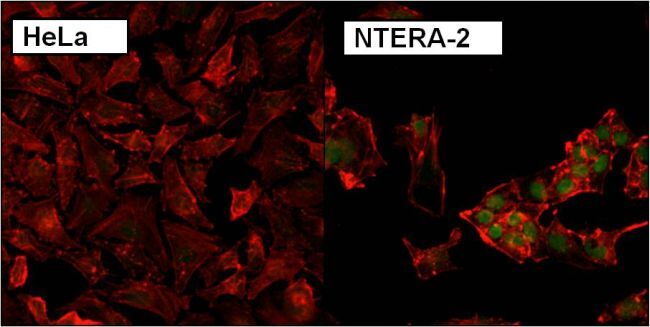
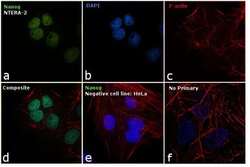
- Immunofluorescent analysis of Nanog using anti-Nanog polyclonal antibody (Product # PA1-097) shows specific expression in human embryonal carcinoma NTERA-2 cells (shown in green) but not in negative control HeLa cells. Formalin fixed cells were permeabilized with 0.1% Triton X-100 in TBS for 10 minutes at room temperature. Cells were blocked with 1% Blocker BSA (Product # 37525) for 15 minutes at room temperature. Cells were probed with a rabbit polyclonal antibody recognizing Nanog (Product # PA1-097), at a dilution of 1:200 for at least 1 hour at room temperature. Cells were washed with PBS and incubated with DyLight 488 goat-anti-rabbit IgG secondary antibody (Product # 35552) at a dilution of 1:400 for 30 minutes at room temperature. F-Actin (red) was stained with DY-547 phalloidin, nuclei (blue) were stained with Hoechst 33342 dye (Product # 62249). Images were taken on a Thermo Scientific ArrayScan at 20X magnification.

- Submitted by
- Invitrogen Antibodies (provider)
- Main image
- Experimental details
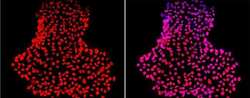
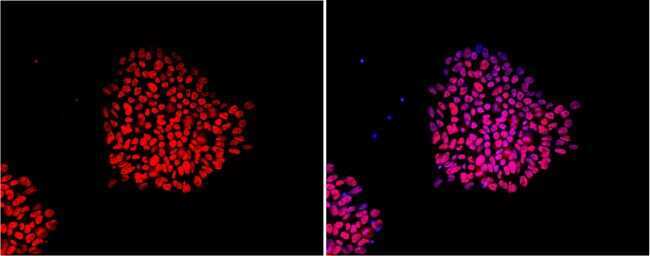
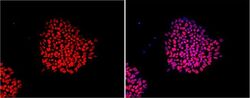
- Immunofluorescent analysis of Nanog using anti-Nanog polyclonal antibody (Product # PA1-097) shows nuclear localization in the human iPS cell line HEL 11.4. Nanog staining (red) and an overlay image of Nanog with DAPI (pink) is shown. HEL-11.4 cells were grown on matrigel coated chamber slides, fixed with formaldehyde and permeabilized with 0.1% Triton X-100 in TBS for 15 minutes at room temperature. The cells were probed with a rabbit polyclonal antibody recognizing Nanog (Product # PA1-097) at a dilution of 1:100 overnight at 4 °C, washed with PBS and incubated with a FITC-conjugated secondary antibody at a dilution of 1:100 for 60 minutes at room temperature. Images were taken on at 20X magnification.
- Submitted by
- Invitrogen Antibodies (provider)
- Main image
- Experimental details
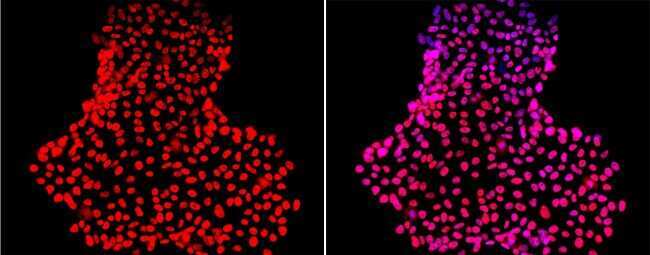
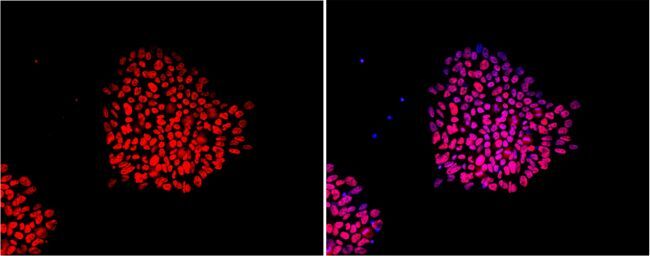
- Immunofluorescent analysis of Nanog using anti-Nanog polyclonal antibody (Product # PA1-097) shows nuclear localization in the human embryonic stem cell line H9. Nanog staining (red) and an overlay image of Nanog with DAPI (pink) is shown. H9 cells were grown on matrigel coated chamber slides, fixed with formaldehyde and permeabilized with 0.1% Triton X-100 in TBS for 15 minutes at room temperature. The cells were probed with a rabbit polyclonal antibody recognizing Nanog (Product # PA1-097) at a dilution of 1:100 overnight at 4 °C, washed with PBS and incubated with a FITC-conjugated secondary antibody at a dilution of 1:100 for 60 minutes at room temperature. Images were taken on at 20X magnification.
- Submitted by
- Invitrogen Antibodies (provider)
- Main image
- Experimental details
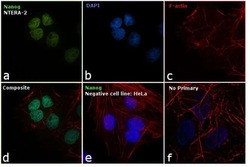
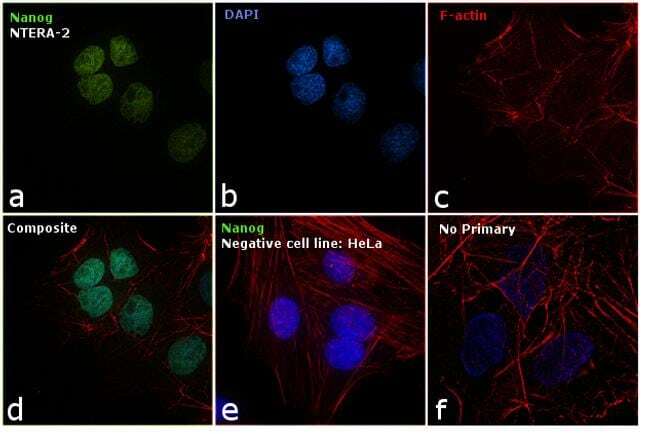
- Immunofluorescence analysis of Nanog was performed using 70% confluent log phase NTERA-2 cells. The cells were fixed with 4% paraformaldehyde for 10 minutes, permeabilized with 0.1% Triton™ X-100 for 15 minutes, and blocked with 1% BSA for 1 hour at room temperature. The cells were labeled with Nanog Rabbit Polyclonal Antibody (Product # PA1-097X) at 5 µg/mL in 0.1% BSA, incubated at 4 degree Celsius overnight and then labeled with Goat anti-Rabbit IgG (H+L) Superclonal™ Secondary Antibody, Alexa Fluor® 488 conjugate (Product # A27034) at a dilution of 1:2000 for 45 minutes at room temperature (Panel a: green). Nuclei (Panel b: blue) were stained with ProLong™ Diamond Antifade Mountant with DAPI (Product # P36962). F-actin (Panel c: red) was stained with Rhodamine Phalloidin (Product # R415, 1:300). Panel d represents the merged image showing nuclear localization. Panel e shows Nanog negative cell line HeLa with no signal. Panel f represents control cells with no primary to assess background. The images were captured at 60X magnification.

- Submitted by
- Invitrogen Antibodies (provider)
- Main image
- Experimental details
- Immunofluorescent analysis of Nanog using anti-Nanog polyclonal antibody (Product # PA1-097) shows nuclear localization in the human iPS cell line HEL 11.4. Nanog staining (red) and an overlay image of Nanog with DAPI (pink) is shown. HEL-11.4 cells were grown on matrigel coated chamber slides, fixed with formaldehyde and permeabilized with 0.1% Triton X-100 in TBS for 15 minutes at room temperature. The cells were probed with a rabbit polyclonal antibody recognizing Nanog (Product # PA1-097) at a dilution of 1:100 overnight at 4 °C, washed with PBS and incubated with a FITC-conjugated secondary antibody at a dilution of 1:100 for 60 minutes at room temperature. Images were taken on at 20X magnification.
- Submitted by
- Invitrogen Antibodies (provider)
- Main image
- Experimental details
- Immunofluorescent analysis of Nanog using anti-Nanog polyclonal antibody (Product # PA1-097) shows nuclear localization in the human embryonic stem cell line H9. Nanog staining (red) and an overlay image of Nanog with DAPI (pink) is shown. H9 cells were grown on matrigel coated chamber slides, fixed with formaldehyde and permeabilized with 0.1% Triton X-100 in TBS for 15 minutes at room temperature. The cells were probed with a rabbit polyclonal antibody recognizing Nanog (Product # PA1-097) at a dilution of 1:100 overnight at 4 °C, washed with PBS and incubated with a FITC-conjugated secondary antibody at a dilution of 1:100 for 60 minutes at room temperature. Images were taken on at 20X magnification.
- Submitted by
- Invitrogen Antibodies (provider)
- Main image

- Experimental details
- Immunofluorescent analysis of Nanog using anti-Nanog polyclonal antibody (Product # PA1-097) shows specific expression in human embryonal carcinoma NTERA-2 cells (shown in green) but not in negative control HeLa cells. Formalin fixed cells were permeabilized with 0.1% Triton X-100 in TBS for 10 minutes at room temperature. Cells were blocked with 1% Blocker BSA (Product # 37525) for 15 minutes at room temperature. Cells were probed with a rabbit polyclonal antibody recognizing Nanog (Product # PA1-097), at a dilution of 1:200 for at least 1 hour at room temperature. Cells were washed with PBS and incubated with DyLight 488 goat-anti-rabbit IgG secondary antibody (Product # 35552) at a dilution of 1:400 for 30 minutes at room temperature. F-Actin (red) was stained with DY-547 phalloidin, nuclei (blue) were stained with Hoechst 33342 dye (Product # 62249). Images were taken on a Thermo Scientific ArrayScan at 20X magnification.
- Submitted by
- Invitrogen Antibodies (provider)
- Main image
- Experimental details
- Immunofluorescence analysis of Nanog was performed using 70% confluent log phase NTERA-2 cells. The cells were fixed with 4% paraformaldehyde for 10 minutes, permeabilized with 0.1% Triton™ X-100 for 15 minutes, and blocked with 1% BSA for 1 hour at room temperature. The cells were labeled with Nanog Rabbit Polyclonal Antibody (Product # PA1-097X) at 5 µg/mL in 0.1% BSA, incubated at 4 degree Celsius overnight and then labeled with Goat anti-Rabbit IgG (Heavy Chain) Superclonal™ Secondary Antibody, Alexa Fluor® 488 conjugate (Product # A27034) at a dilution of 1:2000 for 45 minutes at room temperature (Panel a: green). Nuclei (Panel b: blue) were stained with ProLong™ Diamond Antifade Mountant with DAPI (Product # P36962). F-actin (Panel c: red) was stained with Rhodamine Phalloidin (Product # R415, 1:300). Panel d represents the merged image showing nuclear localization. Panel e shows Nanog negative cell line HeLa with no signal. Panel f represents control cells with no primary to assess background. The images were captured at 60X magnification.
Supportive validation
- Submitted by
- Invitrogen Antibodies (provider)
- Main image
- Experimental details
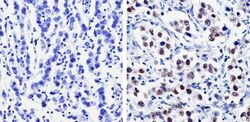
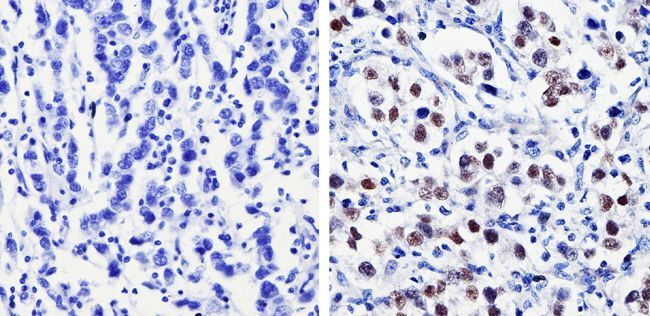
- Immunohistochemistry analysis of Nanog showing staining in the nucleus of paraffin-treated human testicular carcinoma (right) compared with a negative control in the absence of primary antibody (left). To expose target proteins, antigen retrieval was performed using 10mM sodium citrate (pH 6.0), microwaved for 8-15 min. Following antigen retrieval, tissues were blocked in 3% H2O2-methanol for 15 min at room temperature, washed with ddH2O and PBS, and then probed with a Nanog polyclonal antibody (Product # PA1-097) diluted by 3% BSA-PBS at a dilution of 1:500 overnight at 4°C in a humidified chamber. Tissues were washed extensively in PBST and detection was performed using an HRP-conjugated secondary antibody followed by colorimetric detection using a DAB kit. Tissues were counterstained with hematoxylin and dehydrated with ethanol and xylene to prep for mounting.
Supportive validation
- Submitted by
- Invitrogen Antibodies (provider)
- Main image
- Experimental details
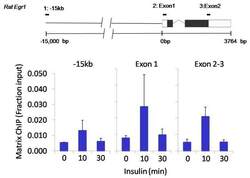
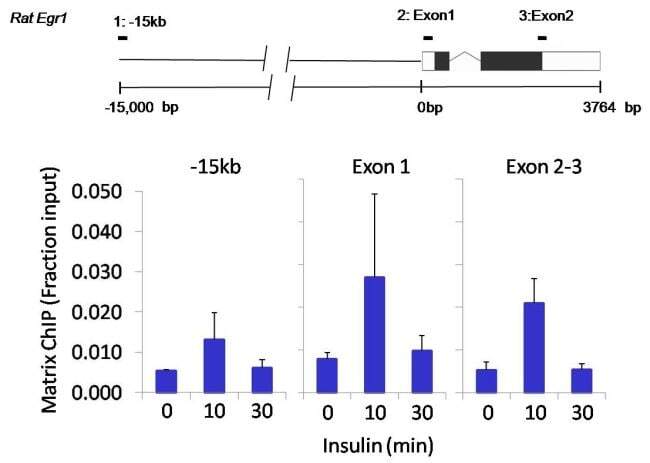
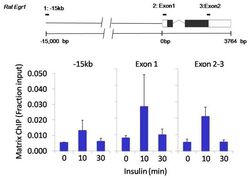
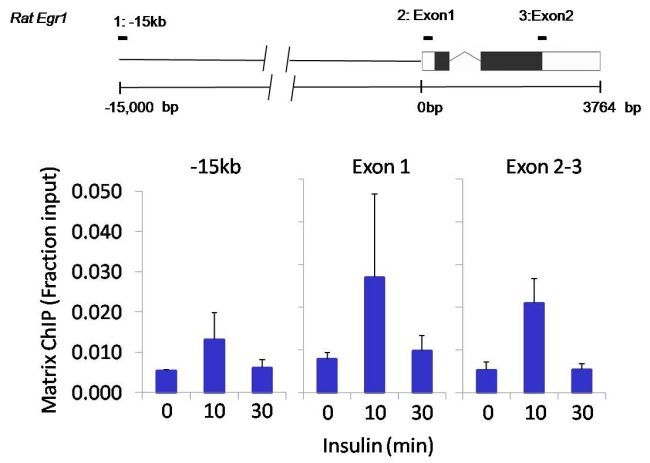
- Chromatin immunoprecipitation analysis of Nanog was performed using cross-linked chromatin from 1x10^6 HTC-IR rat hepatoma cells treated with insulin for 0, 10, and 30 minutes. Immunoprecipitation was performed using a multiplex microplate Matrix ChIP assay (see reference for Matrix ChIP protocol: http://www.ncbi.nlm.nih.gov/pubmed/22098709) with 1.0 µL/100 µL well volume of a Nanog polyclonal antibody (Product # PA1-097). Chromatin aliquots from ~1x10^5 cells were used per ChIP pull-down. Quantitative PCR data were done in quadruplicate using 1 µL of eluted DNA in 2 µL SYBR real-time PCR reactions containing primers to amplify -15kb upstream of the Egr1 gene or exon-1 or exon-2-3 of Egr1. PCR calibration curves were generated for each primer pair from a dilution series of sheared total genomic DNA. Quantitation of immunoprecipitated chromatin is presented as signal relative to the total amount of input chromatin. Results represent the mean +/- SEM for three experiments. A schematic representation of the rat Egr-1 locus is shown above the data where boxes represent exons (black boxes = translated regions, white boxes = untranslated regions), the zigzag line represents an intron, and the straight line represents upstream sequence. Regions amplified by Egr-1 primers are represented by black bars. Data courtesy of the Innovators Program.
- Submitted by
- Invitrogen Antibodies (provider)
- Main image
- Experimental details
- Chromatin immunoprecipitation analysis of Nanog was performed using cross-linked chromatin from 1x10^6 HTC-IR rat hepatoma cells treated with insulin for 0, 10, and 30 minutes. Immunoprecipitation was performed using a multiplex microplate Matrix ChIP assay (see reference for Matrix ChIP protocol: http://www.ncbi.nlm.nih.gov/pubmed/22098709) with 1.0 µL/100 µL well volume of a Nanog polyclonal antibody (Product # PA1-097). Chromatin aliquots from ~1x10^5 cells were used per ChIP pull-down. Quantitative PCR data were done in quadruplicate using 1 µL of eluted DNA in 2 µL SYBR real-time PCR reactions containing primers to amplify -15kb upstream of the Egr1 gene or exon-1 or exon-2-3 of Egr1. PCR calibration curves were generated for each primer pair from a dilution series of sheared total genomic DNA. Quantitation of immunoprecipitated chromatin is presented as signal relative to the total amount of input chromatin. Results represent the mean +/- SEM for three experiments. A schematic representation of the rat Egr-1 locus is shown above the data where boxes represent exons (black boxes = translated regions, white boxes = untranslated regions), the zigzag line represents an intron, and the straight line represents upstream sequence. Regions amplified by Egr-1 primers are represented by black bars. Data courtesy of the Innovators Program.
Supportive validation
- Submitted by
- Invitrogen Antibodies (provider)
- Main image
- Experimental details
- NULL
- Submitted by
- Invitrogen Antibodies (provider)
- Main image
- Experimental details
- NULL
- Submitted by
- Invitrogen Antibodies (provider)
- Main image

- Experimental details
- NULL
- Submitted by
- Invitrogen Antibodies (provider)
- Main image

- Experimental details
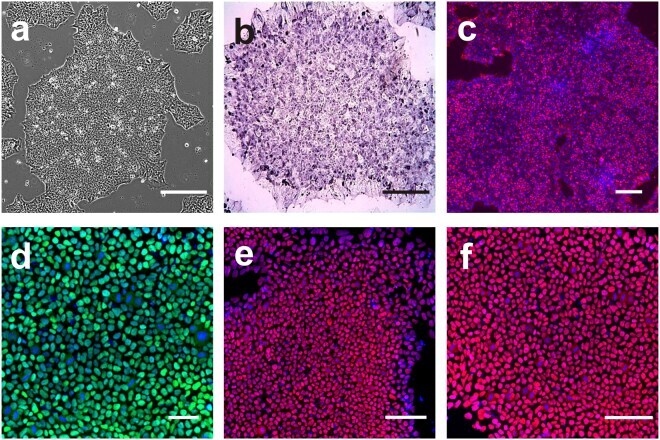
- Figure 4 ( a ) nDPSC derived hiPSC. Image of nDPSC derived hiPSC with typical hES like morphology. ( b ) Colorimetric detection of alkaline phosphatase. ( c - f ) Immunocytochemistry against ( c ) SSEA-4, ( d ) POU5F1, ( e ) SOX2, and ( f ) NANOG. Nuclei were counterstained with DAPI. Images are shown as overlap of the two channels ( c - f ). Scale bar = 200 um.
- Submitted by
- Invitrogen Antibodies (provider)
- Main image
- Experimental details
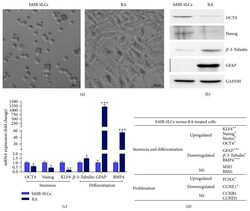
- Figure 2 Morphology and characteristics of hMB-SLCs. (a) hMB-SLCs were cultured for 48 h in the absence or in the presence of 8 mu M RA which induces SLCs differentiation, highlighted by morphological changes and cell adhesion. (b) Western blot analysis confirmed that 48 h exposure of hMB-SLCs to 8 mu M RA induced a strong reduction in the stemness markers Nanog and OCT4 while increasing the differentiation markers, beta -3-Tubulin and GFAP. (c) qPCR analysis of OCT4 , Nanog , KLF4 , beta-3-Tubulin , GFAP, and BMP4 was conducted before and after RA treatment. mRNA expression levels are indicated as fold changes with respect to hMB-SLCs. (d) Gene expression of stemness, differentiation, and proliferation markers in hMB-SLCs with respect to RA-treated cells. * denotes p < 0.05 versus hMB-SLCs, ** denotes p < 0.01 versus hMB-SLCs, and *** denotes p < 0.001 versus hMB-SLCs.

- Submitted by
- Invitrogen Antibodies (provider)
- Main image
- Experimental details
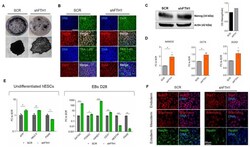
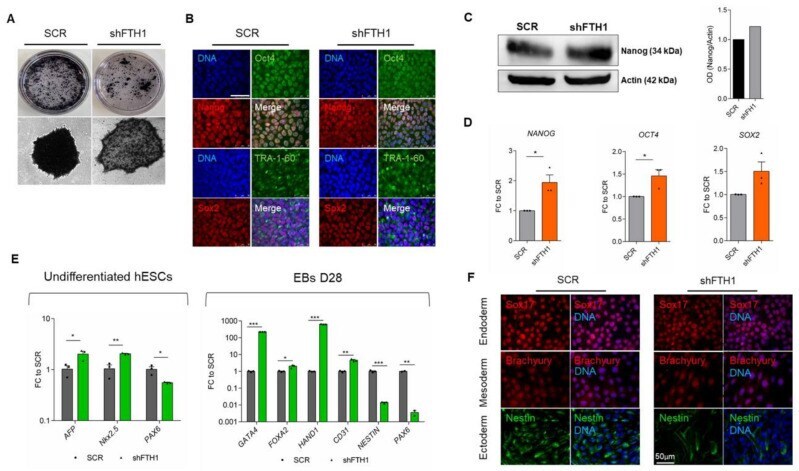
- Figure 1 FTH1 silencing influences hESCs pluripotency. ( A ) Alkaline phosphatase (AP) staining of colonies in SCR control and in hESCs transfected with lentiviral shFTH1 shows that FTH1-silenced ES colonies contain less AP+ cells; scale bar, 250 um; ( B ) Undifferentiated SCR and FTH1-KD hESCs were stained for Oct4 (green), Nanog (red), TRA-1-60 (green), and Sox2 (red) expression, while nuclei were counterstained with 4'.6-diamidino-2-phenylindole (DAPI). Scale bars, 50 mum. No significant differences were detected between the two groups with the exception of Nanog, which shows a slight positivity in FTH1-silenced cells; ( C ) The levels of Nanog protein were assessed by immunoblotting (IB). Band intensity analysis shows a higher level in FTH1-KD cells compared to SCR control. Actin levels were evaluated to confirm equal loading control; ( D ) mRNA levels of pluripotency-associated genes NANOG , OCT4 , and SOX2 were measured in undifferentiated SCR and FTH1-KD hESCs via qRT-PCR; ( E ) left panel: mRNA levels of endodermal ( AFP ), mesodermal ( Nkx2.5 ), and ectodermal ( PAX6 ) genes were measured in undifferentiated SCR and FTH1-silenced hESCs via qRT-PCR analysis; AFP and Nkx2.5 expression levels were higher in shFTH1 cells, while the expression levels of PAX6 were significantly diminished in silenced cells; ( E ) right panel: mRNA levels of endodermal ( GATA4 , FOXA2) , mesodermal ( HAND1 , CD31 ), and ectodermal ( NESTIN , PAX6 ) genes were measured in SCR and FTH1-KD emb
- Submitted by
- Invitrogen Antibodies (provider)
- Main image
- Experimental details
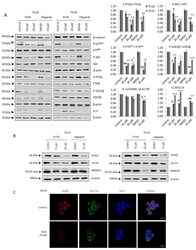
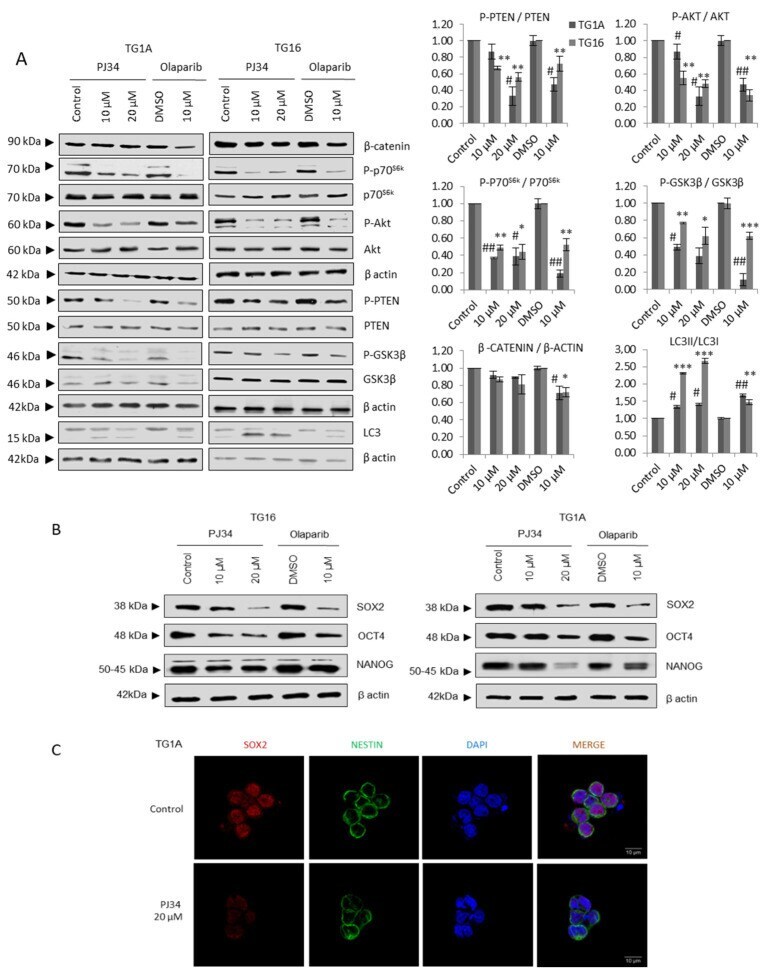
- Figure 1 PARP inhibition compromises glioma stem-like phenotype. ( A ) Immunoblots (IB) and graphical representation for the indicated proteins in TG1A and TG16 Glioma Initiating Cells treated with PARP inhibitors PJ34 or Olaparib for one week. ( B ) IB of SOX2, NANOG and OCT4 in TG1A and TG16 cells treated with PJ34 for one week. Full Western Blot images can be found in Figure S8 . ( C ) Immunofluorescence (IF) of SOX2 (red) and NESTIN (green) in TG1A cells treated with PJ34 for one week; at least 10 fields of view per condition and replicate were analyzed and quantified. Data are representative of 3 independent experiments. Values are mean +- SEM. * p < 0.05, ** p < 0.01, *** p < 0.001 referred to TG16 and # p < 0.05, ## p < 0.01 referred to TG1A. Student's t test.
- Submitted by
- Invitrogen Antibodies (provider)
- Main image
- Experimental details
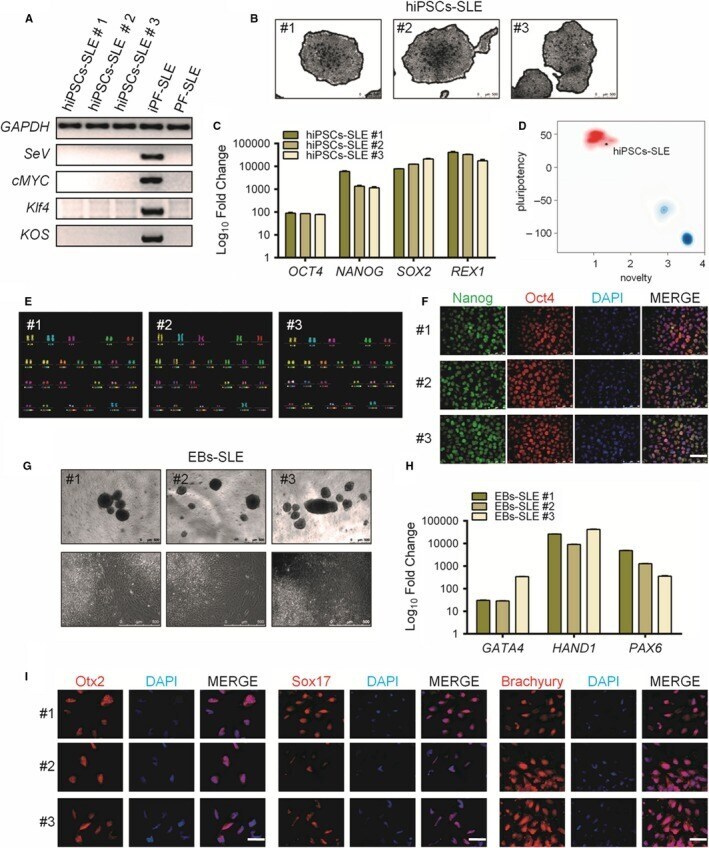
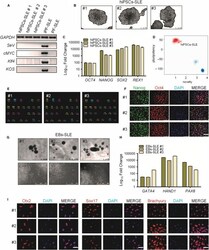
- Figure 1 Generation and characterization of systemic lupus erythematosus (SLE)-specific human-induced pluripotent stem cells (hiPSCs). (A) Dermal fibroblasts derived from patient with SLE were reprogrammed into iPSCs using Sendai virus vectors and three clones (#1, #2 and #3) were characterized. RT-PCR confirms the loss of transgenes in hiPSCs-SLE (lanes 1, 2 and 3), presence (lane 4) in infected fibroblasts (ipF-SLE) and absence of Sendai viral transgenes in parental fibroblasts (pF-SLE) (lane 5). Full-length gels are presented in File S2 . (B) The hiPSCs-SLE colonies expressed alkaline phosphatase. Scale bar, 500 mum. (C) RT-qPCR analysis of pluripotency genes OCT4 , NANOG , SOX2 and REX1 was performed in fibroblasts and in hiPSCs derived from patient with SLE. All expression values are normalized to GAPDH and relative donor fibroblasts. Data are mean +- SEM and all statistical analysis was made between hiPSCs-SLE clones and relative fibroblasts by Student's t test showing P -values