 Explore
 Validate
 Learn
Learn Western blot
 Immunocytochemistry
 Immunoprecipitation
Antibody data
- Antibody Data
- Antigen structure
- References [6]
- Comments [0]
- Validations
- Immunocytochemistry [2]
- Flow cytometry [1]
- Other assay [10]
Submit
Validation data
Reference
Comment
Report error
- Product number
- 38-6000 - Provider product page

- Provider
- Invitrogen Antibodies
- Product name
- BMPR1A Polyclonal Antibody
- Antibody type
- Polyclonal
- Antigen
- Synthetic peptide
- Reactivity
- Human, Mouse, Rat
- Host
- Rabbit
- Isotype
- IgG
- Vial size
- 100 μg
- Concentration
- 0.25 mg/mL
- Storage
- -20°C
Submitted references PP2A phosphatase inhibition is anti-fibrotic through Ser77 phosphorylation-mediated ARNT/ARNT homodimer formation.
Galectin-3 modulates postnatal subventricular zone gliogenesis.
Homozygous missense variant in BMPR1A resulting in BMPR signaling disruption and syndromic features.
BMP-IHH-mediated interplay between mesenchymal stem cells and osteoclasts supports calvarial bone homeostasis and repair.
S113R mutation in SLC33A1 leads to neurodegeneration and augmented BMP signaling in a mouse model.
Reestablishment of Energy Balance in a Male Mouse Model With POMC Neuron Deletion of BMPR1A.
Nyamsuren G, Rapp G, Dihazi H, Zeisberg EM, Tampe D, Tampe B, Zeisberg M
Scientific reports 2021 Dec 15;11(1):24075
Scientific reports 2021 Dec 15;11(1):24075
Galectin-3 modulates postnatal subventricular zone gliogenesis.
Al-Dalahmah O, Campos Soares L, Nicholson J, Draijer S, Mundim M, Lu VM, Sun B, Tyler T, Adorján I, O'Neill E, Szele FG
Glia 2020 Feb;68(2):435-450
Glia 2020 Feb;68(2):435-450
Homozygous missense variant in BMPR1A resulting in BMPR signaling disruption and syndromic features.
Russell BE, Rigueur D, Weaver KN, Sund K, Basil JS, Hufnagel RB, Prows CA, Oestreich A, Al-Gazali L, Hopkin RJ, Saal HM, Lyons K, Dauber A
Molecular genetics & genomic medicine 2019 Nov;7(11):e969
Molecular genetics & genomic medicine 2019 Nov;7(11):e969
BMP-IHH-mediated interplay between mesenchymal stem cells and osteoclasts supports calvarial bone homeostasis and repair.
Guo Y, Yuan Y, Wu L, Ho TV, Jing J, Sugii H, Li J, Han X, Feng J, Guo C, Chai Y
Bone research 2018;6:30
Bone research 2018;6:30
S113R mutation in SLC33A1 leads to neurodegeneration and augmented BMP signaling in a mouse model.
Liu P, Jiang B, Ma J, Lin P, Zhang Y, Shao C, Sun W, Gong Y
Disease models & mechanisms 2017 Jan 1;10(1):53-62
Disease models & mechanisms 2017 Jan 1;10(1):53-62
Reestablishment of Energy Balance in a Male Mouse Model With POMC Neuron Deletion of BMPR1A.
Townsend KL, Madden CJ, Blaszkiewicz M, McDougall L, Tupone D, Lynes MD, Mishina Y, Yu P, Morrison SF, Tseng YH
Endocrinology 2017 Dec 1;158(12):4233-4245
Endocrinology 2017 Dec 1;158(12):4233-4245
No comments: Submit comment
Supportive validation
- Submitted by
- Invitrogen Antibodies (provider)
- Main image

- Experimental details
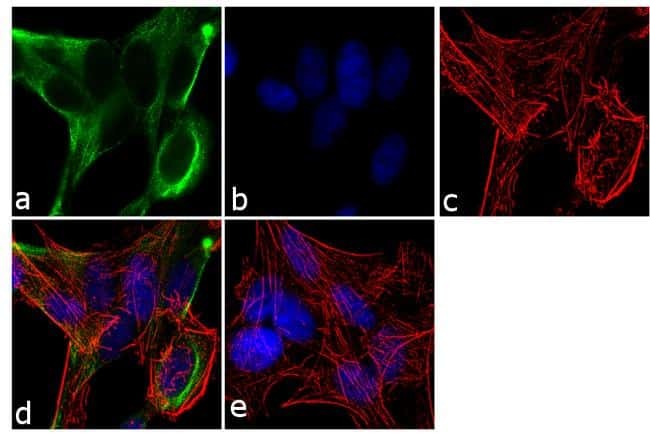
- Immunofluorescent analysis of BMPR1A /CD292 was performed using 70% confluent log phase SH-SY5Y cells. The cells were fixed with 4% paraformaldehyde for 10 minutes, permeabilized with 0.1% Triton™ X-100 for 10 minutes, and blocked with 1% BSA for 1 hour at room temperature. The cells were labeled with BMPR1A /CD292 Rabbit Polyclonal Antibody (Product # 38-6000) at 2 µg/mL in 0.1% BSA and incubated for 3 hours at room temperature and then labeled with Goat anti-Rabbit IgG (H+L) Superclonal™ Secondary Antibody, Alexa Fluor® 488 conjugate (Product # A27034) a dilution of 1:2000 for 45 minutes at room temperature (Panel a: green). Nuclei (Panel b: blue) were stained with SlowFade® Gold Antifade Mountant with DAPI (Product # S36938). F-actin (Panel c: red) was stained with Alexa Fluor® 555 Rhodamine Phalloidin (Product # R415, 1:300). Panel d represents the merged image showing cytoplasmic localization. Panel e shows the no primary antibody control. The images were captured at 60X magnification.
- Submitted by
- Invitrogen Antibodies (provider)
- Main image

- Experimental details
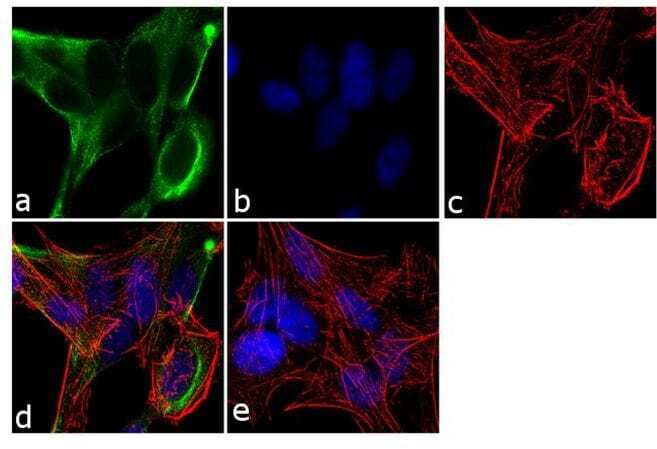
- Immunofluorescent analysis of BMPR1A /CD292 was performed using 70% confluent log phase SH-SY5Y cells. The cells were fixed with 4% paraformaldehyde for 10 minutes, permeabilized with 0.1% Triton™ X-100 for 10 minutes, and blocked with 1% BSA for 1 hour at room temperature. The cells were labeled with BMPR1A /CD292 Rabbit Polyclonal Antibody (Product # 38-6000) at 2 µg/mL in 0.1% BSA and incubated for 3 hours at room temperature and then labeled with Goat anti-Rabbit IgG (Heavy Chain) Superclonal™ Secondary Antibody, Alexa Fluor® 488 conjugate (Product # A27034) a dilution of 1:2000 for 45 minutes at room temperature (Panel a: green). Nuclei (Panel b: blue) were stained with SlowFade® Gold Antifade Mountant with DAPI (Product # S36938). F-actin (Panel c: red) was stained with Alexa Fluor® 555 Rhodamine Phalloidin (Product # R415, 1:300). Panel d represents the merged image showing cytoplasmic localization. Panel e shows the no primary antibody control. The images were captured at 60X magnification.
Supportive validation
- Submitted by
- Invitrogen Antibodies (provider)
- Main image
- Experimental details
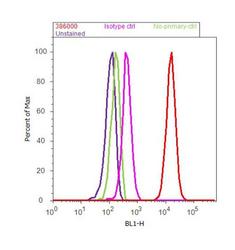
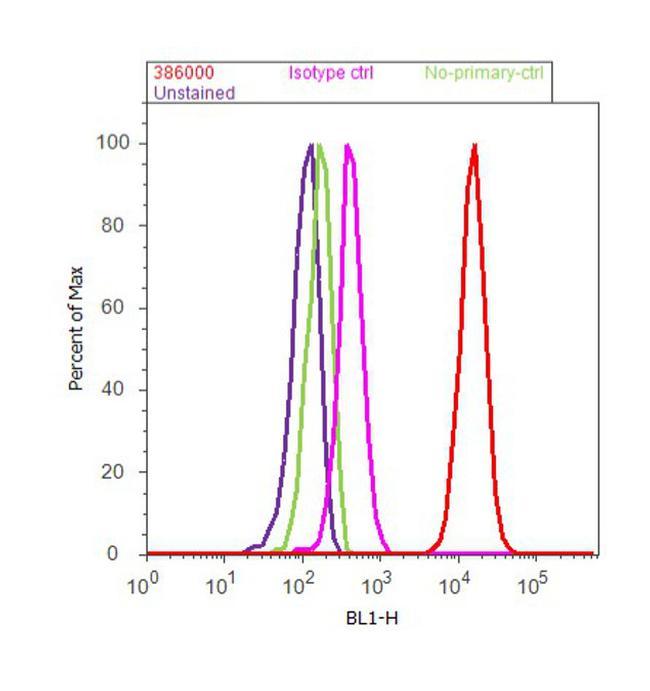
- Flow cytometry analysis of BMPR1A / CD292 was done on SH-SY5Y cells. Cells were fixed with 70% ethanol for 10 minutes, permeabilized with 0.25% Triton™ X-100 for 20 minutes, and blocked with 5% BSA for 30 minutes at room temperature. Cells were labeled with BMPR1A / CD292 Rabbit Polyclonal Antibody (38-6000, red histogram) or with rabbit isotype control (pink histogram) at 3-5 ug/million cells in 2.5% BSA. After incubation at room temperature for 2 hours, the cells were labeled with Alexa Fluor® 488 Goat Anti-Rabbit Secondary Antibody (A11008) at a dilution of 1:400 for 30 minutes at room temperature. The representative 10, 000 cells were acquired and analyzed for each sample using an Attune® Acoustic Focusing Cytometer. The purple histogram represents unstained control cells and the green histogram represents no-primary-antibody control.
Supportive validation
- Submitted by
- Invitrogen Antibodies (provider)
- Main image
- Experimental details
- NULL
- Submitted by
- Invitrogen Antibodies (provider)
- Main image
- Experimental details
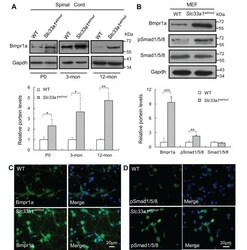
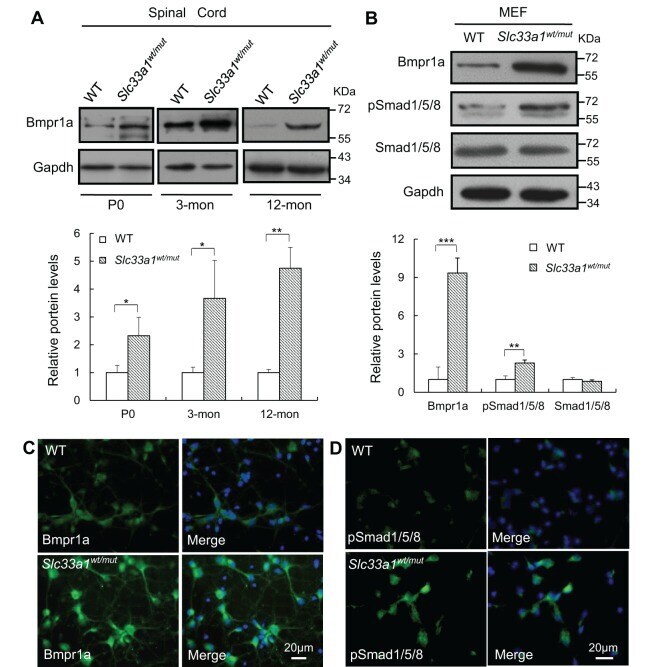
- Fig. 4. Upregulated BMP signaling in Slc33a1 wt/mut mice. (A) Western blotting showed increased level of Bmpr1a in the spinal cord of Slc33a1 wt/mut mice compared with WT littermates at P0, 3 months and 12 months old. The levels of Bmpr1a were quantified by densitometric analysis. n =6 mice each for experimental condition. (B) Western blotting showed increased level of Bmpr1a and pSmad1/5/8 in mouse embryonic fibroblasts (MEFs) of Slc33a1 wt/mut mice compared with WT. The levels of Bmpr1a, pSmad1/5/8, and Smad1/5/8 were quantified by densitometric analysis. Data from three independent experiments. (C,D) Immunofluorescence staining of Bmpr1a (C) and pSmad1/5/8 (D) in primary cortical neurons from Slc33a1 wt/mut mice compared with WT littermates. Data presented as mean+-s.d.; * P
- Submitted by
- Invitrogen Antibodies (provider)
- Main image
- Experimental details
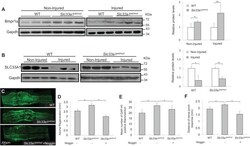
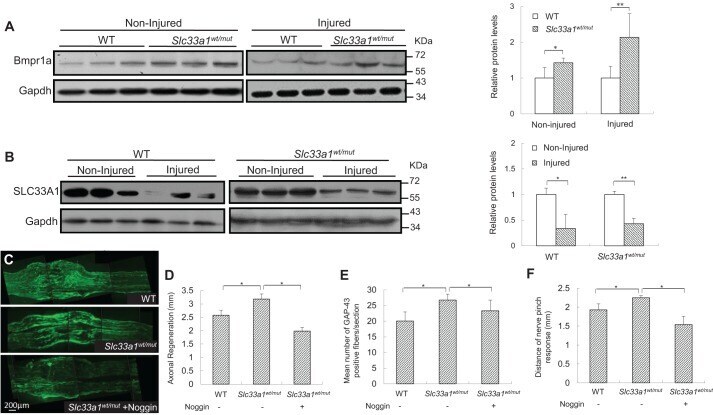
- Fig. 6. Inhibition of BMP signaling with noggin attenuated accelerated injury-induced axonal regeneration in Slc33a1 wt/mut mice. (A) Left panels: western blotting showed increased level of Bmpr1a in the sciatic nerve in Slc33a1 wt/mut mice compared with WT littermates. Each lane corresponds to a different animal. n =6 mice for each experimental condition. Right panel: levels of Bmpr1a were quantified by densitometric analysis. (B) Left panels: western blotting showed decreased level of SLC33A1 in the sciatic nerve following a crush injury compared with non-injured controls. Each lane corresponds to a different animal. Right panel: levels of SLC33A1 were quantified by densitometric analysis. n =6 mice for each experimental condition. (C) Immunofluorescence staining of GAP43 showing accelerated axonal growth at day 2 following sciatic nerve crush in Slc33a1 wt/mut mice compared with WT littermates. Noggin injection attenuated the acceleration in Slc33a1 wt/mut mice. (D) Quantification of the distances of axon regrowth of sciatic nerve following a crush injury as determined by GAP43 staining. n =6 mice for each experimental condition. (E) Quantification of the numbers of GAP43-positive fibers 1.5 mm distal to the crush site. n =6 mice each for experimental condition. (F) Functional regeneration assessed using the pinch test showed increased regeneration at day 2 post-injury in Slc33a1 wt/mut mice compared with WT littermates. Noggin injection attenuated the acceleration in Slc3
- Submitted by
- Invitrogen Antibodies (provider)
- Main image
- Experimental details
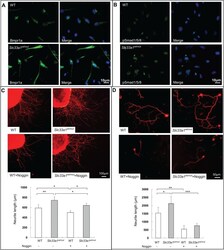
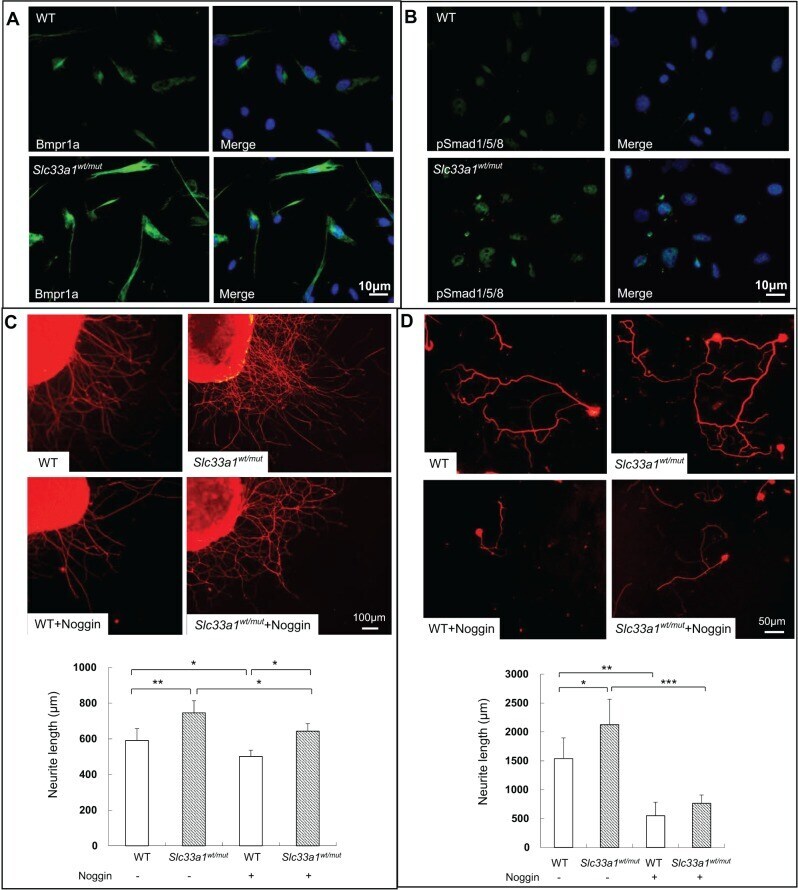
- Fig. 7. Inhibition of BMP signaling with noggin attenuated hereditary spastic paraplegia in DRG from Slc33a1 wt/mut mice. (A,B) Immunofluorescence staining of Bmpr1a (A) and pSmad1/5/8 (B) in DRG neurons from Slc33a1 wt/mut mice compared with WT littermates. (C) Upper panels: immunofluorescence staining of beta-tubulin III in whole DRG explants from Slc33a1 wt/mut and WT littermates after 48 h in culture. Noggin attenuated the accelerated neurite formation in DRG explants from Slc33a1 wt/mut mice. Lower panel: quantification of the neurite length of DRG. n =6 mice each experimental condition. (D) Upper panels: immunofluorescence staining of beta-tubulin III in DRG neurons from Slc33a1 wt/mut and WT littermates after 48 h in culture. Noggin attenuated the accelerated neurite growth in DRG neurons from Slc33a1 wt/mut mice. Lower panel: quantification of the neurite length of DRG. n =6 mice each experimental condition. Data presented as mean+-s.d.; * P
- Submitted by
- Invitrogen Antibodies (provider)
- Main image

- Experimental details
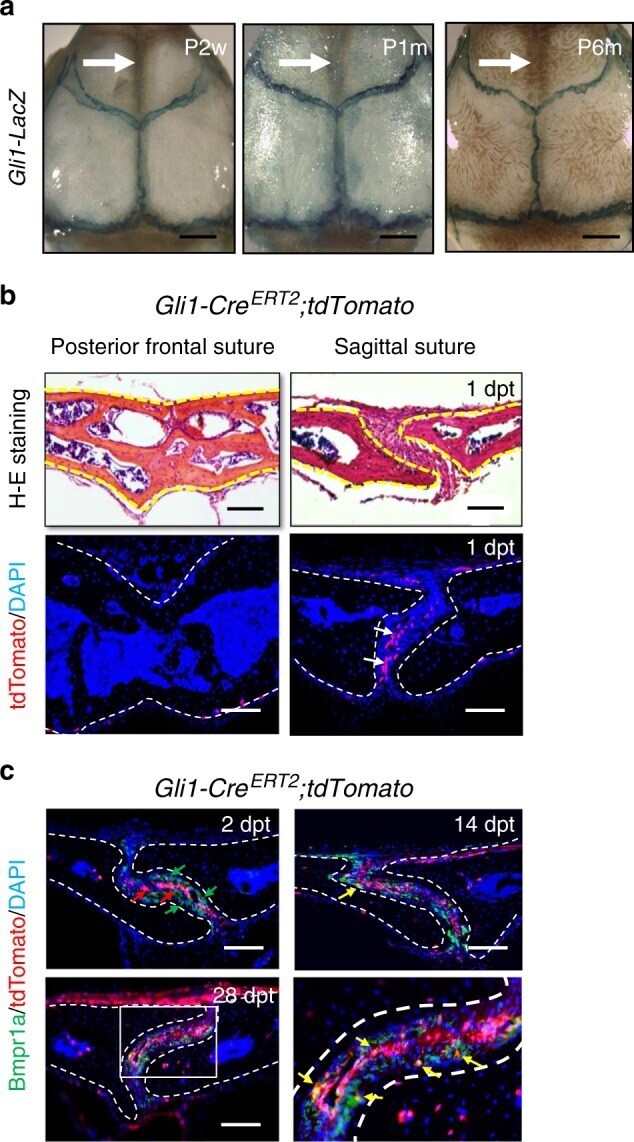
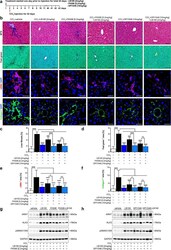
- Fig. 1 BMP signalling in Gli1+ lineage-derived osteoprogenitors in adult sutures. a Whole-mount LacZ staining (blue) of calvarial bones from Gli1-LacZ mice at postnatal 2 weeks (P2w), 1 month (P1m), and 6 months (P6m). The arrows indicate the posterior frontal suture. b H-E staining and tdTomato (red) visualisation of the posterior frontal suture and sagittal suture of Gli1-Cre ERT2 ;tdTomato mice 1 day post induction with tamoxifen (1dpt). Arrows indicate Gli1+ cells. c Bmpr1a immunostaining (green) and tdTomato visualisation (red) of the sagittal suture mesenchyme of Gli1-Cre ERT2 ;tdTomato mice 2 days (2 dpt), 14 days (14 dpt), and 28 days (28 dpt) post induction. Red arrows indicate Gli1+ cells; green arrows indicate Bmpr1a+ cells; yellow arrows indicate co-localization. The boxed area is shown at higher magnification to the right. Broken lines indicate the outline of the suture. Scale bars in a , 1 mm; b and c , 100 um
- Submitted by
- Invitrogen Antibodies (provider)
- Main image

- Experimental details
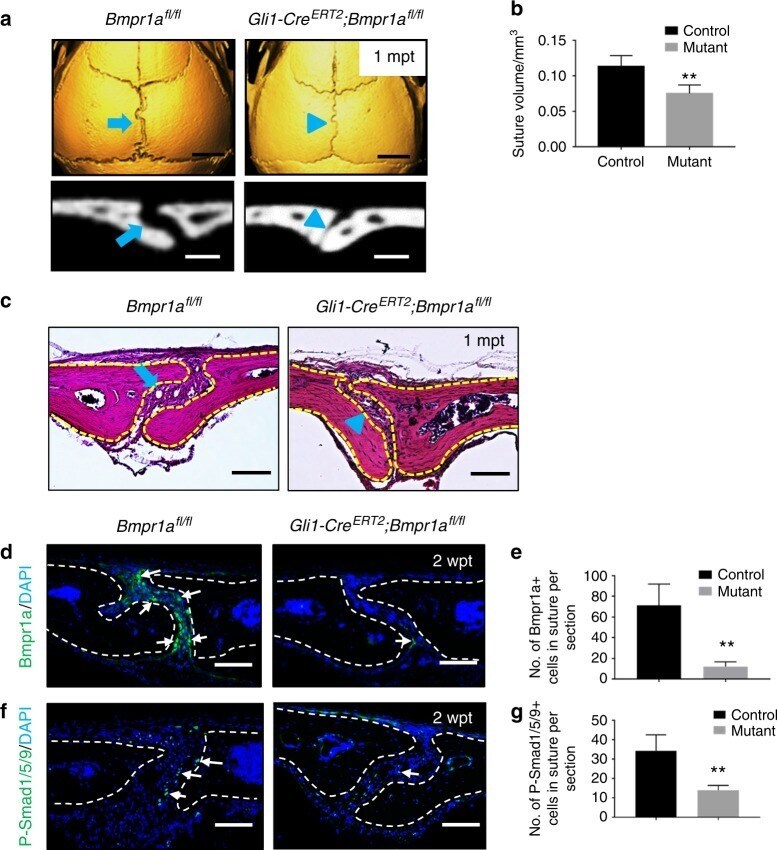
- Fig. 2 Loss of Bmpr1a in Gli1+ lineage-derived cells results in a narrower suture gap. a MicroCT scans of sagittal sutures from Bmpr1a fl/fl (control) and Gli1-Cre ERT2 ; Bmpr1a fl/fl (mutant) mice 1 month post tamoxifen induction (1mpt). Coronal sections of the sagittal suture are shown in the bottom panels. b Quantitation of the volume of sagittal sutures from six independent Bmpr1a fl/fl (control) and Gli1-Cre ERT2 ;Bmpr1a fl/fl (mutant) mice. c H-E staining of sagittal sutures from Bmpr1a fl/fl and Gli1-Cre ERT2 ;Bmpr1a fl/fl mice 1 month post tamoxifen induction (1mpt). The blue arrows in a and c indicate normal morphology of sagittal sutures from control mice; blue arrowheads in a and c indicate the narrower suture gap observed in mutant mice. d Immunostaining of Bmpr1a (green, indicated by arrows) in the suture mesenchyme of Bmpr1a fl/fl (control) and Gli1-Cre ERT2 ;Bmpr1a fl/fl (mutant) mice 2 weeks post induction (2wpt). e Quantitation of Bmpr1a+ cells per section from three independent samples. f Immunostaining of P-Smad1/5/9 (green, indicated by arrows) in the suture mesenchyme of Bmpr1a fl/fl (control) and Gli1-Cre ERT2 ;Bmpr1a fl/fl (mutant) mice 2 weeks after induction (2wpt). g Quantitation of P-Smad1/5/9+ cells per section from three independent samples. T tests were performed. ** P < 0.01. Broken lines indicate the outline of the suture. Scale bars in a (top panels), 2 mm; a (bottom panels), 200 um; c , d , and f , 100 um
- Submitted by
- Invitrogen Antibodies (provider)
- Main image
- Experimental details
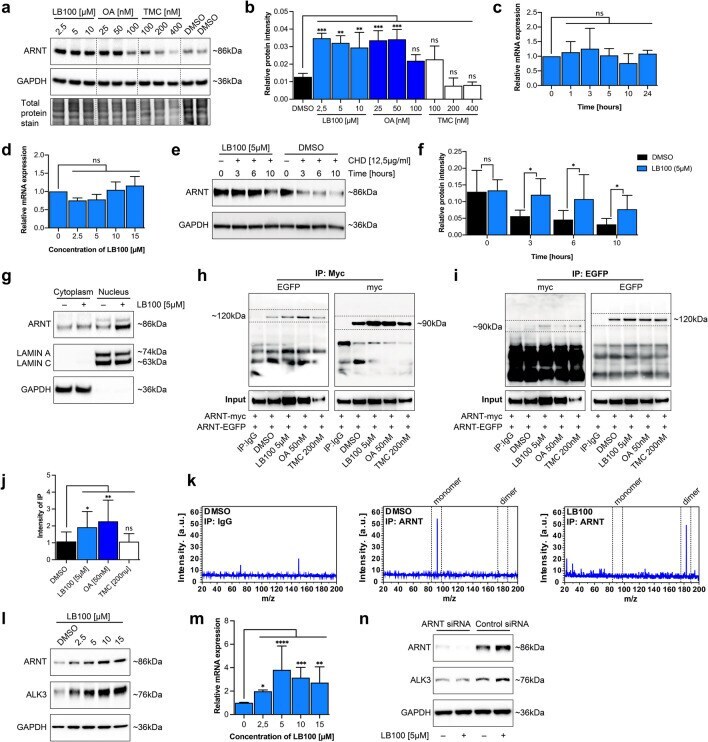
- Figure 1 PP2A inhibitor LB100 enhances ARNT homodimer formation. ( a ) ARNT protein level in MCT cells indicated different concentrations following treatment with LB100, OA and TMC relative to control DMSO treated cells. Cells were treated with each phosphatase inhibitor for 3 h. For immunoblotting analysis, GAPDH and total protein stain were used as a loading control. ( b ) Quantification of relative ARNT protein intensity display as graph after normalization of total protein stain. The average mean of the results was obtained from three independent experimental replicates. *p < 0.05; **p < 0.01; ***p < 0.001, 1-way ANOVA versus DMSO treated control cells. Data are shown as mean +- SD. ( c ) Relative expression level of ARNT in MCT cells is determined by qRT-PCR after 5 uM of LB100 treatment at indicated time points. Relative mRNA levels were determined after normalization to GAPDH , and data are shown as the fold change compared with DMSO treated control cells. The average mean of the results was obtained from three independent experimental replicates. *p < 0.05, 1-way ANOVA versus DMSO treated control cells. ( d ) qRT-PCR was used to determine the mRNA level of ARNT in various concentrations of LB100 treatment for 4 h. Relative mRNA levels were determined after normalization to GAPDH , and data are shown as the fold change compared with DMSO treated control cells. The average mean of the results was obtained from three independent experimental replicates. *p < 0.05, 1-way
- Submitted by
- Invitrogen Antibodies (provider)
- Main image
- Experimental details
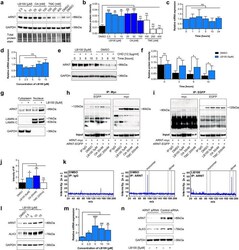
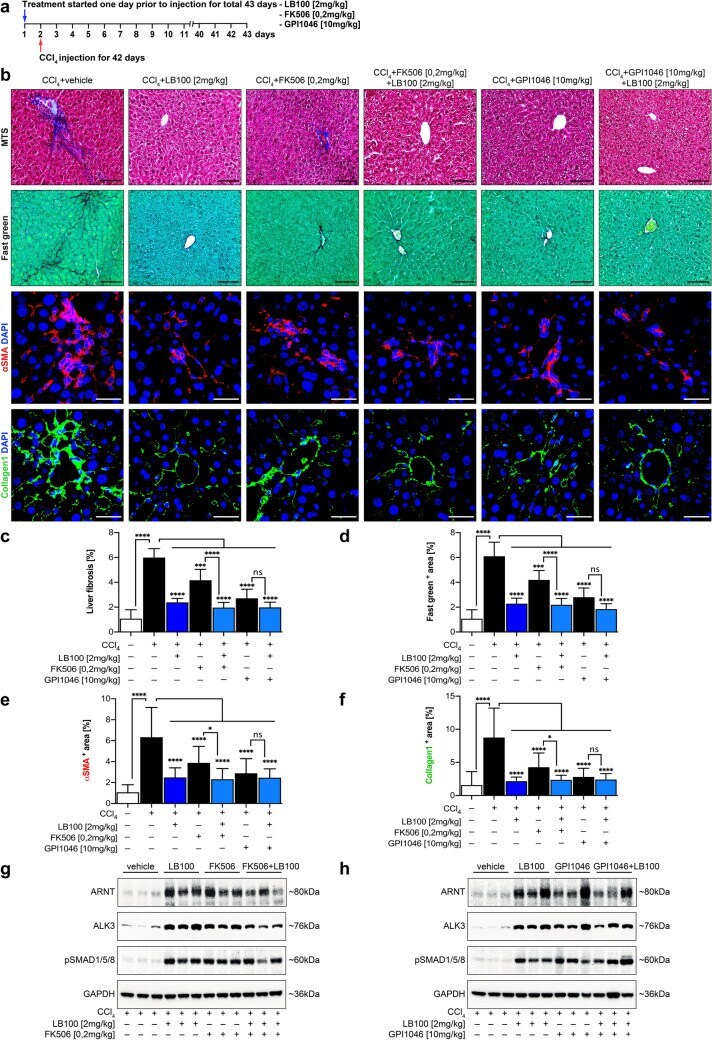
- Figure 5 LB100 protects experimental liver injury via the activation of ARNT/ALK3 signaling axis and improves the hepatoprotective role of FK506/GPI1046. ( a ) Mice were received CCl 4 for 42 days. One day before CCl 4 injection, mice were treated with vehicle buffer (5% glucose), LB100 (2 mg/kg subcutaneously per day), FK506 (0.2 mg/kg orally per day), GPI1046 (10 mg/kg subcutaneously per day) or indicated combinations simultaneously for 43 days. ( b ) Representative microscopy images of MTS (top), Fast green (middle), alphaSMA (middle) and Collagen1 (bottom) stained sections of CCl 4 induced liver fibrotic mice from each group. n = 6/group. Scale bars: 25 um (MTS, Fast green); 15 um (alphaSMA, Collagen1). ( c - f ) Quantitative analysis of the fibrotic area in the liver section from the indicated experimental group. *p < 0.05; **p < 0.01; ***p < 0.001; ****p < 0.0001, 1-way ANOVA. Data are shown as mean +- SD. ( g , h ) Representative immunoblotting analysis showing the expression level of ARNT, ALK3 and pSmad1/5/8 protein in fibrotic mice liver in each experimental group. Increased activation of ALK3 signaling was observed in the treated groups. For immunoblotting analysis, GAPDH was used as a loading control.
- Submitted by
- Invitrogen Antibodies (provider)
- Main image

- Experimental details
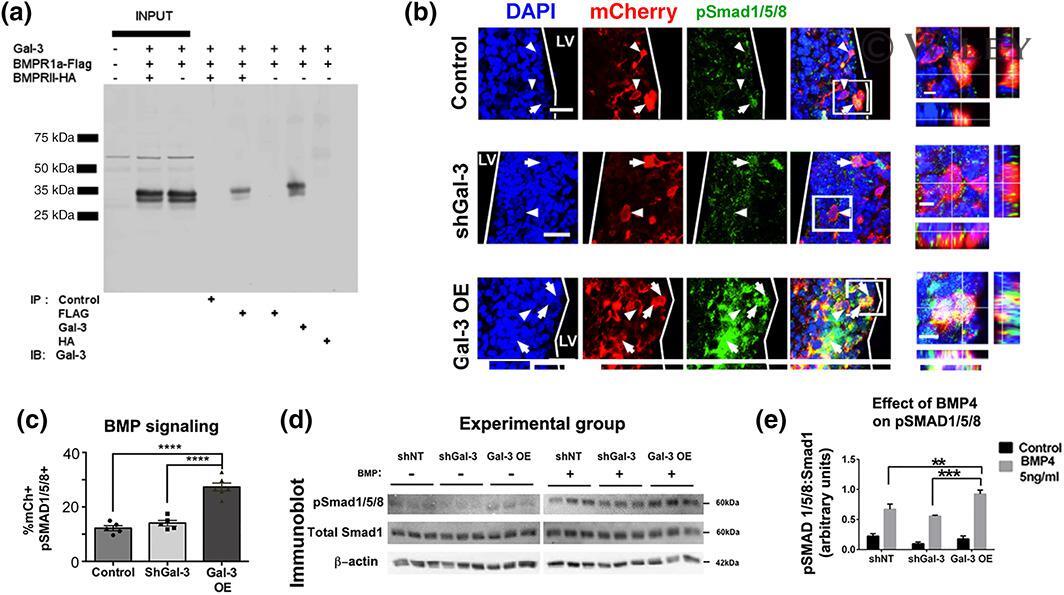
- Gal-3 increases BMP signaling. (a) Co-immunoprecipitation of Gal-3 and BMPR1alpha and BMPR2. (b) Representative confocal images 3DPE. DAPI+ nuclei, mCherry+ electroporated cells, and pSmad 1/5/8+ cells. Arrows indicate pSmad1/5/8+ and arrowheads pSmad1/5/8-labeled cells. Boxed areas are enlarged as orthogonal views. Scale bars: 20 mum for main panels, 5 mum for insets. (c) Quantification of B. One-way ANOVA, Tukey's test for multiple comparisons. n = 5-6. (d) Western blot 24 hr after nucleofection with shNT (control), shGal-3, or Gal-3 OE, cells were treated with control or 5 ng/mL BMP4 for 24 hr. Immunoblot for pSmad 1/5/8, total Smad1 and beta-Actin. (e) Quantification of pSmad1/5/8 band intensities from (A1-2) normalized to total Smad 1. 2-way ANOVA
- Submitted by
- Invitrogen Antibodies (provider)
- Main image
- Experimental details
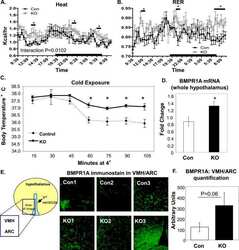
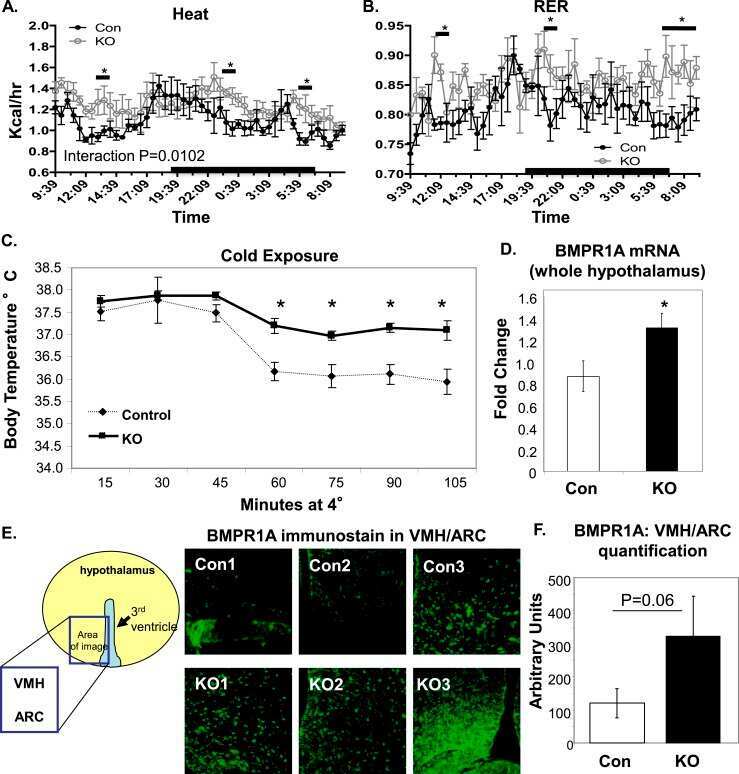
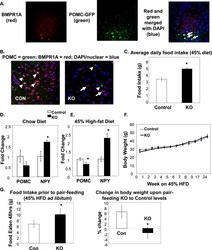
- Figure 1 BMPR1A in hypothalamic POMC neurons regulated food intake. (A) Immunofluorescent colocalization shows that POMC neurons in the ARC region of a C57BL/6 mouse hypothalamus were positive for BMPR1A [arrows in far right panel (merged image) point to yellow cells that colocalize]. Red staining indicates BMPR1A (left panel, Invitrogen; catalog no. 38-6000), and green staining indicates GFP-positive neurons in a POMC-GFP reporter mouse (middle panel). Far right panel shows merged staining with a nuclear stain (DAPI/blue). Images were taken on a confocal microscope at ×60 magnification. (B) The hypothalamic colocalization of BMPR1A in POMC neurons (seen in control mice in the left panel, where arrowheads indicate costaining of red BMPR1A with green POMC) is no longer seen in POMC/BMPR1A-KO mice (right panel, where arrowheads indicate green POMC neurons and full arrows indicate remaining red BMPR1A neurons). Images were taken on a confocal microscope at ×60 magnification. (C) Daily food intake measurements of mice on a 45% HFD, showing KO mice were hyperphagic (N = 6 to 8 mice per group). (D and E) POMC/BMPR1A-KO mice displayed increased orexigenic NPY and decreased anorexigenic POMC (D) on chow and (E) on a 45% HFD (N = 6 to 8 mice per group). (F) Despite hyperphagia, POMC/BMPR1A-KO mice did not show a difference in body weight on a 45% HFD, as measured up to 24 weeks (N = 6 to 8 mice per group). (G) A pair-feeding study showed that although KO mice were hyperphagic when fed ad libitum 45% HFD before pair-feeding (left panel), they lost weight when pair-fed to th
