Explore
 Validate
 Learn
Learn Western blot
 Other assay
Antibody data
- Antibody Data
- Antigen structure
- References [1]
- Comments [0]
- Validations
- Other assay [3]
Submit
Validation data
Reference
Comment
Report error
- Product number
- MA5-24107 - Provider product page

- Provider
- Invitrogen Antibodies
- Product name
- FAM3A Monoclonal Antibody (358112)
- Antibody type
- Monoclonal
- Antigen
- Recombinant full-length protein
- Description
- In direct ELISAs and Western blots, 100% cross-reactivity with recombinant mouse FAM3A is observed and no cross-reactivity with recombinant human (rh) FAM3B, rhFAM3C, or rhFAM3D is observed. Reconstitute at 0.5 mg/mL in sterile PBS.
- Reactivity
- Human
- Host
- Mouse
- Isotype
- IgG
- Antibody clone number
- 358112
- Vial size
- 100 μg
- Concentration
- 0.5 mg/mL
- Storage
- -20°C, Avoid Freeze/Thaw Cycles
Submitted references Endothelial FAM3A positively regulates post-ischaemic angiogenesis.
Xu W, Liang M, Zhang Y, Huang K, Wang C
EBioMedicine 2019 May;43:32-42
EBioMedicine 2019 May;43:32-42
No comments: Submit comment
Supportive validation
- Submitted by
- Invitrogen Antibodies (provider)
- Main image
- Experimental details
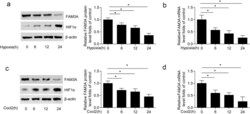
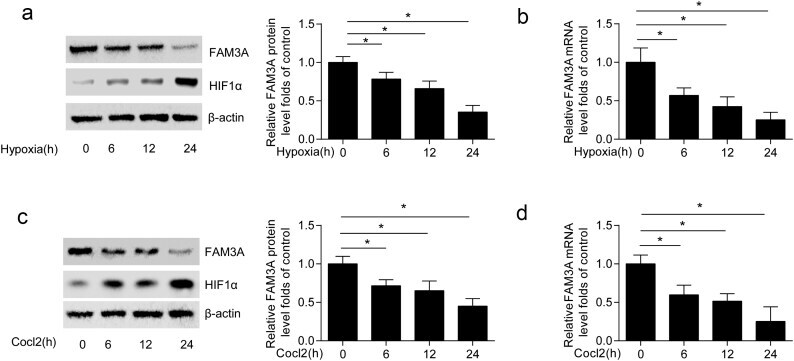
- Fig. 1 Hypoxia inhibits FAM3A expression in HUVECs. (a) HUVECs were cultured in normoxia (21% O2) or hypoxic (1% O2) conditions for 6 h, 12 h, 24 h, and FAM3A and HIF1alpha protein levels were detected by western blot assays. The densitometric analysis of FAM3A level was shown. ( n = 5 per group) (b) The FAM3A mRNA level was detected via real-time PCR. (n = 5 per group) (c) HUVECs were treated with CoCl 2 (200 muM) for 0 h, 6 h, 12 h, 24 h, and FAM3A and HIF1alpha protein levels were detected by western blot. (n = 5 per group) The densitometric analysis of FAM3A was shown. (d) The mRNA level of FAM3A expression was tested through real-time PCR. (n = 5 per group). Data were analysed with one-way ANOVA. Data are represented by mean +- S.D. * P < .05. Fig. 1
- Submitted by
- Invitrogen Antibodies (provider)
- Main image
- Experimental details
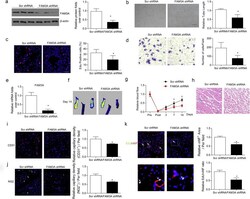
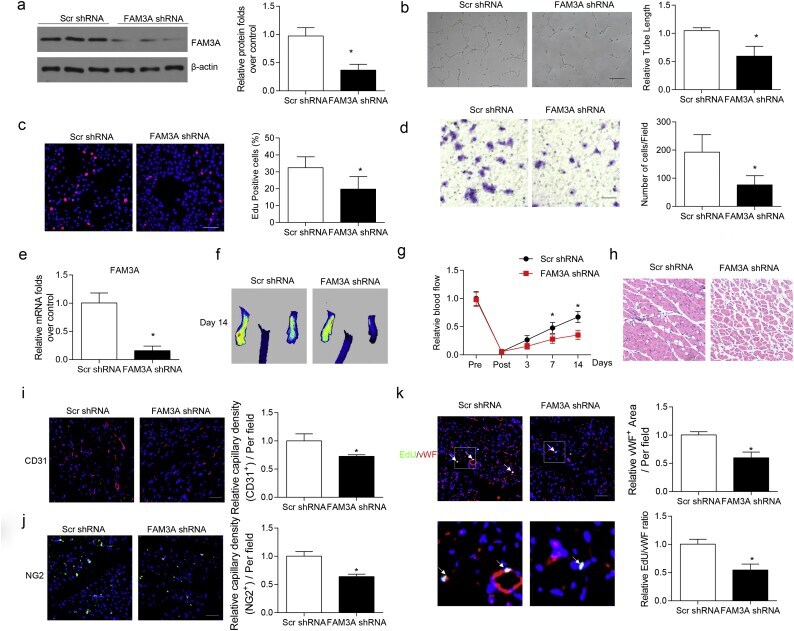
- Fig. 3 Endothelial FAM3A knockdown suppresses angiogenesis. (a) HUVECs were infected with adenovirus coding Scr shRNA or FAM3A shRNA for 24 h, and the FAM3A protein level was measured by western blotting. (b) Ad-Scr shRNA- and Ad-FAM3A shRNA-infected HUVECs were placed in plates coated with Matrigel and tubular structures were photographed. (n = 5 per group) Scale bar, 50 mum. (c) The proliferation of HUVECs pre-infected with Ad-Scr shRNA or Ad-FAM3A shRNA was measured by an EdU staining assay. (n = 5 per group) Scale bar, 50 mum (d) The migration of HUVECs pre-infected with Ad-Scr shRNA or Ad-FAM3A shRNA was measured by Transwell assay. (n = 5 per group) Scale bar, 25 mum (e) Endothelial cells from ischaemic adductor tissue were purified using a CD31/PECAM1 antibody and then subjected to qRT-PCR assay to check the mRNA expression of FAM3A. (f) The hind limb blood perfusion in the AAV2-Scr shRNA- or AAV2-FAM3A shRNA-transduced group were analysed by Laser Doppler imaging. Normal perfusion is indicated by Yellow, and a reduction in blood flow is indicated by Blue. (n = 8-10 for each group) (g) The ischaemic: normal hind limb perfusion ratios in AAV2-Scr shRNA- or AAV2-FAM3A shRNA-treated mice at indicated time were collected to analysis blood perfusion. (h) H&E staining showed massive muscle degeneration in the ischemic regions. (i-k) The immunofluorescent staining of CD31, NG2 and EdU/vWF in the ischaemic gastrocnemius muscle was performed and quantitatively analysed. ( n = 5
- Submitted by
- Invitrogen Antibodies (provider)
- Main image

- Experimental details
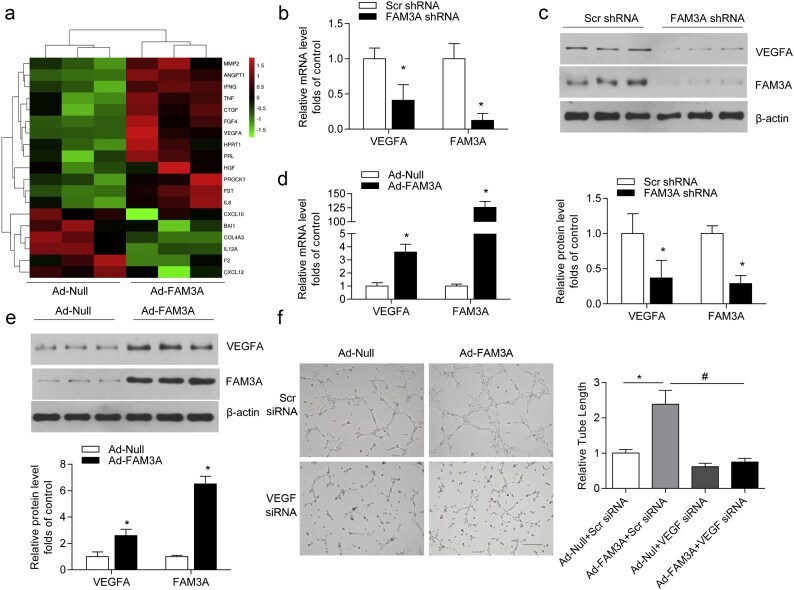
- Fig. 4 FAM3A regulates VEGFA expression. (a) Angiogenesis PCR array was performed in HUVECs that were infected with adenovirus containing FAM3A, and a heatmap of related gene expression levels is shown. Unsupervised hierarchical clustering analysis was performed using Ct values. Low expression is shown in green, and red indicates high expression. ( n = 3 per group) (b-e) HUVECs were infected with adenovirus encoding Scr shRNA, FAM3A shRNA, and FAM3A. The VEGFA mRNA and protein levels in HUVECs were determined by real-time PCR ( n = 5 per group) (b,d) and western blot assays (c, e). (f) HUVECs were first transfected with Scr siRNA or VEGF siRNA for 24 h and then placed in plates coated with Matrigel and tubular structures were photographed. ( n = 5 per group) Scale bar, 50 mum. Data were analysed with two-tailed Student's t-tests (a-e) and one-way ANOVA (f). Data are represented by mean +- S.D. * P < .05. (For interpretation of the references to colour in this figure legend, the reader is referred to the web version of this article.) Fig. 4