Explore
 Validate
 Learn
LearnMA1-215
antibody from Invitrogen Antibodies
Targeting: THRB
ERBA-BETA, ERBA2, GRTH, NR1A2, PRTH, THR1, THRB1, THRB2
 Western blot
 Immunoprecipitation
Antibody data
- Antibody Data
- Antigen structure
- References [0]
- Comments [0]
- Validations
- Western blot [1]
- Immunocytochemistry [2]
- Immunohistochemistry [4]
- Other assay [16]
Submit
Validation data
Reference
Comment
Report error
- Product number
- MA1-215 - Provider product page

- Provider
- Invitrogen Antibodies
- Product name
- THRA/THRB Monoclonal Antibody (C3)
- Antibody type
- Monoclonal
- Antigen
- Purifed from natural sources
- Description
- MA1-215 detects thyroid hormone receptor (TR) from human tissues. This antibody recognizes TR beta-1 and also cross-reacts with TR alpha-1. MA1-215 has been successfully used in Western blot, IF, immunoprecipitation, and gel shift procedures. By Western blot, this antibody detects a 55 and a 52 kDa protein representing recombinant human TR beta-1 expressed in E. coli. MA1-215 immunoprecipitates 52 kDa and 55 kDa proteins, representing TR beta-1 and a 48 kDa protein representing TR alpha-1 expressed in E. coli. The MA1-215 immunogen is a purified fragment of human TR beta-1 corresponding to amino acid residues 201-456. This antibody recognizes an epitope in the hormone binding domain of hTR beta-1, amino acid residues 235-414. This sequence is conserved in hTR alpha-1.
- Reactivity
- Human
- Host
- Mouse
- Isotype
- IgG
- Antibody clone number
- C3
- Vial size
- 100 µL
- Concentration
- Conc. Not Determined
- Storage
- -20° C, Avoid Freeze/Thaw Cycles
No comments: Submit comment
Supportive validation
- Submitted by
- Invitrogen Antibodies (provider)
- Main image

- Experimental details
- Western blot of human thyroid hormone receptor using Product # MA1-215.

Supportive validation
- Submitted by
- Invitrogen Antibodies (provider)
- Main image

- Experimental details
- Immunofluorescent analysis of Thyroid Hormone Receptor in HeLa Cells. Cells were grown on chamber slides and fixed with formaldehyde prior to staining. Cells were probed without (control) or with a Thyroid Hormone Receptor monoclonal antibody (Product # MA1-215) at a dilution of 1:20 overnight at 4 C, washed with PBS and incubated with a DyLight-488 conjugated secondary antibody (Product # 35503). Thyroid Hormone Receptor staining (green), F-Actin staining with Phalloidin (red) and nuclei with DAPI (blue) is shown. Images were taken at 60X magnification.

- Submitted by
- Invitrogen Antibodies (provider)
- Main image

- Experimental details
- Immunofluorescent analysis of Thyroid Hormone Receptor in HepG2 Cells. Cells were grown on chamber slides and fixed with formaldehyde prior to staining. Cells were probed without (control) or with a Thyroid Hormone Receptor monoclonal antibody (Product # MA1-215) at a dilution of 1:20 overnight at 4 C, washed with PBS and incubated with a DyLight-488 conjugated secondary antibody (Product # 35503). Thyroid Hormone Receptor staining (green), F-Actin staining with Phalloidin (red) and nuclei with DAPI (blue) is shown. Images were taken at 60X magnification.

Supportive validation
- Submitted by
- Invitrogen Antibodies (provider)
- Main image

- Experimental details
- Immunohistochemistry was performed on normal biopsies of deparaffinized Human thyroid tissue. To expose target proteins, heat induced antigen retrieval was performed using 10mM sodium citrate (pH6.0) buffer, microwaved for 8-15 minutes. Following antigen retrieval tissues were blocked in 3% BSA-PBS for 30 minutes at room temperature and probed with a Thyroid Hormone Receptor monoclonal antibody (Product # MA1-215) at a dilution of 1:20 or without primary antibody (negative control) overnight at 4°C in a humidified chamber. Tissues were washed with PBST and endogenous peroxidase activity was quenched with a peroxidase suppressor. Detection was performed using a biotin-conjugated secondary antibody and SA-HRP, followed by colorimetric detection using DAB. Tissues were counterstained with hematoxylin and prepped for mounting.

- Submitted by
- Invitrogen Antibodies (provider)
- Main image

- Experimental details
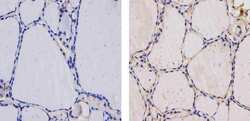
- Immunohistochemistry analysis of Thyroid Hormone Receptor showing staining in the nucleus and weak staining in the cytoplasm of paraffin-embedded human colon tissue (right) compared to a negative control without primary antibody (left). To expose target proteins, antigen retrieval was performed using 10mM sodium citrate (pH 6.0), microwaved for 8-15 min. Following antigen retrieval, tissues were blocked in 3% H2O2-methanol for 15 min at room temperature, washed with ddH2O and PBS, and then probed with a Thyroid Hormone Receptor Mouse Monoclonal Antibody (Product # MA1-215) diluted in 3% BSA-PBS at a dilution of 1:20 for 1 hour at 37ºC in a humidified chamber. Tissues were washed extensively in PBST and detection was performed using an HRP-conjugated secondary antibody followed by colorimetric detection using a DAB kit. Tissues were counterstained with hematoxylin and dehydrated with ethanol and xylene to prep for mounting.

- Submitted by
- Invitrogen Antibodies (provider)
- Main image
- Experimental details
- Immunohistochemistry analysis of Thyroid Hormone Receptor showing staining in the cytoplasm and weak staining in the nucleus of paraffin-embedded human thyroid tissue (right) compared to a negative control without primary antibody (left). To expose target proteins, antigen retrieval was performed using 10mM sodium citrate (pH 6.0), microwaved for 8-15 min. Following antigen retrieval, tissues were blocked in 3% H2O2-methanol for 15 min at room temperature, washed with ddH2O and PBS, and then probed with a Thyroid Hormone Receptor Mouse Monoclonal Antibody (Product # MA1-215) diluted in 3% BSA-PBS at a dilution of 1:20 for 1 hour at 37ºC in a humidified chamber. Tissues were washed extensively in PBST and detection was performed using an HRP-conjugated secondary antibody followed by colorimetric detection using a DAB kit. Tissues were counterstained with hematoxylin and dehydrated with ethanol and xylene to prep for mounting.

- Submitted by
- Invitrogen Antibodies (provider)
- Main image

- Experimental details
- Immunohistochemistry analysis of Thyroid Hormone Receptor showing staining in the cytoplasm and weak staining in the nucleus of paraffin-embedded mouse thyroid tissue (right) compared to a negative control without primary antibody (left). To expose target proteins, antigen retrieval was performed using 10mM sodium citrate (pH 6.0), microwaved for 8-15 min. Following antigen retrieval, tissues were blocked in 3% H2O2-methanol for 15 min at room temperature, washed with ddH2O and PBS, and then probed with a Thyroid Hormone Receptor Mouse Monoclonal Antibody (Product # MA1-215) diluted in 3% BSA-PBS at a dilution of 1:20 for 1 hour at 37ºC in a humidified chamber. Tissues were washed extensively in PBST and detection was performed using an HRP-conjugated secondary antibody followed by colorimetric detection using a DAB kit. Tissues were counterstained with hematoxylin and dehydrated with ethanol and xylene to prep for mounting.

Supportive validation
- Submitted by
- Invitrogen Antibodies (provider)
- Main image

- Experimental details
- NULL

- Submitted by
- Invitrogen Antibodies (provider)
- Main image

- Experimental details
- NULL

- Submitted by
- Invitrogen Antibodies (provider)
- Main image

- Experimental details
- NULL

- Submitted by
- Invitrogen Antibodies (provider)
- Main image
- Experimental details
- NULL

- Submitted by
- Invitrogen Antibodies (provider)
- Main image

- Experimental details
- NULL

- Submitted by
- Invitrogen Antibodies (provider)
- Main image

- Experimental details
- NULL

- Submitted by
- Invitrogen Antibodies (provider)
- Main image

- Experimental details
- NULL

- Submitted by
- Invitrogen Antibodies (provider)
- Main image

- Experimental details
- NULL

- Submitted by
- Invitrogen Antibodies (provider)
- Main image

- Experimental details
- NULL

- Submitted by
- Invitrogen Antibodies (provider)
- Main image

- Experimental details
- NULL

- Submitted by
- Invitrogen Antibodies (provider)
- Main image

- Experimental details
- Figure 1. T 3 -bound TR beta A1 increases IP 3 -induced Ca 2 + wave period. (a) Spatial-temporal stacks of IP 3 (~300 nM)-induced Ca 2+ wave activity in a representative control (water injected) oocyte, a T 3 -treated (100 nM) oocyte expressing TR beta A1 and a T 3 (100 nM) treated oocyte. Each image is 745 x 745 mum. (b) Western blot showing expression of TR beta A1. Protein extracts from all groups were collected and loaded at 0.5 oocytes per lane onto 10% SDS-PAGE. The membrane was probed with a monoclonal mouse anti-human TRs antibody (MA1-215) and labeled with an HRP-conjugated secondary antibody. (c) Histogram of average interwave period for each group of oocytes. n values in parentheses represent the total number of oocytes pooled from at least two frogs. Error bars correspond to the mean +- SEM. The asterisks (**) denote a statistic significant difference (ANOVA single factor, P < 0.0001).

- Submitted by
- Invitrogen Antibodies (provider)
- Main image

- Experimental details
- Figure 2. Transcriptional activity of TR beta A1 requires xRXR alpha and both cognate ligands. Transcriptional activity was monitored with the TRE-reporter vector, pSEAP (TRE) . (a) Lanes 1 and 2 are negative (pSEAP (-ve) ) and positive (pSEAP (+ve) ) vector controls. Oocytes expressing TR beta A1 or TR beta A1 plus xRXR alpha were incubated with 100 nM T 3 (lanes 3-5) plus 100 nM RA (lane 5) for 3 d. Cytosolic extracts from each group of oocytes was prepared and loaded onto a 10% SDS-PAGE at 2.5 oocytes equivalents per lane. SEAP was detected with the polyclonal rabbit anti-human SEAP antibody and an HRP-conjugated secondary antibody. The SP labeled arrow indicates SEAP immunoreactivity, which was present only in oocytes expressing TR beta A1 and xRXR alpha exposed to both T 3 and RA. (b) Transcriptional activity of TR beta A1 requires the pBOX within the DBD and the NLS. Oocytes expressing xTR beta A1DeltapBox-NLS and xRXR alpha show no SEAP immunoreactivity when incubated with T 3 (lane 6) or T 3 plus RA (lane 7). Western blot analysis shows that xRXR alpha , TR beta A1, and xTR beta A1DeltapBox-NLS are expressed at comparable levels (Western blots below lanes 4-7). TR beta A1 and xTR beta A1DeltapBox-NLS were detected with the monoclonal mouse anti-human TRs antibody (MA1-215). xRXR alpha was detected with a polyclonal rabbit anti-human RXR antibody (Sc-774).

- Submitted by
- Invitrogen Antibodies (provider)
- Main image

- Experimental details
- Figure 3. Acute modulation of Ca 2 + signaling does not require heterodimerization of TR beta A1 with xRXR alpha . (a) Spatial-temporal stacks of IP 3 -induced Ca 2+ wave activity in control oocytes compared with oocytes expressing TR beta A1 or TR beta A1 with xRXR alpha . T 3 (100 nM) and RA (100 nM) were added as indicated 10-15 min before injection with IP 3 (~300 nM). Scale is the same as Fig. 1 . (b) Western blots of oocytes expressing TR beta A1 and xRXR alpha . Primary and secondary antibodies were identical to those used in Figs. 1 and 2 . (c). Histogram of average interwave period (second) of each group of oocytes. The asterisks (**) denote a statistic significance using ANOVA single factor (P < 0.0001). Values in parentheses represent the number of oocytes.

- Submitted by
- Invitrogen Antibodies (provider)
- Main image

- Experimental details
- Figure 4. The pBOX and NLSs of TR beta A1 are not required for the acute regulation of Ca 2 + signaling. (a) Schematic figure depicting the position of the pBOX deletion in the DBD and the NLS modification within TR beta A1. (b) Spatial-temporal stack of IP 3 -induced Ca 2+ wave activity in control oocytes compared with oocytes expressing TR mutants DeltapBox-NLS and DeltaNLS. Oocytes expressing the TR mutants were incubated with T 3 (100 nM) 10-15 min before IP 3 (~300 nM) injections. (c) Western blot analysis confirming comparable levels of protein expression for both wild-type and mutant TR beta A1. (d) Histogram of the average Ca 2+ wave periods for each group of oocytes ( n values are in parentheses). Statistic significance over control oocytes is indicated by the asterisks (**; ANOVA single factor, P < 0.0001).

- Submitted by
- Invitrogen Antibodies (provider)
- Main image

- Experimental details
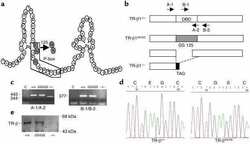
- Figure 8. Xeno pus TR beta A1 and NH 2 -terminal truncated rat TR alpha 1 (rTR alpha 1DeltaF) localize to mitochondria. (a) Schematic diagram of TRs showing that rTR alpha 1DeltaF and xTR beta A1 have a similar NH 2 terminus. (b and c) Western blots of TR alpha 1, rTR alpha 1DeltaF, and xTR beta A1 expression in whole oocytes and mitochondrial extracts respectively. FL, full-length receptor; SH, shortened form of the receptor. Extracts were prepared from 300 oocytes in each group. All oocytes were exposed to 100 nM T 3 for at least 15 min before organelle extraction. TRs were immunoprecipitated with a monoclonal mouse anti-human TRs antibody (MA1-215), captured with immobilized protein G, concentrated, and loaded onto a 10% SDS-PAGE. An HRP-conjugated secondary antibody was used for visualization.

- Submitted by
- Invitrogen Antibodies (provider)
- Main image
- Experimental details
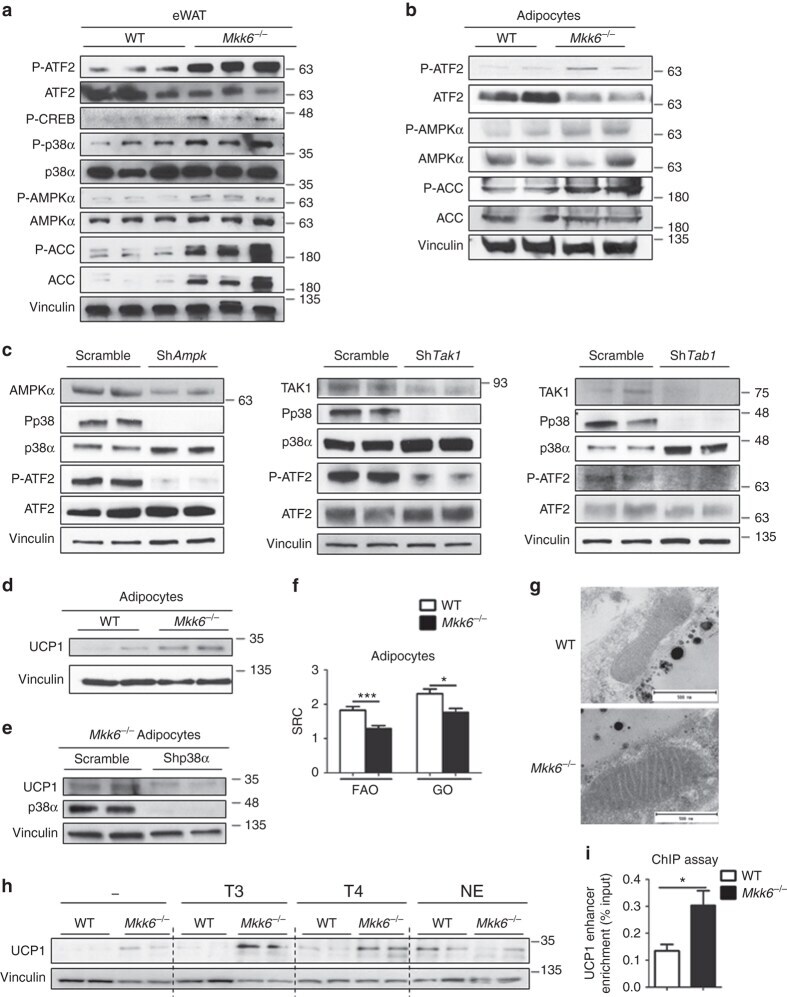
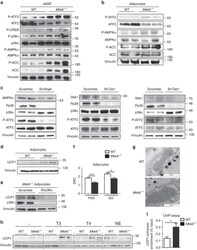
- Fig. 3 Mkk6 -/- white adipose tissue is predisposed to T3-induced browning. a Activation of p38 and AMPK pathways in epididymal white fat from HFD-fed WT and Mkk6 -/- mice. Immunoblot analysis with the indicated antibodies was performed in extracts from mice starved overnight. b Immunoblot analysis of in vitro differentiated WT and Mkk6 -/- adipocytes. Representative from three different experiments done by duplicate. c Mkk6 -/ pre-adipocytes were infected with shRNA against AMPK, TAK1, TAB1, or scramble as a control. Activation of p38 was assayed by immunoblot of p38 and ATF2 phosphorylation. Representative from three different experiments. d UCP1 protein expression in in vitro differentiated WT and Mkk6 -/- adipocytes. Representative from three different experiments done by duplicate. e Mkk6 -/- pre-adipocytes were infected with shRNA against p38alpha or scramble as a control, and then differentiated to adipocytes. UCP1 levels were assayed by immunoblot n = 4. f Mitochondrial spare respiratory capacity (SRC) was assessed by Seahorse assay in primary WT and Mkk6 -/- adipocytes incubated with glucose oxidation (GO) or fatty acid oxidation (FAO) medium (mean +- SEM, WT n = 22 WT or 24 Mkk6 -/- wells from three mice cultured independently). g Representative transmission electronic microscopy images of mitochondria in eWAT from WT and Mkk6 -/- HFD-fed mice ( n = 3 mice). Scale bar: 500 nm. h Immunoblot analysis of UCP1 protein in in vitro differentiated WT and Mkk6 -/- adipocyte