Explore
 Validate
 Learn
LearnMA5-15228
antibody from Invitrogen Antibodies
Targeting: MAPK9
JNK2, p54a, PRKM9, SAPK
 Western blot
 Immunocytochemistry
 Immunoprecipitation Flow cytometry Chromatin Immunoprecipitation Other assay
Antibody data
- Antibody Data
- Antigen structure
- References [0]
- Comments [0]
- Validations
- Immunocytochemistry [2]
- Flow cytometry [2]
- Chromatin Immunoprecipitation [2]
- Other assay [1]
Submit
Validation data
Reference
Comment
Report error
- Product number
- MA5-15228 - Provider product page

- Provider
- Invitrogen Antibodies
- Product name
- Phospho-JNK1/JNK2 (Thr183, Tyr185) Monoclonal Antibody (E.665.10)
- Antibody type
- Monoclonal
- Antigen
- Synthetic peptide
- Description
- Antibodies to this protein (and modification) were previously sold as part of a Thermo Scientific Cellomics High Content Screening Kit. This replacement antibody is now recommended for researchers who need an antibody for high content cell based assays. It has been thoroughly tested and validated for cellular immunofluorescence (IF) applications. Further optimization including the selection of the most appropriate fluorescent Dylight conjugated secondary antibody may have to be performed for your high content assay. It is not recommended to aliquot this antibody.
- Reactivity
- Human, Mouse, Rat, Hamster, Yeast
- Host
- Mouse
- Isotype
- IgG
- Antibody clone number
- E.665.10
- Vial size
- 200 μL
- Concentration
- 591 μg/mL
- Storage
- -20°C
No comments: Submit comment
Supportive validation
- Submitted by
- Invitrogen Antibodies (provider)
- Main image

- Experimental details
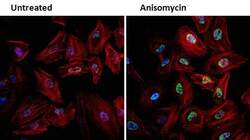
- Immunofluorescent analysis of Phospho-JNK (green) in HeLa cells either left untreated (left panel) or treated with 25 µg/mL anisomycin (right panel) for 25 min. Formalin fixed cells were permeabilized with 0.1% Triton X-100 in TBS for 10 minutes at room temperature and blocked with 1% Blocker BSA (Product # 37525) for 15 minutes at room temperature. Cells were probed with a Phospho-SAPK/JNK pThr183/Tyr185 monoclonal antibody (Product # MA5-15228) at a dilution of 1:100 for at least 1 hour at room temperature, washed with PBS, and incubated with DyLight 488 goat anti-mouse IgG secondary antibody (Product # 35502) at a dilution of 1:400 for 30 minutes at room temperature. F-Actin (red) was stained with DyLight 554 Phalloidin (Product # 21834) and nuclei (blue) were stained with Hoechst 33342 dye (Product # 62249). Images were taken on a Thermo Scientific ArrayScan or ToxInsight Instrument at 20X magnification.

- Submitted by
- Invitrogen Antibodies (provider)
- Main image
- Experimental details
- Immunofluorescent analysis of Phospho-JNK (green) in HeLa cells either left untreated (left panel) or treated with 25 µg/mL anisomycin (right panel) for 25 min. Formalin fixed cells were permeabilized with 0.1% Triton X-100 in TBS for 10 minutes at room temperature and blocked with 1% Blocker BSA (Product # 37525) for 15 minutes at room temperature. Cells were probed with a Phospho-SAPK/JNK pThr183/Tyr185 monoclonal antibody (Product # MA5-15228) at a dilution of 1:100 for at least 1 hour at room temperature, washed with PBS, and incubated with DyLight 488 goat anti-mouse IgG secondary antibody (Product # 35502) at a dilution of 1:400 for 30 minutes at room temperature. F-Actin (red) was stained with DyLight 554 Phalloidin (Product # 21834) and nuclei (blue) were stained with Hoechst 33342 dye (Product # 62249). Images were taken on a Thermo Scientific ArrayScan or ToxInsight Instrument at 20X magnification.

Supportive validation
- Submitted by
- Invitrogen Antibodies (provider)
- Main image
- Experimental details
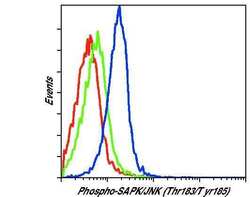
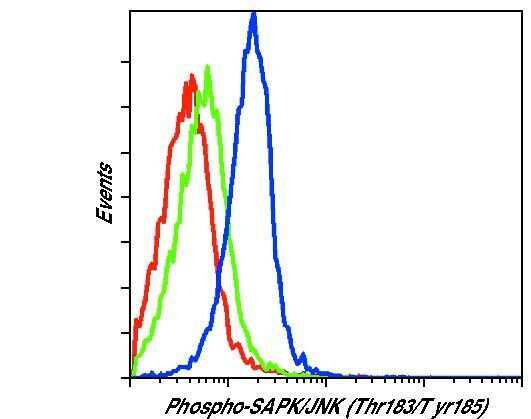
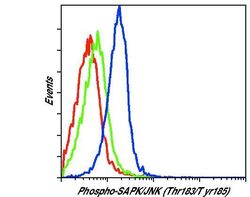
- Flow cytometric analysis of Phospho-JNK on Jurkat cells left untreated (green histogram) or treated with anisomycin (blue histogram). Cells were harvested, fixed with formaldehyde, permeabilized with methanol, and incubated with a Phospho-SAPK/JNK pThr183/Tyr185 monoclonal antibody (Product # MA5-15228) at a dilution of 1:200 for 1 hour at room temperature. As a negative control anisomycin-treated cells were stained with an isotype control (red histogram). Following staining with either MA5-15228 or isotype control, cells were stained with a fluorescently-conjugated anti-mouse IgG secondary antibody and analyzed on a flow cytometer.
- Submitted by
- Invitrogen Antibodies (provider)
- Main image
- Experimental details
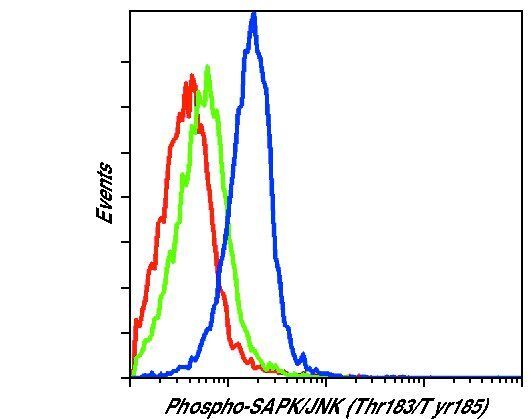
- Flow cytometric analysis of Phospho-JNK on Jurkat cells left untreated (green histogram) or treated with anisomycin (blue histogram). Cells were harvested, fixed with formaldehyde, permeabilized with methanol, and incubated with a Phospho-SAPK/JNK pThr183/Tyr185 monoclonal antibody (Product # MA5-15228) at a dilution of 1:200 for 1 hour at room temperature. As a negative control anisomycin-treated cells were stained with an isotype control (red histogram). Following staining with either MA5-15228 or isotype control, cells were stained with a fluorescently-conjugated anti-mouse IgG secondary antibody and analyzed on a flow cytometer.
Supportive validation
- Submitted by
- Invitrogen Antibodies (provider)
- Main image
- Experimental details
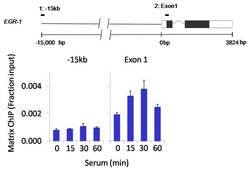
- Chromatin immunoprecipitation analysis of Phospho-SAPK/JNK pThr183/Tyr185 was performed using cross-linked chromatin from 1 x 10⁶ HCT116 colon carcinoma cells treated with serum for 0, 15, 30, and 60 minutes. Immunoprecipitation was performed using a multiplex microplate Matrix ChIP assay (see reference for Matrix ChIP protocol: http://www.ncbi.nlm.nih.gov/pubmed/22098709) with 1.0 µL/100 µL well volume of a Phospho-SAPK/JNK pThr183/Tyr185 monoclonal antibody (Product # MA5-15228). Chromatin aliquots from ~1 x 10⁵ cells were used per ChIP pull-down. Quantitative PCR data were done in quadruplicate using 1 µL of eluted DNA in 2 µL SYBR real-time PCR reactions containing primers to amplify -15kb upstream of the Egr1 gene or exon-1 of Egr1. PCR calibration curves were generated for each primer pair from a dilution series of sheared total genomic DNA. Quantitation of immunoprecipitated chromatin is presented as signal relative to the total amount of input chromatin. Results represent the mean +/- SEM for three experiments. A schematic representation of the Egr-1 locus is shown above the data where boxes represent exons (black boxes = translated regions, white boxes = untranslated regions); the zigzag line represents an intron; and the straight line represents upstream sequence. Regions amplified by Egr-1 primers are represented by black bars. Data courtesy of the Innovators Program.

- Submitted by
- Invitrogen Antibodies (provider)
- Main image
- Experimental details
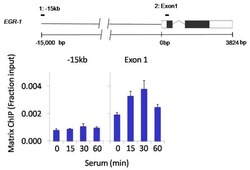
- Chromatin immunoprecipitation analysis of Phospho-SAPK/JNK pThr183/Tyr185 was performed using cross-linked chromatin from 1 x 10⁶ HCT116 colon carcinoma cells treated with serum for 0, 15, 30, and 60 minutes. Immunoprecipitation was performed using a multiplex microplate Matrix ChIP assay (see reference for Matrix ChIP protocol: http://www.ncbi.nlm.nih.gov/pubmed/22098709) with 1.0 µL/100 µL well volume of a Phospho-SAPK/JNK pThr183/Tyr185 monoclonal antibody (Product # MA5-15228). Chromatin aliquots from ~1 x 10⁵ cells were used per ChIP pull-down. Quantitative PCR data were done in quadruplicate using 1 µL of eluted DNA in 2 µL SYBR real-time PCR reactions containing primers to amplify -15kb upstream of the Egr1 gene or exon-1 of Egr1. PCR calibration curves were generated for each primer pair from a dilution series of sheared total genomic DNA. Quantitation of immunoprecipitated chromatin is presented as signal relative to the total amount of input chromatin. Results represent the mean +/- SEM for three experiments. A schematic representation of the Egr-1 locus is shown above the data where boxes represent exons (black boxes = translated regions, white boxes = untranslated regions); the zigzag line represents an intron; and the straight line represents upstream sequence. Regions amplified by Egr-1 primers are represented by black bars. Data courtesy of the Innovators Program.

Supportive validation
- Submitted by
- Invitrogen Antibodies (provider)
- Main image
- Experimental details
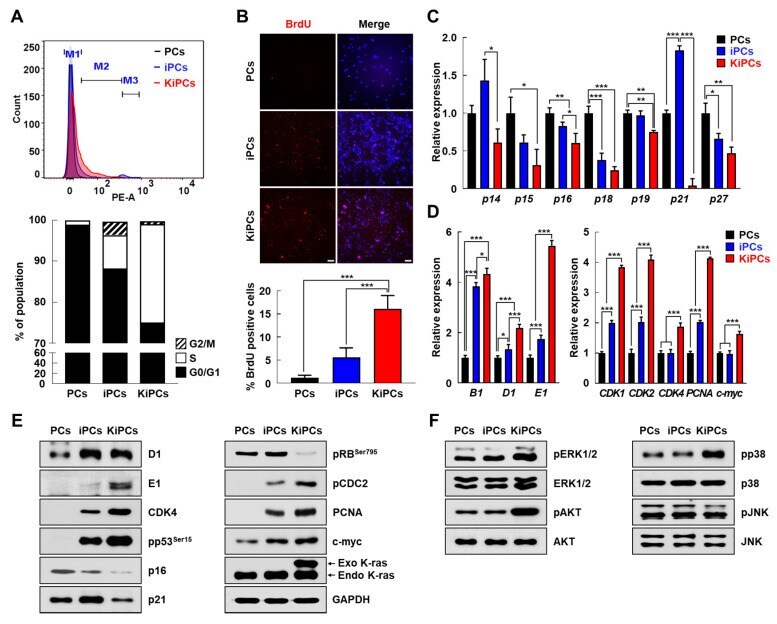
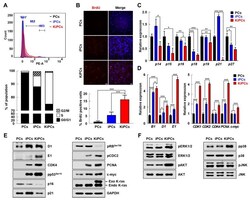
- Figure 3 KiPCs exhibited altered levels of cell cycle-regulated genes and mitogen-activated protein kinase (MAPK) kinase pathway members. ( A ) The cell cycle was analyzed by fluorescence-associated cell sorting after DNA staining with propidium iodide. M1: G0/G1, M2: S, and M3: G2/M phase. Percentages of cells in each cell cycle phase are shown in the bar graph. ( B ) Representative images of Bromodeoxyuridine (BrdU) staining (top) and percentages of BrdU-positive cells in the indicated groups (bottom). Magnification 100x. ( C ) qPCR analysis of cyclin-dependent kinase inhibitors. ( D ) qPCR analysis of cyclins and cyclin-dependent kinase-associated genes. ( E ) Cell cycle-related proteins and proliferation markers were measured by Western blot analysis. ( F ) Activation of three MAPKs was measured by Western blot analysis using phosphorylated protein-specific antibodies. Magnification 100x. All experiments were performed using at least three replicates, and the results are representative of three independent experiments. Data are presented as means +- standard deviation. * p < 0.05, ** p < 0.01, *** p < 0.001, one-way analysis of variance with Holm-Sidak multiple comparisons.