 Explore
 Validate
 Learn
Learn Flow cytometry
Antibody data
- Antibody Data
- Antigen structure
- References [30]
- Comments [0]
- Validations
- Flow cytometry [1]
- Other assay [26]
Submit
Validation data
Reference
Comment
Report error
- Product number
- 12-0719-42 - Provider product page

- Provider
- Invitrogen Antibodies
- Product name
- CD71 (Transferrin Receptor) Monoclonal Antibody (OKT9 (OKT-9)), PE, eBioscience™
- Antibody type
- Monoclonal
- Antigen
- Other
- Description
- Description: The OKT9 monoclonal antibody reacts with human CD71, a 170-180 kDa type II transmembrane protein. CD71, the transferrin receptor, exists as a homodimer on the cell surface and is essential for cellular growth. CD71 is expressed by immature proliferating cells and at low levels on resting mature lymphocytes. Antigen or mitogen stimulation of T and B cells upregulates the expression of CD71. Applications Reported: This OKT9 (OKT-9) antibody has been reported for use in flow cytometric analysis. Applications Tested: This OKT9 (OKT-9) antibody has been pre-titrated and tested by flow cytometric analysis of stimulated human peripheral blood mononuclear cells. This can be used at 5 µL (.06 µg) per test. A test is defined as the amount (µg) of antibody that will stain a cell sample in a final volume of 100 µL. Cell number should be determined empirically but can range from 10^5 to 10^8 cells/test. Excitation: 488-561 nm; Emission: 578 nm; Laser: Blue Laser, Green Laser, Yellow-Green Laser. Filtration: 0.2 µm post-manufacturing filtered.
- Reactivity
- Human
- Host
- Mouse
- Conjugate
- Yellow dye
- Isotype
- IgG
- Antibody clone number
- OKT9 (OKT-9)
- Vial size
- 100 Tests
- Concentration
- 5 µL/Test
- Storage
- 4° C, store in dark, DO NOT FREEZE!
Submitted references A patient-designed tissue-engineered model of the infiltrative glioblastoma microenvironment.
A group B Streptococcus alpha-like protein subunit vaccine induces functionally active antibodies in humans targeting homotypic and heterotypic strains.
Rapid increase in transferrin receptor recycling promotes adhesion during T cell activation.
Gene-centric functional dissection of human genetic variation uncovers regulators of hematopoiesis.
Transcriptional States and Chromatin Accessibility Underlying Human Erythropoiesis.
Methods for Systematic Identification of Membrane Proteins for Specific Capture of Cancer-Derived Extracellular Vesicles.
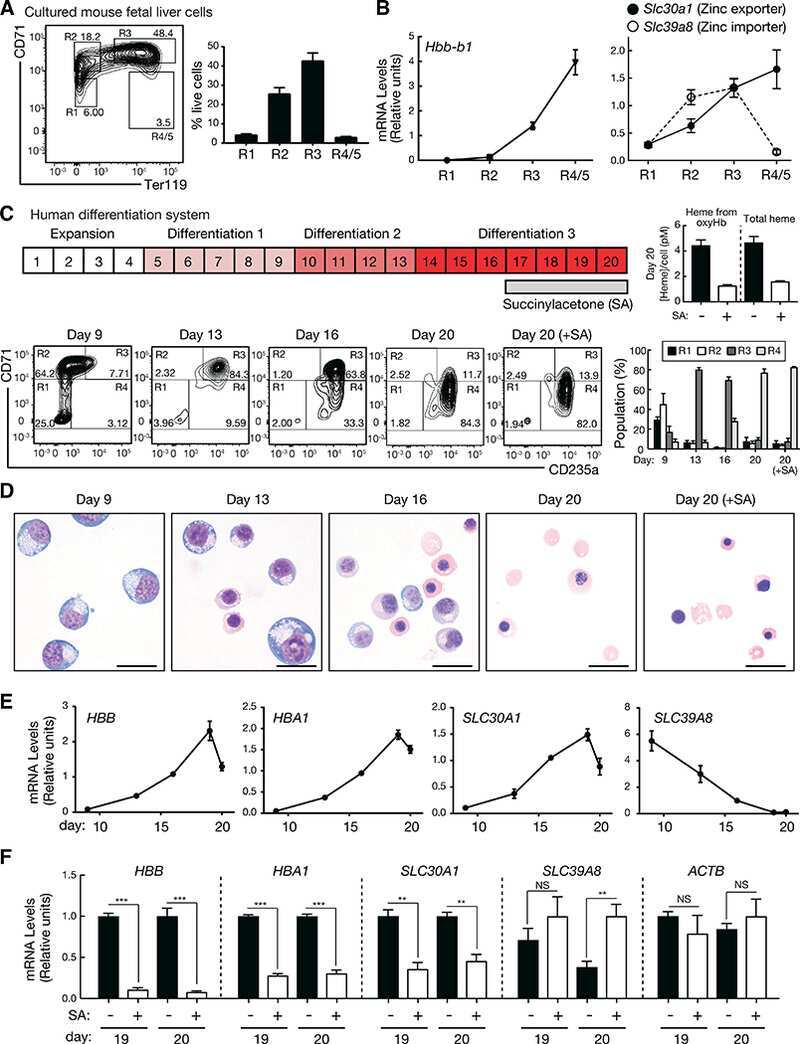
GATA/Heme Multi-omics Reveals a Trace Metal-Dependent Cellular Differentiation Mechanism.
Blocking transferrin receptor inhibits the growth of lung adenocarcinoma cells in vitro.
Genetically engineered red cells expressing single domain camelid antibodies confer long-term protection against botulinum neurotoxin.
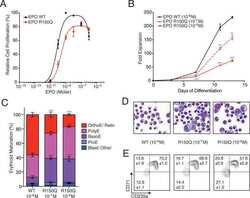
Functional Selectivity in Cytokine Signaling Revealed Through a Pathogenic EPO Mutation.
miRNA profiling of human naive CD4 T cells links miR-34c-5p to cell activation and HIV replication.
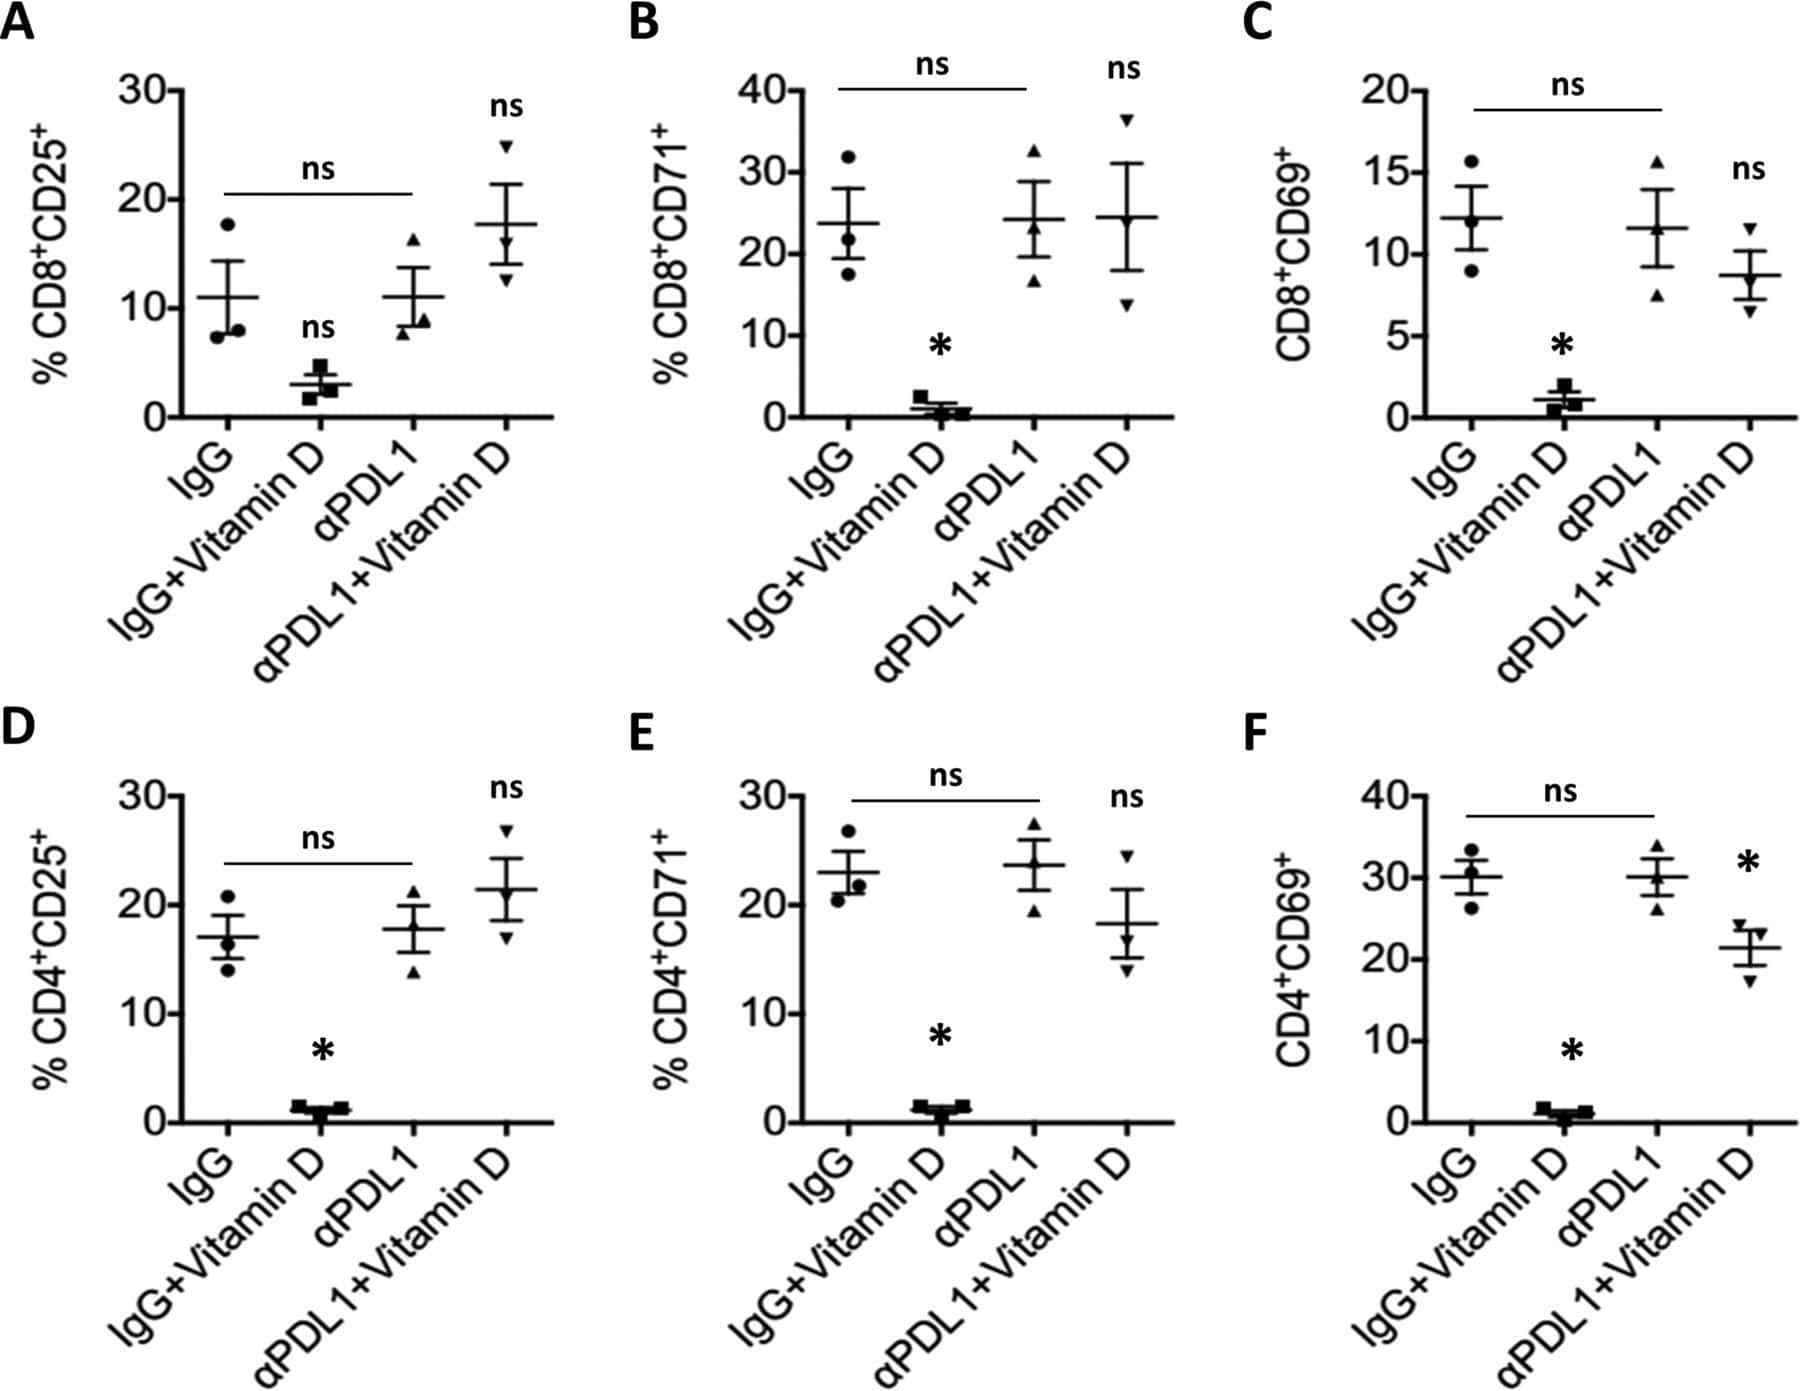
Hormonal vitamin D up-regulates tissue-specific PD-L1 and PD-L2 surface glycoprotein expression in humans but not mice.
Activation of KLF1 Enhances the Differentiation and Maturation of Red Blood Cells from Human Pluripotent Stem Cells.
Targeted Application of Human Genetic Variation Can Improve Red Blood Cell Production from Stem Cells.
Enforced Expression of HOXB4 in Human Embryonic Stem Cells Enhances the Production of Hematopoietic Progenitors but Has No Effect on the Maturation of Red Blood Cells.
The tryptophan metabolite picolinic acid suppresses proliferation and metabolic activity of CD4+ T cells and inhibits c-Myc activation.
DECKO: Single-oligo, dual-CRISPR deletion of genomic elements including long non-coding RNAs.
PPAR-α and glucocorticoid receptor synergize to promote erythroid progenitor self-renewal.
Functional plasticity of the N-methyl-d-aspartate receptor in differentiating human erythroid precursor cells.
Structure-function analysis of heterodimer formation, oligomerization, and receptor binding of the Staphylococcus aureus bi-component toxin LukGH.
Developmental transcriptome analysis of human erythropoiesis.
The cyclin dependent kinase inhibitor (R)-roscovitine mediates selective suppression of alloreactive human T cells but preserves pathogen-specific and leukemia-specific effectors.
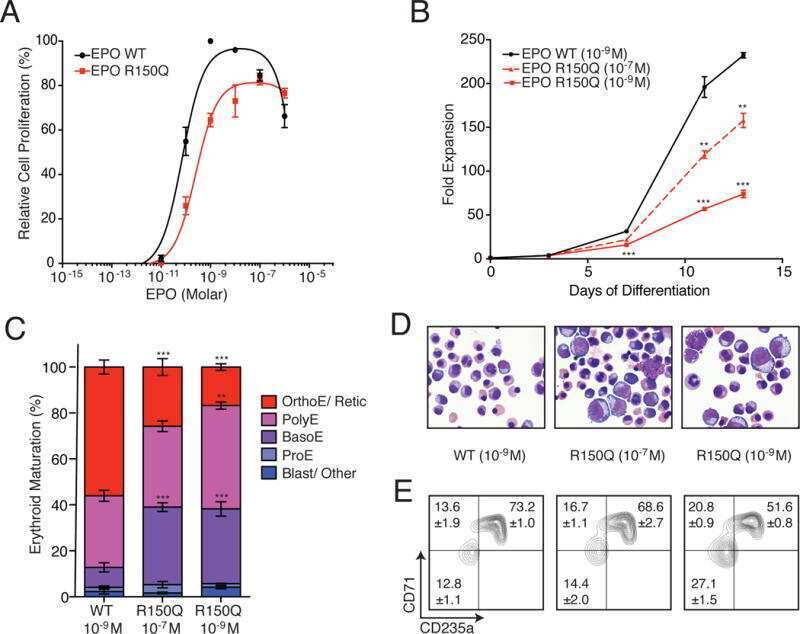
A feedback loop consisting of microRNA 23a/27a and the β-like globin suppressors KLF3 and SP1 regulates globin gene expression.
Lysine-specific demethylase 1 is a therapeutic target for fetal hemoglobin induction.
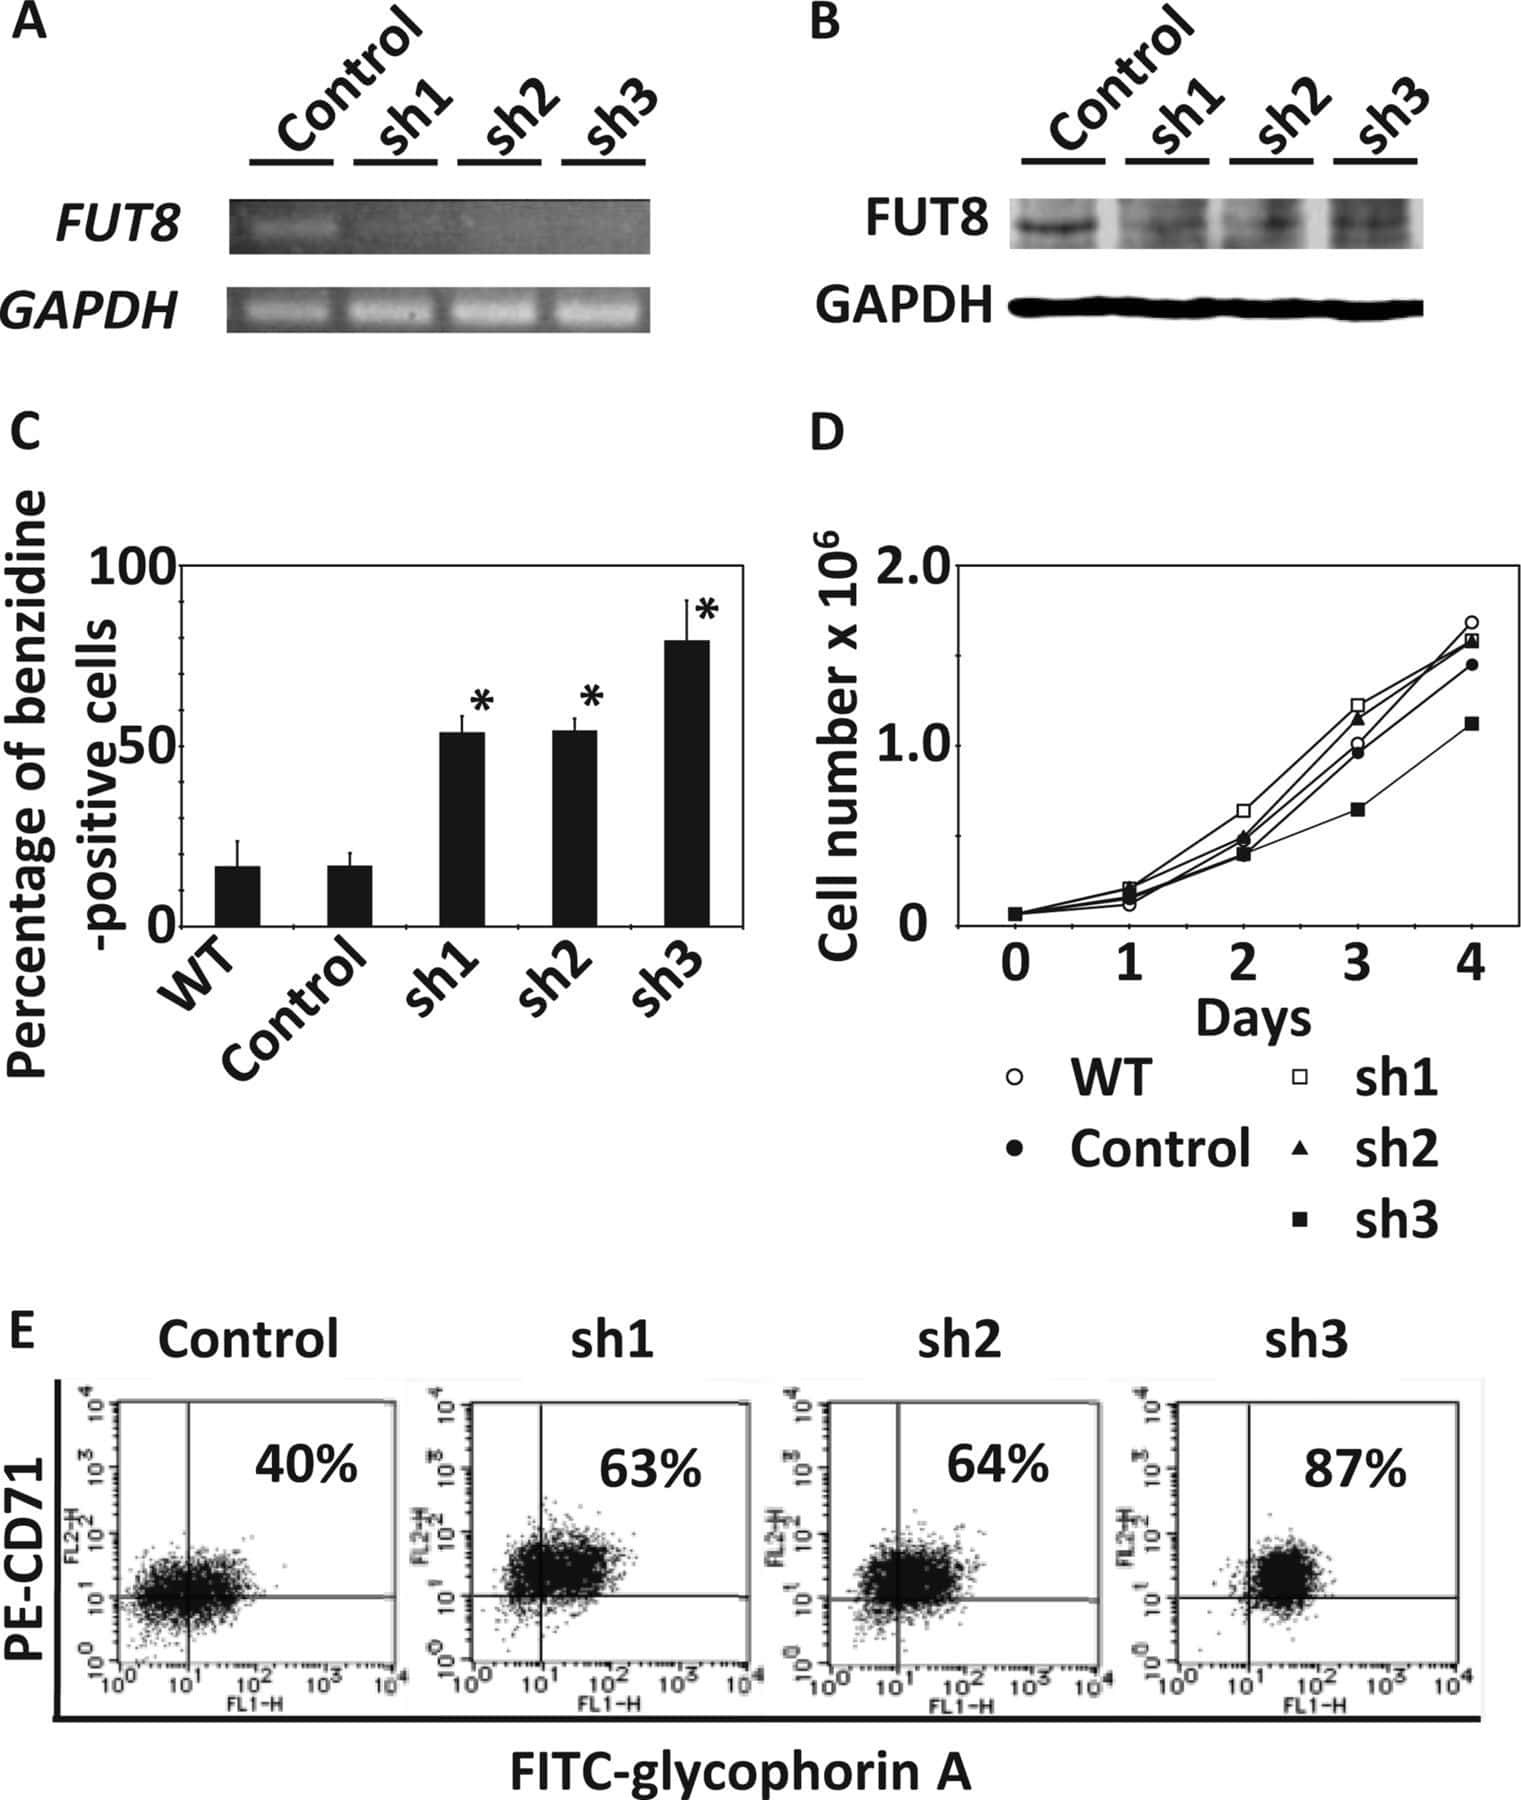
α-1,6-Fucosyltransferase (FUT8) inhibits hemoglobin production during differentiation of murine and K562 human erythroleukemia cells.
Erythroid-specific expression of β-globin from Sleeping Beauty-transduced human hematopoietic progenitor cells.
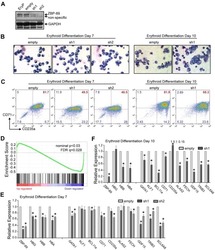
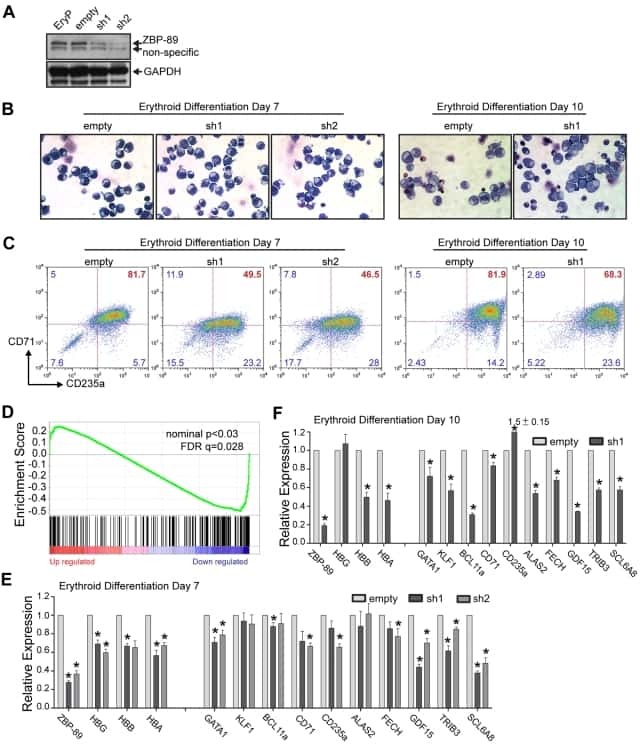
Role of ZBP-89 in human globin gene regulation and erythroid differentiation.
A whole-genome RNAi screen identifies an 8q22 gene cluster that inhibits death receptor-mediated apoptosis.
Human transferrin receptor is active and plasma membrane-targeted in yeast.
Transferrin receptor mediates uptake and presentation of hepatitis B envelope antigen by T lymphocytes.
Cornelison RC, Yuan JX, Tate KM, Petrosky A, Beeghly GF, Bloomfield M, Schwager SC, Berr AL, Stine CA, Cimini D, Bafakih FF, Mandell JW, Purow BW, Horton BJ, Munson JM
NPJ precision oncology 2022 Jul 29;6(1):54
NPJ precision oncology 2022 Jul 29;6(1):54
A group B Streptococcus alpha-like protein subunit vaccine induces functionally active antibodies in humans targeting homotypic and heterotypic strains.
Pawlowski A, Lannergård J, Gonzalez-Miro M, Cao D, Larsson S, Persson JJ, Kitson G, Darsley M, Rom AL, Hedegaard M, Fischer PB, Johansson-Lindbom B
Cell reports. Medicine 2022 Feb 15;3(2):100511
Cell reports. Medicine 2022 Feb 15;3(2):100511
Rapid increase in transferrin receptor recycling promotes adhesion during T cell activation.
Rossatti P, Redpath GMI, Ziegler L, Samson GPB, Clamagirand CD, Legler DF, Rossy J
BMC biology 2022 Aug 24;20(1):189
BMC biology 2022 Aug 24;20(1):189
Gene-centric functional dissection of human genetic variation uncovers regulators of hematopoiesis.
Nandakumar SK, McFarland SK, Mateyka LM, Lareau CA, Ulirsch JC, Ludwig LS, Agarwal G, Engreitz JM, Przychodzen B, McConkey M, Cowley GS, Doench JG, Maciejewski JP, Ebert BL, Root DE, Sankaran VG
eLife 2019 May 9;8
eLife 2019 May 9;8
Transcriptional States and Chromatin Accessibility Underlying Human Erythropoiesis.
Ludwig LS, Lareau CA, Bao EL, Nandakumar SK, Muus C, Ulirsch JC, Chowdhary K, Buenrostro JD, Mohandas N, An X, Aryee MJ, Regev A, Sankaran VG
Cell reports 2019 Jun 11;27(11):3228-3240.e7
Cell reports 2019 Jun 11;27(11):3228-3240.e7
Methods for Systematic Identification of Membrane Proteins for Specific Capture of Cancer-Derived Extracellular Vesicles.
Zaborowski MP, Lee K, Na YJ, Sammarco A, Zhang X, Iwanicki M, Cheah PS, Lin HY, Zinter M, Chou CY, Fulci G, Tannous BA, Lai CP, Birrer MJ, Weissleder R, Lee H, Breakefield XO
Cell reports 2019 Apr 2;27(1):255-268.e6
Cell reports 2019 Apr 2;27(1):255-268.e6
GATA/Heme Multi-omics Reveals a Trace Metal-Dependent Cellular Differentiation Mechanism.
Tanimura N, Liao R, Wilson GM, Dent MR, Cao M, Burstyn JN, Hematti P, Liu X, Zhang Y, Zheng Y, Keles S, Xu J, Coon JJ, Bresnick EH
Developmental cell 2018 Sep 10;46(5):581-594.e4
Developmental cell 2018 Sep 10;46(5):581-594.e4
Blocking transferrin receptor inhibits the growth of lung adenocarcinoma cells in vitro.
Wu Y, Xu J, Chen J, Zou M, Rusidanmu A, Yang R
Thoracic cancer 2018 Feb;9(2):253-261
Thoracic cancer 2018 Feb;9(2):253-261
Genetically engineered red cells expressing single domain camelid antibodies confer long-term protection against botulinum neurotoxin.
Huang NJ, Pishesha N, Mukherjee J, Zhang S, Deshycka R, Sudaryo V, Dong M, Shoemaker CB, Lodish HF
Nature communications 2017 Sep 4;8(1):423
Nature communications 2017 Sep 4;8(1):423
Functional Selectivity in Cytokine Signaling Revealed Through a Pathogenic EPO Mutation.
Kim AR, Ulirsch JC, Wilmes S, Unal E, Moraga I, Karakukcu M, Yuan D, Kazerounian S, Abdulhay NJ, King DS, Gupta N, Gabriel SB, Lander ES, Patiroglu T, Ozcan A, Ozdemir MA, Garcia KC, Piehler J, Gazda HT, Klein DE, Sankaran VG
Cell 2017 Mar 9;168(6):1053-1064.e15
Cell 2017 Mar 9;168(6):1053-1064.e15
miRNA profiling of human naive CD4 T cells links miR-34c-5p to cell activation and HIV replication.
Amaral AJ, Andrade J, Foxall RB, Matoso P, Matos AM, Soares RS, Rocha C, Ramos CG, Tendeiro R, Serra-Caetano A, Guerra-Assunção JA, Santa-Marta M, Gonçalves J, Gama-Carvalho M, Sousa AE
The EMBO journal 2017 Feb 1;36(3):346-360
The EMBO journal 2017 Feb 1;36(3):346-360
Hormonal vitamin D up-regulates tissue-specific PD-L1 and PD-L2 surface glycoprotein expression in humans but not mice.
Dimitrov V, Bouttier M, Boukhaled G, Salehi-Tabar R, Avramescu RG, Memari B, Hasaj B, Lukacs GL, Krawczyk CM, White JH
The Journal of biological chemistry 2017 Dec 15;292(50):20657-20668
The Journal of biological chemistry 2017 Dec 15;292(50):20657-20668
Activation of KLF1 Enhances the Differentiation and Maturation of Red Blood Cells from Human Pluripotent Stem Cells.
Yang CT, Ma R, Axton RA, Jackson M, Taylor AH, Fidanza A, Marenah L, Frayne J, Mountford JC, Forrester LM
Stem cells (Dayton, Ohio) 2017 Apr;35(4):886-897
Stem cells (Dayton, Ohio) 2017 Apr;35(4):886-897
Targeted Application of Human Genetic Variation Can Improve Red Blood Cell Production from Stem Cells.
Giani FC, Fiorini C, Wakabayashi A, Ludwig LS, Salem RM, Jobaliya CD, Regan SN, Ulirsch JC, Liang G, Steinberg-Shemer O, Guo MH, Esko T, Tong W, Brugnara C, Hirschhorn JN, Weiss MJ, Zon LI, Chou ST, French DL, Musunuru K, Sankaran VG
Cell stem cell 2016 Jan 7;18(1):73-78
Cell stem cell 2016 Jan 7;18(1):73-78
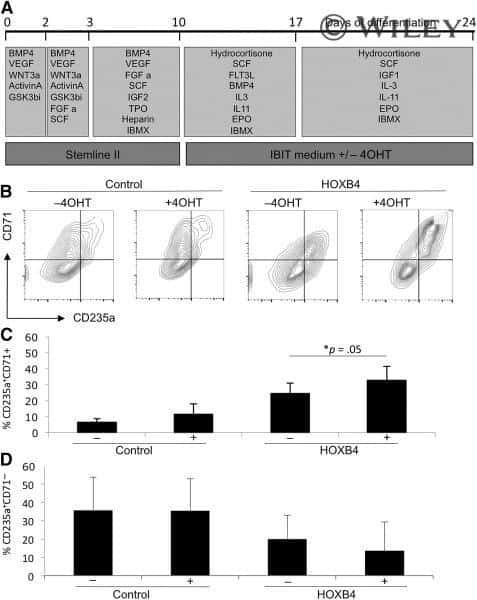
Enforced Expression of HOXB4 in Human Embryonic Stem Cells Enhances the Production of Hematopoietic Progenitors but Has No Effect on the Maturation of Red Blood Cells.
Jackson M, Ma R, Taylor AH, Axton RA, Easterbrook J, Kydonaki M, Olivier E, Marenah L, Stanley EG, Elefanty AG, Mountford JC, Forrester LM
Stem cells translational medicine 2016 Aug;5(8):981-90
Stem cells translational medicine 2016 Aug;5(8):981-90
The tryptophan metabolite picolinic acid suppresses proliferation and metabolic activity of CD4+ T cells and inhibits c-Myc activation.
Prodinger J, Loacker LJ, Schmidt RL, Ratzinger F, Greiner G, Witzeneder N, Hoermann G, Jutz S, Pickl WF, Steinberger P, Marculescu R, Schmetterer KG
Journal of leukocyte biology 2016 Apr;99(4):583-94
Journal of leukocyte biology 2016 Apr;99(4):583-94
DECKO: Single-oligo, dual-CRISPR deletion of genomic elements including long non-coding RNAs.
Aparicio-Prat E, Arnan C, Sala I, Bosch N, Guigó R, Johnson R
BMC genomics 2015 Oct 23;16:846
BMC genomics 2015 Oct 23;16:846
PPAR-α and glucocorticoid receptor synergize to promote erythroid progenitor self-renewal.
Lee HY, Gao X, Barrasa MI, Li H, Elmes RR, Peters LL, Lodish HF
Nature 2015 Jun 25;522(7557):474-7
Nature 2015 Jun 25;522(7557):474-7
Functional plasticity of the N-methyl-d-aspartate receptor in differentiating human erythroid precursor cells.
Hänggi P, Telezhkin V, Kemp PJ, Schmugge M, Gassmann M, Goede JS, Speer O, Bogdanova A
American journal of physiology. Cell physiology 2015 Jun 15;308(12):C993-C1007
American journal of physiology. Cell physiology 2015 Jun 15;308(12):C993-C1007
Structure-function analysis of heterodimer formation, oligomerization, and receptor binding of the Staphylococcus aureus bi-component toxin LukGH.
Badarau A, Rouha H, Malafa S, Logan DT, Håkansson M, Stulik L, Dolezilkova I, Teubenbacher A, Gross K, Maierhofer B, Weber S, Jägerhofer M, Hoffman D, Nagy E
The Journal of biological chemistry 2015 Jan 2;290(1):142-56
The Journal of biological chemistry 2015 Jan 2;290(1):142-56
Developmental transcriptome analysis of human erythropoiesis.
Shi L, Lin YH, Sierant MC, Zhu F, Cui S, Guan Y, Sartor MA, Tanabe O, Lim KC, Engel JD
Human molecular genetics 2014 Sep 1;23(17):4528-42
Human molecular genetics 2014 Sep 1;23(17):4528-42
The cyclin dependent kinase inhibitor (R)-roscovitine mediates selective suppression of alloreactive human T cells but preserves pathogen-specific and leukemia-specific effectors.
Nellore A, Liu B, Patsoukis N, Boussiotis VA, Li L
Clinical immunology (Orlando, Fla.) 2014 May-Jun;152(1-2):48-57
Clinical immunology (Orlando, Fla.) 2014 May-Jun;152(1-2):48-57
A feedback loop consisting of microRNA 23a/27a and the β-like globin suppressors KLF3 and SP1 regulates globin gene expression.
Ma Y, Wang B, Jiang F, Wang D, Liu H, Yan Y, Dong H, Wang F, Gong B, Zhu Y, Dong L, Yin H, Zhang Z, Zhao H, Wu Z, Zhang J, Zhou J, Yu J
Molecular and cellular biology 2013 Oct;33(20):3994-4007
Molecular and cellular biology 2013 Oct;33(20):3994-4007
Lysine-specific demethylase 1 is a therapeutic target for fetal hemoglobin induction.
Shi L, Cui S, Engel JD, Tanabe O
Nature medicine 2013 Mar;19(3):291-4
Nature medicine 2013 Mar;19(3):291-4
α-1,6-Fucosyltransferase (FUT8) inhibits hemoglobin production during differentiation of murine and K562 human erythroleukemia cells.
Sasaki H, Toda T, Furukawa T, Mawatari Y, Takaesu R, Shimizu M, Wada R, Kato D, Utsugi T, Ohtsu M, Murakami Y
The Journal of biological chemistry 2013 Jun 7;288(23):16839-16847
The Journal of biological chemistry 2013 Jun 7;288(23):16839-16847
Erythroid-specific expression of β-globin from Sleeping Beauty-transduced human hematopoietic progenitor cells.
Sjeklocha LM, Park CW, Wong PY, Roney MJ, Belcher JD, Kaufman DS, Vercellotti GM, Hebbel RP, Steer CJ
PloS one 2011;6(12):e29110
PloS one 2011;6(12):e29110
Role of ZBP-89 in human globin gene regulation and erythroid differentiation.
Woo AJ, Kim J, Xu J, Huang H, Cantor AB
Blood 2011 Sep 29;118(13):3684-93
Blood 2011 Sep 29;118(13):3684-93
A whole-genome RNAi screen identifies an 8q22 gene cluster that inhibits death receptor-mediated apoptosis.
Dompe N, Rivers CS, Li L, Cordes S, Schwickart M, Punnoose EA, Amler L, Seshagiri S, Tang J, Modrusan Z, Davis DP
Proceedings of the National Academy of Sciences of the United States of America 2011 Oct 25;108(43):E943-51
Proceedings of the National Academy of Sciences of the United States of America 2011 Oct 25;108(43):E943-51
Human transferrin receptor is active and plasma membrane-targeted in yeast.
Terng HJ, Gessner R, Fuchs H, Stahl U, Lang C
FEMS microbiology letters 1998 Mar 1;160(1):61-7
FEMS microbiology letters 1998 Mar 1;160(1):61-7
Transferrin receptor mediates uptake and presentation of hepatitis B envelope antigen by T lymphocytes.
Franco A, Paroli M, Testa U, Benvenuto R, Peschle C, Balsano F, Barnaba V
The Journal of experimental medicine 1992 May 1;175(5):1195-205
The Journal of experimental medicine 1992 May 1;175(5):1195-205
No comments: Submit comment
Supportive validation
- Submitted by
- Invitrogen Antibodies (provider)
- Main image

- Experimental details
- Staining of 3-day anti-CD3/CD28-stimulated normal human peripheral blood cells with Mouse IgG1 kappa Isotype Control PE (Product # 12-4714-81) (blue histogram) or Anti-Human CD71 (Transferrin Receptor) PE (purple histogram). Total viable cells were used for analysis.
- Conjugate
- Yellow dye

Supportive validation
- Submitted by
- Invitrogen Antibodies (provider)
- Main image

- Experimental details
- NULL
- Conjugate
- Yellow dye
- Submitted by
- Invitrogen Antibodies (provider)
- Main image
- Experimental details
- NULL
- Conjugate
- Yellow dye
- Submitted by
- Invitrogen Antibodies (provider)
- Main image
- Experimental details
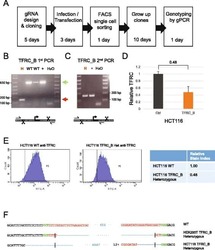
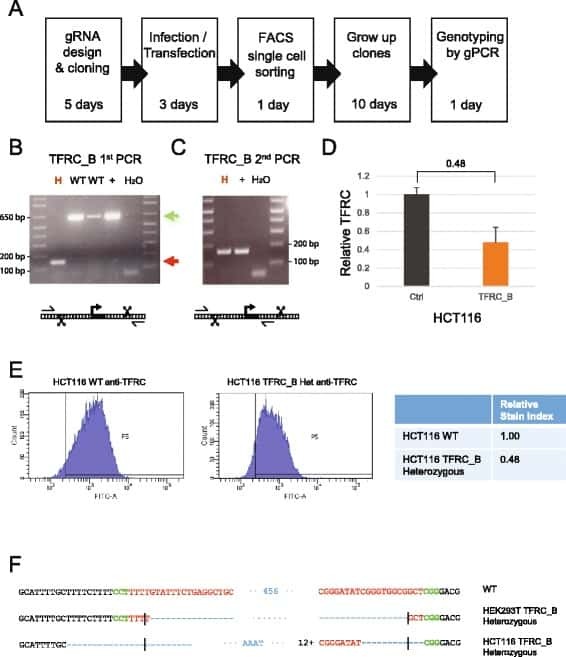
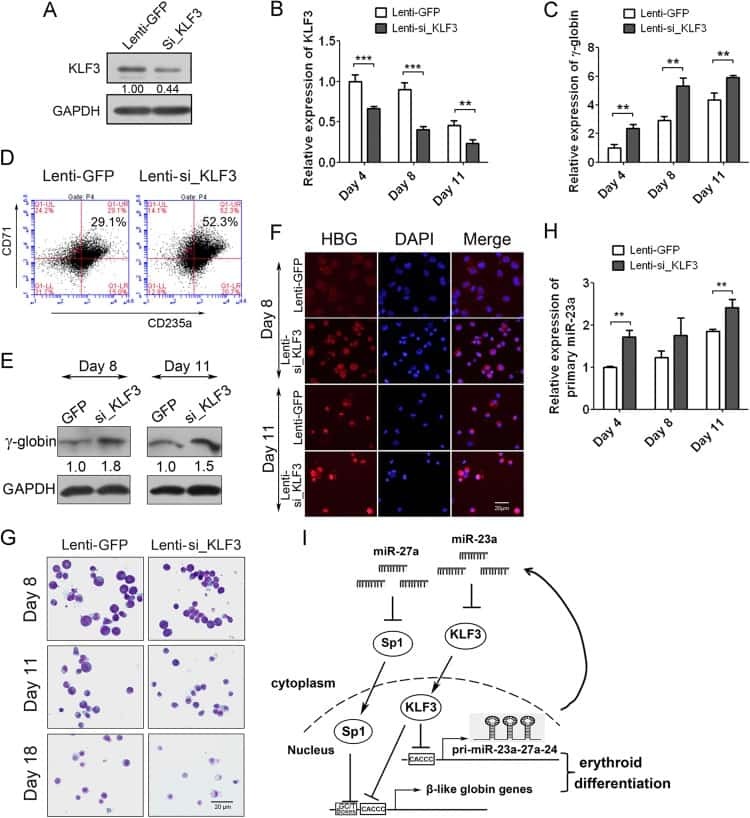
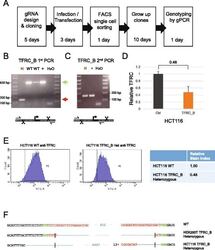
- Fig. 5 Derivation of TFRC cell clones. a Outline of the clone-derivation protocol used for TFRC and MALAT1 knock out cells, indicating approximate time required. b First and c second stage PCRs to genotype clones. Primer combination schemes are indicated below the electrophoresis gels. H: TFRC_B cell clone genotyped as heterozygote; WT, cell clones genotyped as wild type; +, positive control wild type cells; H 2 O, water. d qRTPCR for TFRC mRNA, normalised to GAPDH. Error bars indicate the standard deviation of three technical replicates. e Flow cytometry analysis of surface levels of TFRC protein. Left : histogram of cell fluorescence intensity counts. Right : Calculation of relative stain index. f Sequencing analysis of mutant junction of the heterozygous clones. In red, region complementary to the gRNA variable region; Green, PAM sequences; Blue, indel. Expected cut location is marked with vertical bar
- Conjugate
- Yellow dye
- Submitted by
- Invitrogen Antibodies (provider)
- Main image
- Experimental details
- NULL
- Conjugate
- Yellow dye
- Submitted by
- Invitrogen Antibodies (provider)
- Main image

- Experimental details
- NULL
- Conjugate
- Yellow dye
- Submitted by
- Invitrogen Antibodies (provider)
- Main image

- Experimental details
- NULL
- Conjugate
- Yellow dye
- Submitted by
- Invitrogen Antibodies (provider)
- Main image

- Experimental details
- NULL
- Conjugate
- Yellow dye
- Submitted by
- Invitrogen Antibodies (provider)
- Main image

- Experimental details
- NULL
- Conjugate
- Yellow dye
- Submitted by
- Invitrogen Antibodies (provider)
- Main image
- Experimental details
- NULL
- Conjugate
- Yellow dye
- Submitted by
- Invitrogen Antibodies (provider)
- Main image
- Experimental details
- NULL
- Conjugate
- Yellow dye

- Submitted by
- Invitrogen Antibodies (provider)
- Main image
- Experimental details
- NULL
- Conjugate
- Yellow dye

- Submitted by
- Invitrogen Antibodies (provider)
- Main image

- Experimental details
- NULL
- Conjugate
- Yellow dye
- Submitted by
- Invitrogen Antibodies (provider)
- Main image

- Experimental details
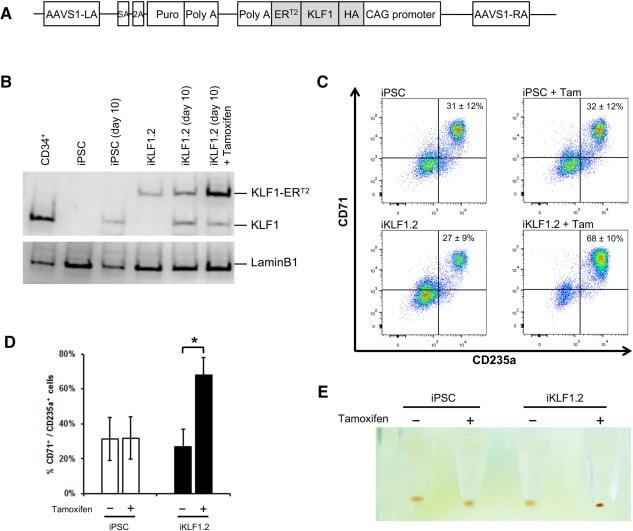
- Figure 3 Activation of KLF1 at day 10 of differentiation results in enhanced erythroid differentiation of hiPSCs. (A) : Schematic of the pZDonor-AAVS1 Puro-CAG-HA-KLF1-ER T2 -PA construct. (B) : Western blot analyses of nuclear cell lysates from adult CD34 + cells that had been differentiated for 6 days into erythroid progenitors, control undifferentiated and differentiated (day 10) induced pluripotent stem cells (iPSCs), undifferentiated iKLF1.2 iPSCs and iKLF1.2 iPSC that had been differentiated for 10 days then treated with tamoxifen for 3 hours. Endogenous KLF1 and the expected larger sized KLF1-ER T2 fusion protein was detected with the anti-KLF1 antibody and the anti-Lamin B1 antibody was used to detect nuclear proteins as a loading control. (C) : Flow cytometry analysis using antibodies against CD235a and CD71 of cells present at day 15 of the erythroid differentiation protocol in control iPSCs and iKLF1.2 iPSC cell lines in the presence (+) and absence (-) of tamoxifen from day 10. ( D) : Quantitation of flow cytometry data representing three independent experiments. Error bars represent SEM. p values were calculated using one-way ANOVA followed by Holm-Sidak's multiple comparison test (* p < .05). ( E) : Image showing the cell pellets from one representative experiment demonstrating a smaller but more intense red pellet in the tamoxifen-treated iKLF1.2 cell line. Abbreviation: iPSCs, induced pluripotent stem cells.
- Conjugate
- Yellow dye
- Submitted by
- Invitrogen Antibodies (provider)
- Main image
- Experimental details
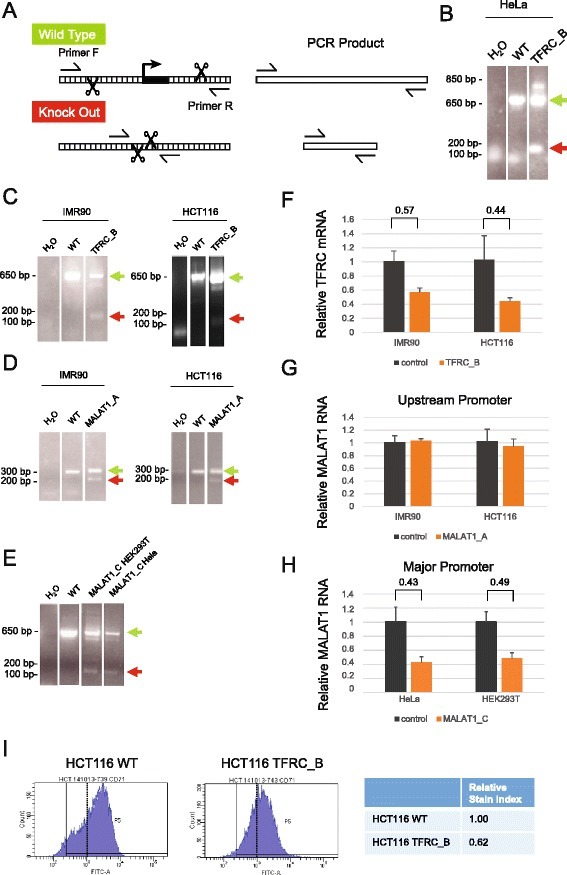
- Fig. 4 Sequence deletion in bulk cells. a Outline of the genomic PCR (gPCR) primer strategy used for genotyping. b Deletion of TFRC promoter (construct B in Fig. 2 ), as validated by electrophoresis of gPCR products. Wild type gDNA and water templates are used as positive and negative controls, respectively. Green and red arrows indicate the size of PCR products expected from wild type (WT) and deleted alleles. Note that in this and subsequent panels, separated lanes originate from the same original agarose gel, rearranged for clarity. c - e gPCR on bulk cells transfected with the indicated DECKO plasmids targeting ( c ) TFRC promoter, ( d ) MALAT1 upstream promoter, ( e ) MALAT1 major promoter. ( f - h ) qRTPCR on cell samples shown in ( c - e ). Control indicates RNA from cells transfected with a DECKO targeting GFP. Levels were normalised to GAPDH. Error bars show the standard deviation of three technical replicates. i Expression of TFRC protein on cell surface, as determined by flow cytometry analysis of antibody-stained cells. Left : histogram of cell fluorescence intensity counts. Right : Calculation of relative stain index, a normalised measure of fluorescence intensity
- Conjugate
- Yellow dye
- Submitted by
- Invitrogen Antibodies (provider)
- Main image
- Experimental details
- Fig. 5 Derivation of TFRC cell clones. a Outline of the clone-derivation protocol used for TFRC and MALAT1 knock out cells, indicating approximate time required. b First and c second stage PCRs to genotype clones. Primer combination schemes are indicated below the electrophoresis gels. H: TFRC_B cell clone genotyped as heterozygote; WT, cell clones genotyped as wild type; +, positive control wild type cells; H 2 O, water. d qRTPCR for TFRC mRNA, normalised to GAPDH. Error bars indicate the standard deviation of three technical replicates. e Flow cytometry analysis of surface levels of TFRC protein. Left : histogram of cell fluorescence intensity counts. Right : Calculation of relative stain index. f Sequencing analysis of mutant junction of the heterozygous clones. In red, region complementary to the gRNA variable region; Green, PAM sequences; Blue, indel. Expected cut location is marked with vertical bar
- Conjugate
- Yellow dye

- Submitted by
- Invitrogen Antibodies (provider)
- Main image
- Experimental details
- Fig. 5 Characterization of in vitro-differentiated human RBCs. a The proliferation curve of human RBCs. ( n = 3, mean +- S.E.M.). b Differentiating cells were characterized by flow cytometry for c-kit, CD71, CD235A, and Hoechst at the end of each culture stage. c Giemsa and hemoglobin staining of human RBCs at the end of each culture stage. d In vitro-differentiated human RBCs circulate for up to 7 days in macrophage-depleted NOD/SCID mice. Five hundred million six-stage cultured RBCs were labeled with CFSE and injected intravenously into NOD/SCID mice that have been treated with clodronate liposomes. The recipient mice were then bled at the indicated time points as indicated for further flow cytometric analyses. The transfused human RBCs were identified by tracing CFSE and CD235A expression
- Conjugate
- Yellow dye

- Submitted by
- Invitrogen Antibodies (provider)
- Main image

- Experimental details
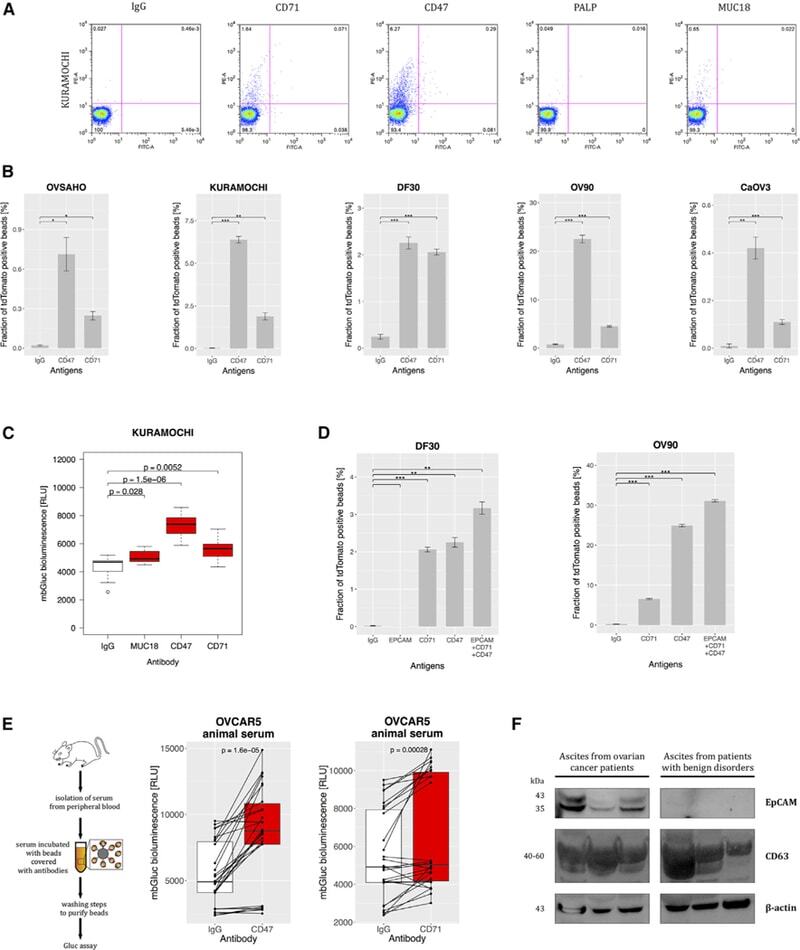
- Figure 5 CD47, CD71, and EpCAM Are Expressed on Ovarian Cancer-Derived EVs (A) Flow cytometry of the beads covered with IgG and antibodies against CD71, CD47, PALP, or MUC18 incubated with the medium conditioned by Kuramochi cells (palmtdTomato positive) (charts representative of three experiments). (B) Fraction of palmtdTomato-positive beads depending on CD47 and CD71 expression on EVs from the panel of five cell lines (n = 3). (C) mbGluc activity from beads with EVs captured by antibodies against MUC18, CD47, and CD71 from conditioned medium of Kuramochi cells (following removal of cells; n = 3). (D) Fraction of palmtdTomato-positive beads depending on antigen expression on EVs from DF30 and OV90 cell lines (n = 3). (E) Diagram of in vivo experiment to measure capture of EVs from serum of OVCAR5 tumor-bearing animal (left) and mbGluc activity from beads with EVs depending on the antigen expression (right) (n = 3 animals, two serum samples were processed from each animal, bioluminescence read in three to five technical replicates). (F) EVs were isolated by differential centrifugation and filtration steps from ascites from patients with ovarian cancer (n = 3) and with benign conditions such as cirrhosis or hepatitis (n = 3). Proteins were resolved by SDS-PAGE and stained with antibodies to EpCAM, CD63, and B(beta)-actin and detected with chemiluminescence. See also Figure S3 .
- Conjugate
- Yellow dye
- Submitted by
- Invitrogen Antibodies (provider)
- Main image
- Experimental details
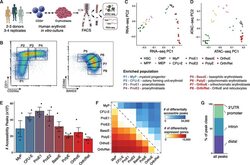
- Figure 1. An Epigenomic and Transcriptional Time Course of Human Erythroid Differentiation (A) Schematic outline of generating matched transcriptome and open chromatin profiles across human erythropoiesis. (B) FACS gating scheme showing expression of surface markers CD71, CD235a, CD49d, and BAND3 used to sort indicated populations P1-P8 (P1, MyP; P2, CFU-E; P3, ProE1; P4, ProE1; P5, BasoE; P6, PolyE; P7, OrthoE; P8, Ortho/Ret). (C and D) Principal-components plots of (C) RNA-seq data and (D) ATAC-seq data, colored by FACS-sorted populations. Color code indicated below. (E) Number of chromatin accessibility peaks across populations. Error bars represent SEM number of peaks per population between replicates. (F) Heatmap showing relative numbers of differentially accessible peaks (top, blue shades) and differentially expressed genes (bottom, red shade) between populations.
- Conjugate
- Yellow dye

- Submitted by
- Invitrogen Antibodies (provider)
- Main image
- Experimental details
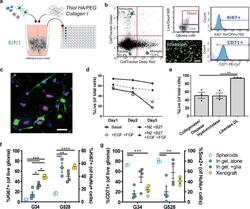
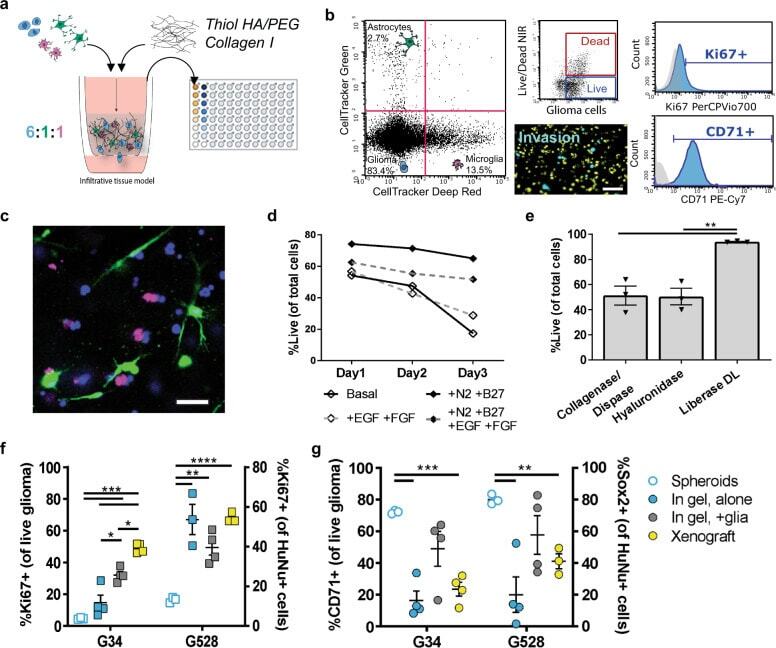
- Tunable model of the human invasive TME enables multiplexed analysis of glioma markers and comparison to in vivo marker expression. a Diagram of brain TME model setup using patient-derived GSCs, human astrocytes, and human microglia in a hyaluronan-based matrix and 96-well tissue culture insert format. b Representative flow cytometry plots showing the ability to distinguish astrocyte, microglia, and glioma cell populations and determine glioma-specific proliferation (Ki67 + ), stemness (CD71 + ), and cell death. Isotype controls are shown in gray. Also shown is a representative fluorescence image of the porous membrane for invasion quantification. Scale bar is 50 um. c Representative fluorescence image within the gel with glioma cells (blue), astrocytes (green), and microglia (magenta). Scale bar is 50 um. d Quantification of cell viability under different media formulations for up to three days in hydrogel culture. e Quantification of cell viability following different enzymatic gel degradation protocols. f , g Comparison of %Ki67 + cells ( f ) and %CD71 + cells ( g ) for three in vitro cancer models and in vivo xenograft implants. In vitro data obtained by flow cytometry; in vivo data obtained from tissue sections, with the tumor border visually demarcated based on nuclear staining. Legends in f , g are the same. Comparisons conducted by unpaired t -tests, * p < 0.05 and ** p < 0.01 for n = 3-4.
- Conjugate
- Yellow dye
- Submitted by
- Invitrogen Antibodies (provider)
- Main image
- Experimental details
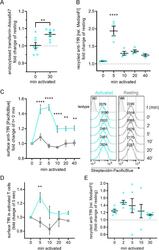
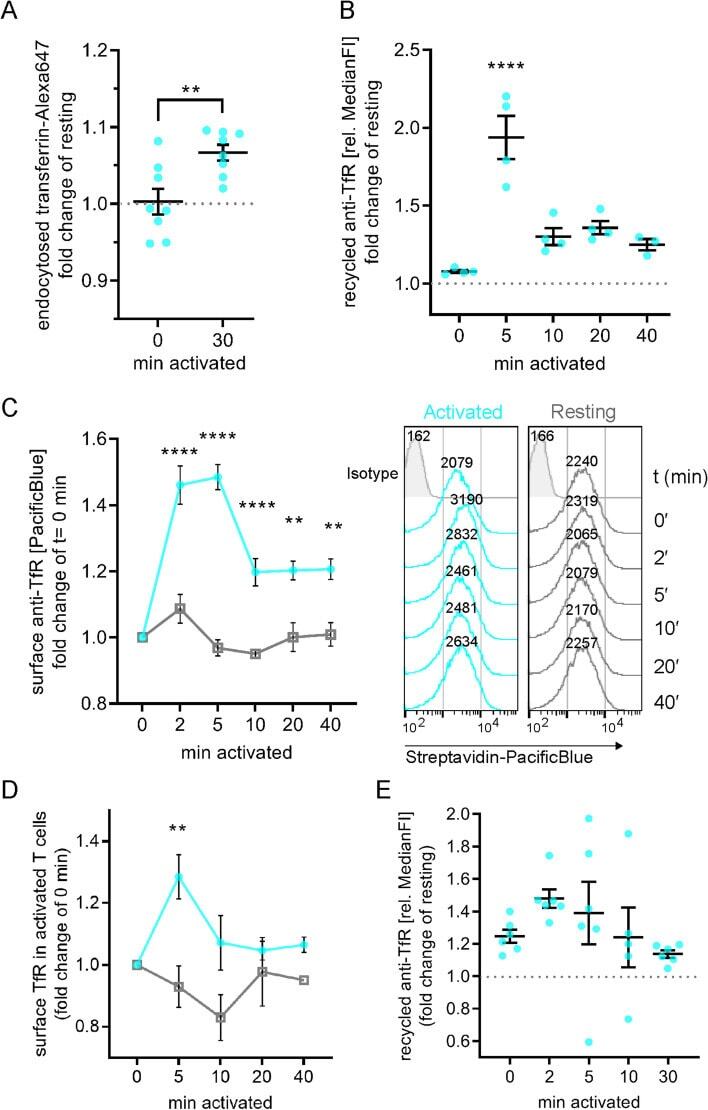
- Fig. 1 T cell activation stimulates uptake and recycling of transferrin and TfR. A Transferrin uptake stimulation upon T cell activation. Jurkat T cells were equilibrated at 37 degC in the presence of transferrin-Alexa647 and subsequently left untouched (resting), or 30 min treated with non-stimulating solution (0 min activated) or 30 min stimulated with activating antibodies anti-CD3epsilon + anti-CD28. Uptake was stopped on ice and cells were analysed for transferrin-Alexa647 uptake. Displayed is the fold-change of Alexa647 signal relative to untouched (resting) controls. B Transiently boosted TfR recycling upon T cell activation. Jurkat T cells were incubated with biotinylated anti-TfR for 90 min to label all TfR pools with antibodies. Then, surface-exposed anti-TfR-biotin was blocked with unlabelled streptavidin. To assess TfR recycling upon activation, cells were activated with soluble activating antibodies (anti-CD3epsilon + anti-CD28) or left untreated for the indicated times. Antibody-labelled TfR delivered to the surface was detected with Pacific Blue-labelled streptavidin. Fold change of bound streptavidin-Pacific Blue in activated T cells is depicted relative to the corresponding resting cells. C Increased surface TfR levels upon T cell activation correlates with boosted TfR recycling. Jurkat T cells were activated with soluble activating antibodies (anti-CD3epsilon + anti-CD28) or left untreated for the indicated times and immediately fixed with 3.7% paraformaldeh
- Conjugate
- Yellow dye
- Submitted by
- Invitrogen Antibodies (provider)
- Main image
- Experimental details
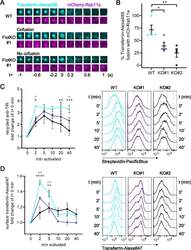
- TfR surface delivery and boosted recycling relies on flotillins. A Representative TIRF images of transferrin-Alexa488 (cyan) vesicle co-fusion events with mCherry Rab11a (magenta) in WT Jurkat T cells (top) or fusion with (middle) or without (bottom) mCherry-Rab11a in FlotKO Jurkat T cells. B Quantification of the percentage of transferrin-Alexa488 fusion events containing mCherry-Rab11a in WT and two FlotKO Jurkat T cell lines. Fusion events were counted as containing the indicated protein if a decrease in maximum intensity from the last three frames was greater than 10% compared to the maximum intensity of the initial frame. Data points represent means of independent experiments. C Quantification of TfR recycling boost in WT and FlotKO Jurkat T cells upon activation (left) and representative histograms (right) of n = 4 independent experiments. Cells were incubated with biotinylated anti-TfR for 90 min to label all TfR pools with antibodies. Then, surface-exposed anti-TfR-biotin was blocked with unlabelled streptavidin. To assess TfR recycling, cells were activated with soluble antibodies (anti-CD3epsilon + anti-CD28) or left untreated for the indicated times. Antibody-labelled TfR delivered to the surface was detected with Pacific Blue-labelled streptavidin. Fold change of bound streptavidin-Pacific Blue in activated T cells is depicted relative to resting cells at timepoint 0 min. D Increased surface TfR levels upon T cell activation in WT vs FlotKO Jurkat T cells. Quantif
- Conjugate
- Yellow dye

- Submitted by
- Invitrogen Antibodies (provider)
- Main image
- Experimental details
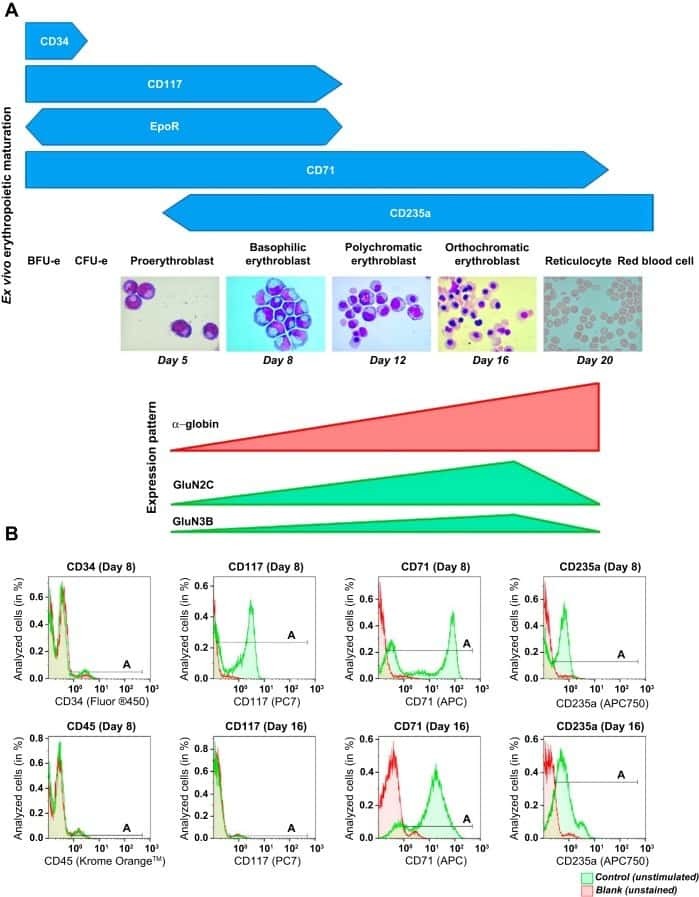
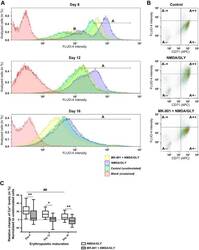
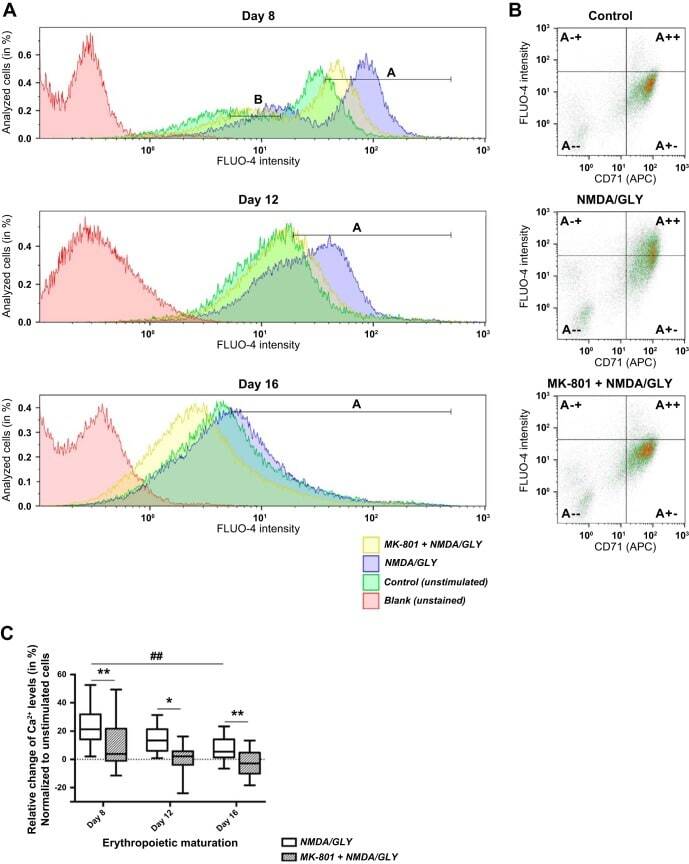
- Fig. 2. Stage-dependent Ca 2+ influx into the EPCs upon stimulation with NMDA and glycine (GLY) in the absence or absence of MK-801. The size of cell population responding to the stimulation with NMDA/GLY (150 muM/50 muM) with Ca 2+ uptake was tested in the EPCs derived from nine different donors at days 8 , 12 , and 16 in culture. Changes in intracellular Ca 2+ were evaluated with Ca 2+ indicator FLUO-4. A : representative histograms showing fluorescence intensity in unstimulated cells (control, shown in green), cells stimulated with NMDA (150 muM) and glycine (50 muM) (NMDA/GLY, in blue), and stimulated cells in the presence (MK-801 + NMDA/GLY, in yellow) of antagonist MK-801 (60 muM). Blank (unstained) readouts from the cells free from fluorophore are shown in red. At day 8 of maturation one population of cells with high FLUO-4 intensity (gate A) and one with low FLUO-4 intensity (gate B) were present. At later stages only one population was present (gate A). Quantification of the data is presented in Table 2 . B : dot plots illustrating relative change of intracellular Ca 2+ levels in CD71 + cells (gate A +- and gate A ++ ). Presented are the representative readouts from the EPCs at day 12 in culture in which Ca 2+ -sensitive fluorescence of FLUO-4 was recorded in unstimulated cells (control), in stimulated (NMDA/GLY) cells, and in stimulated cells in the presence of antagonist (MK-801 + NMDA/GLY). Quantification of the data is presented in Table 3 . C : Ca 2+ uptake by t
- Conjugate
- Yellow dye
- Submitted by
- Invitrogen Antibodies (provider)
- Main image

- Experimental details
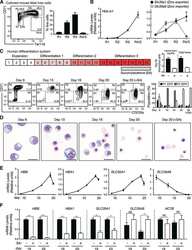
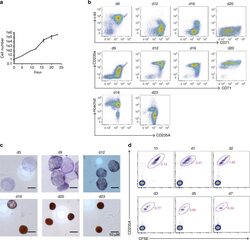
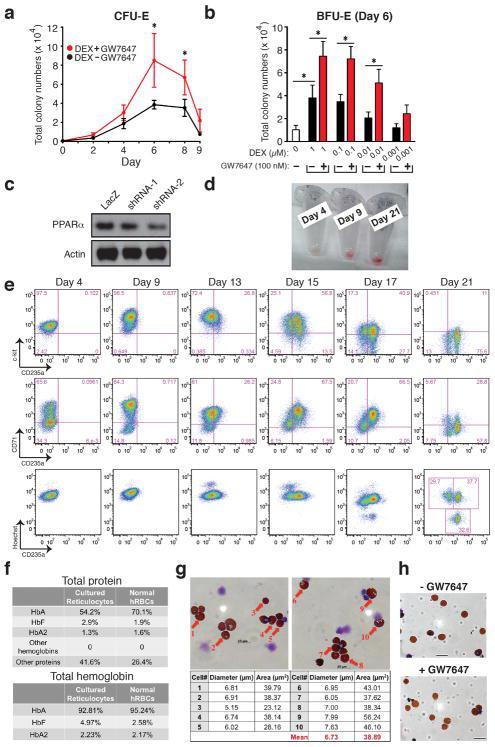
- Extended Figure 2 Human CD34 + Erythroid Differentiation System a , Total CFU-E colonies formed during day 0-9. CFU-E colony numbers were quantified by plating 1000 cells from various time points during day 0-9 of the human CD34 + erythroid culture on methylcellulose. CFU-E colonies were quantified after 12-14 days. Total CFU-E colony numbers in culture under conditions without GW7647 (black line) or with GW7647 (red line) were calculated using the total cell numbers at corresponding time points in Figure 2a. b , Human CD34+ cells were treated at day 1 with 100 nM GW7647 with or without DEX at the concentration indicated in the figure. At day 6, total cell numbers were counted and cells were collected for BFU-E colony assays. c , Protein expression of PPARalpha demonstrating shRNA knock-down efficiency via lentiviral transduction. LacZ shRNA is used as a control. shRNA-1 and -2 are both specific for PPARalpha . shRNA-2 has higher knock-down efficiency. d , Cell pellets of 1 million cells demonstrating hemoglobin accumulation during the differentiation process. e , Flow cytometry analyses of erythroid markers during the 21-day human CD34 + erythroid culture. (top row) c-kit vs. CD235a; (middle row) CD71 vs. CD235a. Note the sequential induction of c-kit, CD71 and CD235a, as well as the sequential down-regulation of c-kit and CD71, (bottom row) Enucleated reticulocytes are CD235a + Hoechst - , nuclei are CD235a - Hoechst + , and nucleated erythroblasts are CD235a + Hoechst + .
- Conjugate
- Yellow dye
- Submitted by
- Invitrogen Antibodies (provider)
- Main image
- Experimental details
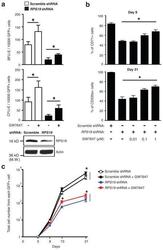
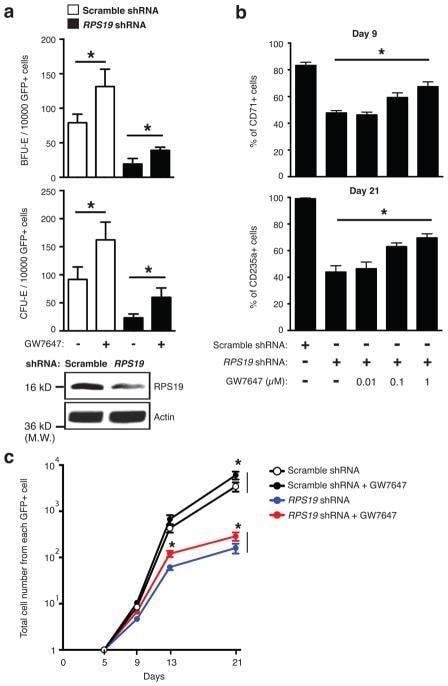
- Extended Figure 3 GW7647 increases erythroid progenitors and CD235a + cells in RPS19 knock down human progenitor cells a , Human CD34 + hematopoietic progenitors were transduced with lentivirus encoding GFP and either a scrambled shRNA or an shRNA targeting RPS19. Then transduced cells were treated with or without 100 nM GW7647. After 48 hrs, GFP + cells were sorted by FACS and plated for BFU-E and CFU-E colony forming assays. RPS19 knocking down efficiency is shown at the bottom. (* p < 0.05; Student t test. Error bars represent mean +- S.D. from three independent experiments.) b. Sorted GFP + cells were returned to culture with the indicated concentration of GW7647. (Top) Percentage of CD71 + cells at day 9 in was determined by FACS; (Bottom) Percentage of CD235a + cells at day 21 was determined by FACS. (* p < 0.05; Student t test. Error bars represent mean +- S.D. from three independent experiments.) c. Total cell numbers generated from one GFP positive cell at the indicated times of culture. (* p < 0.05; Student t test. Error bars represent mean +- S.D. from three independent experiments.)
- Conjugate
- Yellow dye
- Submitted by
- Invitrogen Antibodies (provider)
- Main image
- Experimental details
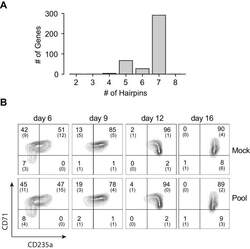
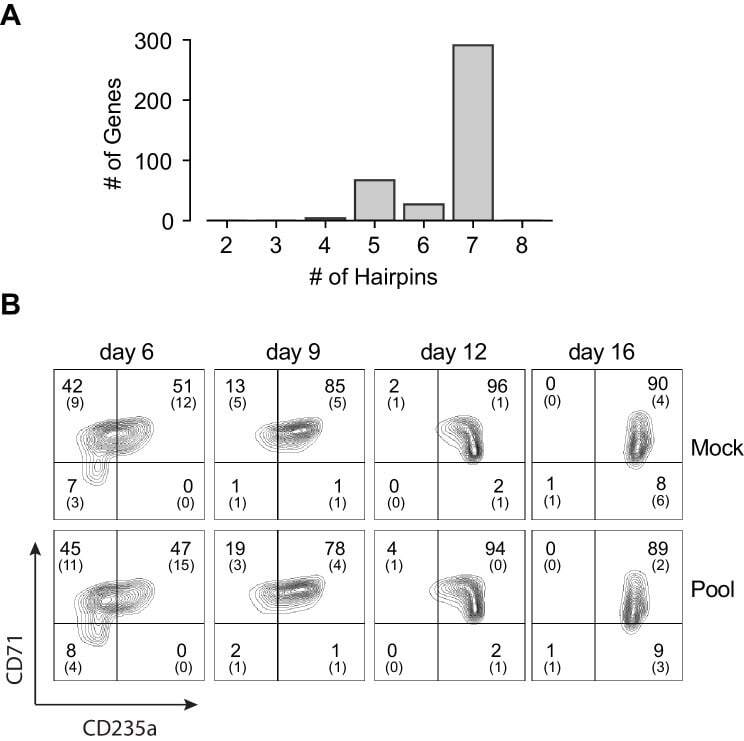
- Figure 1--figure supplement 3. Pooled shRNA screen in primary HSPCs undergoing erythroid differentiation. ( A ) Histogram showing distribution of number of independent hairpins included in the library to target each of the candidate's genes. ( B ) Representative FACS plots of erythroid cell surface markers CD71 (transferrin receptor) and CD235a (Glycophorin A) expression at various time points during erythroid differentiation at which deep sequencing of shRNAs was performed. Percentages in each quadrant is represented as mean and standard deviation of 3 experiments from independent donors that were uninfected (Mock) or infected with the shRNA library (Pool).
- Conjugate
- Yellow dye
- Submitted by
- Invitrogen Antibodies (provider)
- Main image
- Experimental details
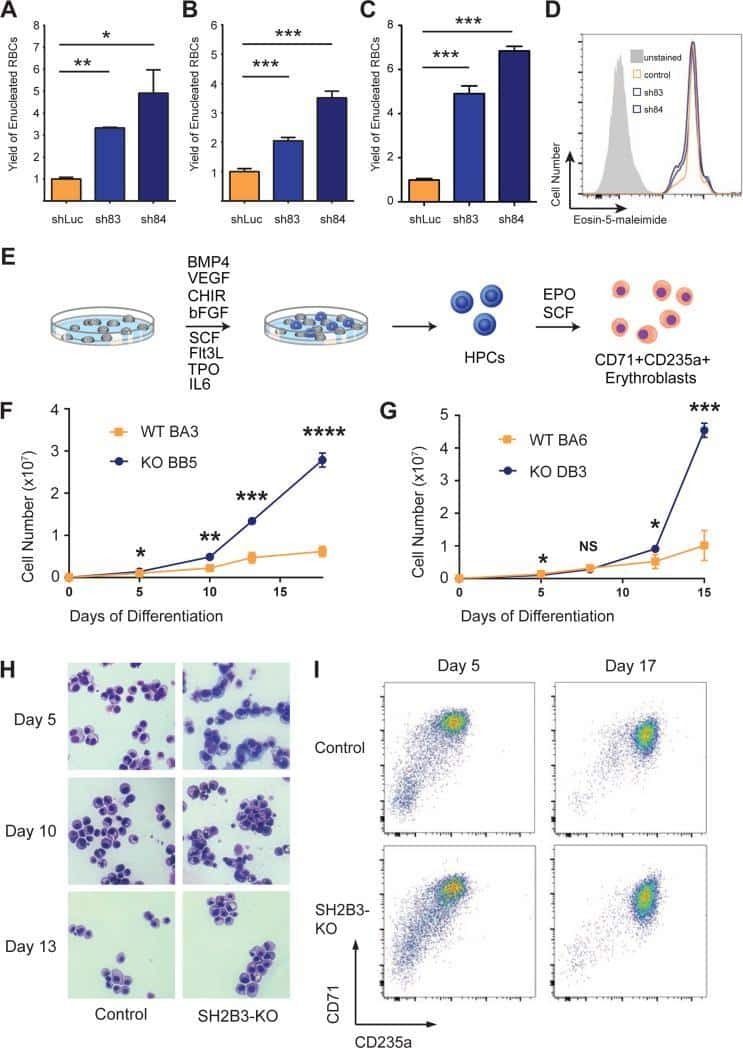
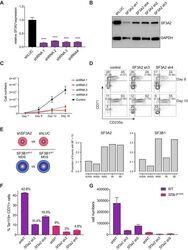
- Figure 6. SF3A2 is a Key regulator of Human Erythropoiesis and Modulates Erythropoiesis Defects in a Murine Model of MDS. ( A ) Quantitative RT-PCR and ( B ) Western blot showing the expression of SF3A2 in human CD34 + cells five days post-infection with the respective lentiviral shRNAs targeting SF3A2 (sh1-4) and a control luciferase gene (shLUC). ( C ) Growth curves showing that downregulation of SF3A2 results in reduced total cell numbers during erythroid differentiation from three independent experiments. ( D ) Representative FACS plots of erythroid cell surface markers CD71 (transferrin receptor) and CD235a (Glycophorin A) expression at various time points during erythroid differentiation. Percentages in each quadrant are represented as mean and standard deviation of three independent experiments ( E ) Altered splicing events identified by RNA-Seq analysis of stage matched erythroid cells (shSF3A2 vs. shLUC). Overlapping changes observed in SF3B1 mutant BM cells from MDS patients (Obeng et al) ( Figure 6--source data 5 and 6 ). Differentially expressed genes and pathway analysis available in Figure 6--source data 1 - 4 . ( F ) Lineage negative bone marrow cells from wildtype (WT) and Sf3b1 K700E mice were infected with shRNAs targeting murine Sf3a2 gene co-expressing a reporter GFP gene. Percentage of Ter119 + CD71 + erythroid cells within the GFP compartment after 48 hr in erythroid differentiation. ( G ) Total cell numbers of GFP + erythroid cells after
- Conjugate
- Yellow dye
