Explore
 Validate
 Learn
Learn Western blot
Antibody data
- Antibody Data
- Antigen structure
- References [3]
- Comments [0]
- Validations
- Western blot [4]
- Immunocytochemistry [1]
- Other assay [2]
Submit
Validation data
Reference
Comment
Report error
- Product number
- PA5-27739 - Provider product page

- Provider
- Invitrogen Antibodies
- Product name
- Transferrin Receptor Polyclonal Antibody
- Antibody type
- Polyclonal
- Antigen
- Recombinant protein fragment
- Description
- Recommended positive controls: Jurkat, Raji, NCI-H929, K562, HL-60, NIH3T3.
- Concentration
- 0.47 mg/mL
Submitted references The LRRK2 signaling network converges on a centriolar phospho-Rab10/RILPL1 complex to cause deficits in centrosome cohesion and cell polarization.
Anthracyclins Increase PUFAs: Potential Implications in ER Stress and Cell Death.
The Protective Role of Mitochondrial Ferritin on Erastin-Induced Ferroptosis.
Lara Ordóñez AJ, Fasiczka R, Fernández B, Naaldijk Y, Fdez E, Blanca Ramírez M, Phan S, Boassa D, Hilfiker S
Biology open 2022 Aug 15;11(8)
Biology open 2022 Aug 15;11(8)
Anthracyclins Increase PUFAs: Potential Implications in ER Stress and Cell Death.
Balgoma D, Kullenberg F, Calitz C, Kopsida M, Heindryckx F, Lennernäs H, Hedeland M
Cells 2021 May 11;10(5)
Cells 2021 May 11;10(5)
The Protective Role of Mitochondrial Ferritin on Erastin-Induced Ferroptosis.
Wang YQ, Chang SY, Wu Q, Gou YJ, Jia L, Cui YM, Yu P, Shi ZH, Wu WS, Gao G, Chang YZ
Frontiers in aging neuroscience 2016;8:308
Frontiers in aging neuroscience 2016;8:308
No comments: Submit comment
Supportive validation
- Submitted by
- Invitrogen Antibodies (provider)
- Main image

- Experimental details
- Western blot analysis of Transferrin Receptor/CD71 using 30 µg of NIH-3T3 lysate. Samples were loaded onto a 7.5% SDS-PAGE gel and probed with a Transferrin Receptor/CD71 polyclonal antibody (Product # PA5-27739) at a dilution of 1:1000.

- Submitted by
- Invitrogen Antibodies (provider)
- Main image

- Experimental details
- Western Blot analysis of Transferrin-Receptor was performed by separating 30 µg of various whole cell extracts by 7.5% SDS-PAGE. Proteins were transferred to a membrane and probed with a Transferrin Receptor Polyclonal Antibody (Product # PA5-27739) at a dilution of 1:1000 and a HRP-conjugated anti-rabbit IgG secondary antibody.

- Submitted by
- Invitrogen Antibodies (provider)
- Main image

- Experimental details
- Western Blot using Transferrin Receptor Polyclonal Antibody (Product # PA5-27739). Various whole cell extracts (30 µg) were separated by 7.5% SDS-PAGE, and the membrane was blotted with Transferrin Receptor Polyclonal Antibody (Product # PA5-27739) diluted at 1:1,000.

- Submitted by
- Invitrogen Antibodies (provider)
- Main image

- Experimental details
- Western Blot using Transferrin Receptor Polyclonal Antibody (Product # PA5-27739). Whole cell extract (30 µg) was separated by 7.5% SDS-PAGE, and the membrane was blotted with Transferrin Receptor Polyclonal Antibody (Product # PA5-27739) diluted at 1:1,000. The HRP-conjugated anti-rabbit IgG antibody was used to detect the primary antibody.

Supportive validation
- Submitted by
- Invitrogen Antibodies (provider)
- Main image

- Experimental details
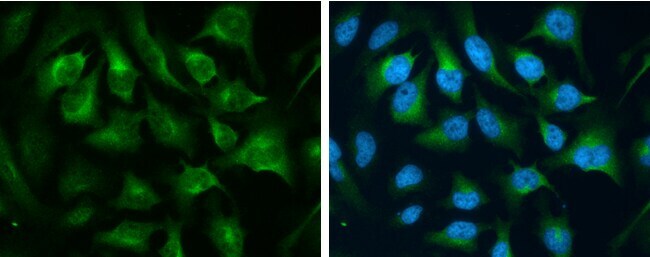
- Transferrin Receptor Polyclonal Antibody detects CD71 protein at cytoplasm by immunofluorescent analysis. Sample: HeLa cells were fixed in 4% paraformaldehyde at RT for 15 min. Green: CD71 protein stained by Transferrin Receptor Polyclonal Antibody (Product # PA5-27739) diluted at 1:500. Blue: Hoechst 33342 staining.
Supportive validation
- Submitted by
- Invitrogen Antibodies (provider)
- Main image

- Experimental details
- Figure 4 Effects of FtMt on the LIP level and iron metabolism under erastin treatment. (A) LIP levels were determined by the quenching of calcein-AM fluorescence method using fluorescence spectrophotometer. The LIP level was presented as mean +- SD; n = 3 ( ** p < 0.01 vs. the untreated cells of same genotype; ## p < 0.01 vs. the erastin-treated vector controls). Ferritin (B) and TfR1 (C) levels were determined by western blots. A representative blot image for each protein and its respective beta-actin was shown. The expression levels in different groups were calculated by normalizing the specific bands to their respective beta-actin bands, and presented as means +- SD, n = 6 ( ** p < 0.01 vs. the untreated cells of same genotype; ## p < 0.01 vs. the erastin-treated vector controls).

- Submitted by
- Invitrogen Antibodies (provider)
- Main image

- Experimental details
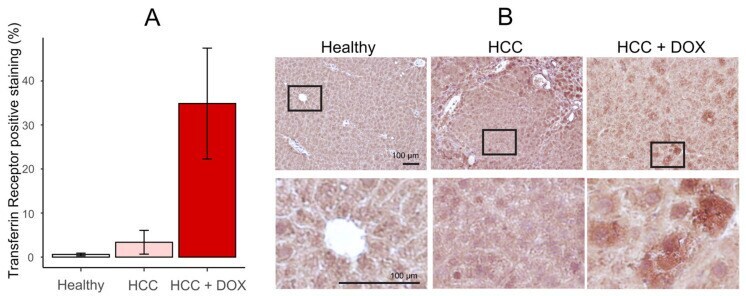
- Figure 9 Doxorubicin (DOX) treatment increases the expression of transferrin receptor. ( A ) Percentage of transferrin receptor-positive staining in the liver of the mouse model untreated (white), induced with hepatocellular carcinoma (HCC, light red), and treated with DOX after induction of HCC (dark red). ( B ) Representative images of the treatments at large scale (upper row) and detailed scale (lower row). Five replicates were performed; the bar represents the average, and the error bars represent the standard error of the mean.