Explore
 Validate
 Learn
Learn Western blot
 Immunocytochemistry
Antibody data
- Antibody Data
- Antigen structure
- References [1]
- Comments [0]
- Validations
- Immunocytochemistry [1]
- Immunohistochemistry [1]
- Other assay [1]
Submit
Validation data
Reference
Comment
Report error
- Product number
- PA5-60783 - Provider product page

- Provider
- Invitrogen Antibodies
- Product name
- ATP5L Polyclonal Antibody
- Antibody type
- Polyclonal
- Antigen
- Recombinant protein fragment
- Description
- Immunogen sequence: AQFVRNLVEK TPALVNAAVT YSKPRLATFW YYAKVELVPP TPAEIPRAIQ SLKKIVNSAQ TGSFK Highest antigen sequence identity to the following orthologs: Mouse - 78%, Rat - 72%.
- Reactivity
- Human
- Host
- Rabbit
- Isotype
- IgG
- Vial size
- 100 μL
- Concentration
- 0.3 mg/mL
- Storage
- Store at 4°C short term. For long term storage, store at -20°C, avoiding freeze/thaw cycles.
Submitted references Comparative Proteomic Profiling Identifies Reciprocal Expression of Mitochondrial Proteins Between White and Gray Matter Lesions From Multiple Sclerosis Brains.
Rai NK, Singh V, Li L, Willard B, Tripathi A, Dutta R
Frontiers in neurology 2021;12:779003
Frontiers in neurology 2021;12:779003
No comments: Submit comment
Supportive validation
- Submitted by
- Invitrogen Antibodies (provider)
- Main image
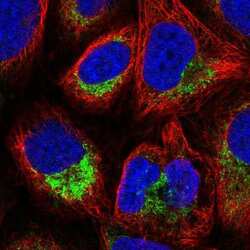
- Experimental details
- Immunofluorecent analysis of ATP5L in human cell line U-2 OS using ATP5L Polyclonal Antibody (Product # PA5-60783). Staining shows localization to mitochondria.

Supportive validation
- Submitted by
- Invitrogen Antibodies (provider)
- Main image
- Experimental details
- Immunohistochemical analysis of ATP5L in human stomach, upper using ATP5L Polyclonal Antibody (Product # PA5-60783) shows strong cytoplasmic positivity in glandular cells.
Supportive validation
- Submitted by
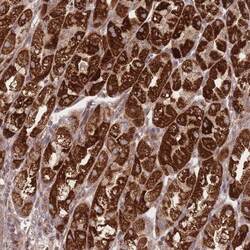
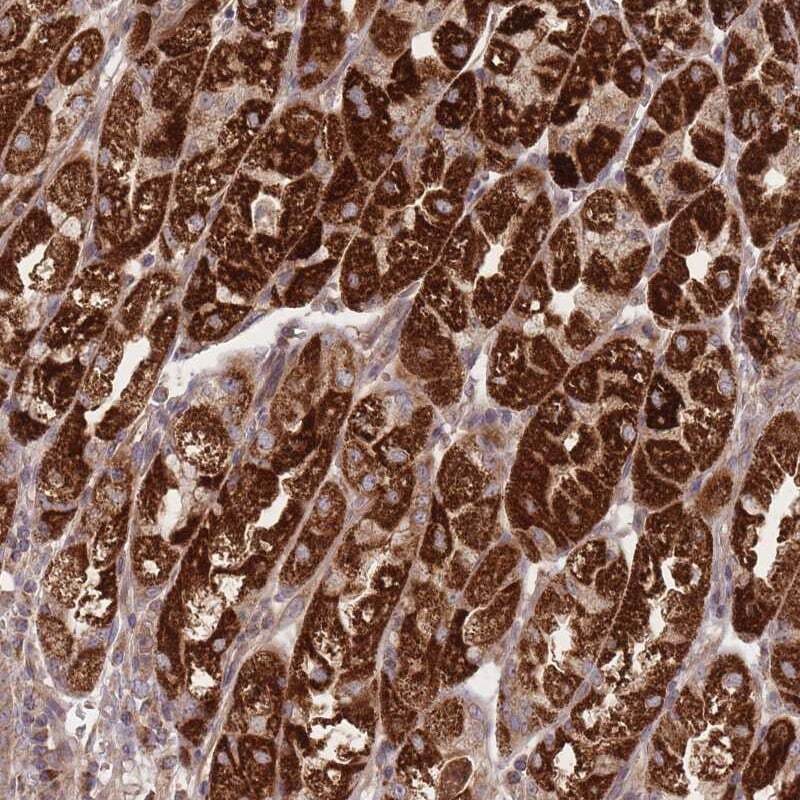
- Invitrogen Antibodies (provider)
- Main image
- Experimental details
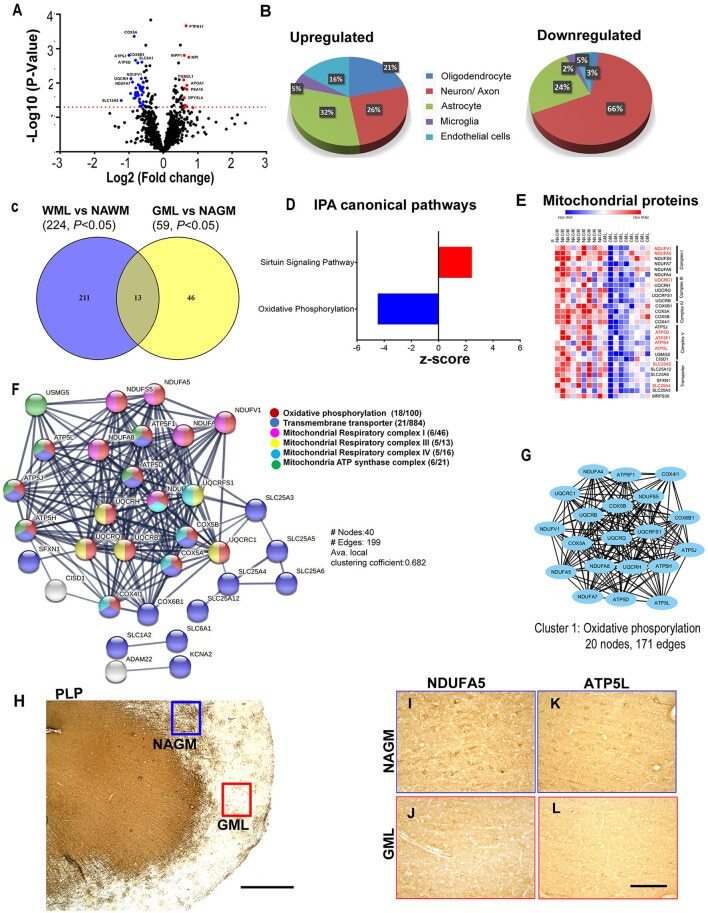
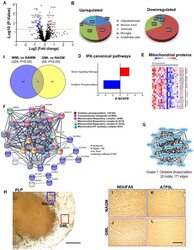
- Figure 5 Cortical GML proteome profiling. (A) Volcano plot displaying the distribution of all proteins ( n = 1182) with relative protein abundance (Log2 fold change) plotted against significance level (-Log 10 P -Value). Significantly upregulated (red circle) as well as downregulated (blue circle) proteins in GMLs are also indicated. (B) Cellular identity of the significantly dysregulated GML proteins (upregulated and downregulated). (C) Venn diagram comparison of DEPs ( p < 0.05) between WMLs and GMLs. (D) IPA canonical pathways, activated (red) and inhibited (blue), associated with significantly dysregulated proteins in GMLs. (E) LFQ-based heat map of mitochondria-specific downregulated proteins in GMLs. Proteins that are common and have opposite expressions in WML proteomic data are highlighted in red. (F) PPI network analysis of downregulated proteins showing enrichment of mitochondria-related pathways. (G) MCODE analysis revealed a highly interconnected sub-network associated with oxidative phosphorylation. (H-L) PLP- stained image of (H) sub-pial lesion. IHC images showing reduced expression of NDUFA5 (I,J) and ATP5L (K,L) in demyelinated regions (red box) compared to NAGM (blue box). Scale bar- 500mum (H) and 100mum (I-L) .