 Explore
 Validate
 Learn
Learn Flow cytometry
Antibody data
- Antibody Data
- Antigen structure
- References [0]
- Comments [0]
- Validations
- Flow cytometry [1]
- Other assay [1]
Submit
Validation data
Reference
Comment
Report error
- Product number
- MHCD0301 - Provider product page

- Provider
- Invitrogen Antibodies
- Product name
- CD3 Monoclonal Antibody (7D6), FITC
- Antibody type
- Monoclonal
- Antigen
- Other
- Description
- Commonly used, FITC conjugates provide relatively high absorptivity, excellent fluorescence quantum yield, and good water solubility.
- Reactivity
- Human
- Host
- Mouse
- Conjugate
- Green dye
- Isotype
- IgG
- Antibody clone number
- 7D6
- Vial size
- 500 µL
- Storage
- 4° C, store in dark
No comments: Submit comment
Supportive validation
- Submitted by
- Invitrogen Antibodies (provider)
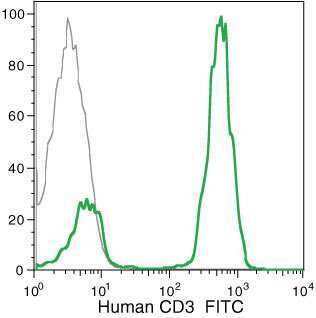
- Main image

- Experimental details
- Human peripheral blood lymphocytes stained using FITC of anti-human CD3 monoclonal antibody (clone S4.1). The negative control profiles represent unstained cells.
- Conjugate
- Green dye
Supportive validation
- Submitted by
- Invitrogen Antibodies (provider)
- Main image

- Experimental details
- Figure 6 Polyreactivity Is Inherent to Naive B Cells Selected into the Broadly Neutralizing Response (A) Proportion of mAbs generated from total naive B cells and MBCs and from influenza stalk domain-binding germline B cells, MBCs, and plasmablasts that were polyreactive. (B and C) Binding AUC of polyreactive mAbs or the corresponding germline-reverted mAbs binding to A/California/7/2009 (n = 12) and A/Brisbane/59/2007 viruses (n = 13) (B) and dsDNA (n = 11), insulin (n = 12), and LPS (n = 12) (C). Each line connects the germline and affinity-matured version of the same mAb. (D and E) Fold change in AUC of affinity-matured mAbs over AUC of germline mAbs of all tested mAbs (D) and further broken down by initial germline affinity for A/California/7/2009 virus (E). Cyan dots represent sc70 1F02, and orange dots represent SFV005 2G02. (F and G) MD simulations of the HC-CDR3 sequences of germline and affinity-matured versions of mAbs sc70 1F02 (F) and SFV005 2G02 (G). For (A), the numbers on top of individual bars is the number of polyreactive mAbs out of total mAbs tested from each cohort. For (D) and (E), each symbol represents one mAb, and the red bar represents the median. Data in (A) were analyzed by Fisher's exact test, and data in (B) and (C) were analyzed by paired non-parametric Wilcoxon matched-pairs signed rank tests. See also Figure S6 .
- Conjugate
- Green dye
