Explore
 Validate
 Learn
Learn Flow cytometry
Antibody data
- Antibody Data
- Antigen structure
- References [0]
- Comments [0]
- Validations
- Flow cytometry [1]
- Other assay [5]
Submit
Validation data
Reference
Comment
Report error
- Product number
- MHCD0317 - Provider product page

- Provider
- Invitrogen Antibodies
- Product name
- CD3 Monoclonal Antibody (7D6), PE-Texas Red
- Antibody type
- Monoclonal
- Antigen
- Other
- Description
- The R-phycoerythrin (PE)-Texas Red conjugate permits simultaneous multicolor labeling and detection of multiple targets with excitation by a single excitation source-the 488 nm line of the argon-ion laser.
- Reactivity
- Human
- Host
- Mouse
- Isotype
- IgG
- Antibody clone number
- 7D6
- Vial size
- 500 µL
- Storage
- 4° C, store in dark
No comments: Submit comment
Supportive validation
- Submitted by
- Invitrogen Antibodies (provider)
- Main image

- Experimental details
- Human peripheral blood lymphocytes stained using PE-Texas Red® of anti-human CD3 monoclonal antibody (clone S4.1). The negative control profiles represent unstained cells.

Supportive validation
- Submitted by
- Invitrogen Antibodies (provider)
- Main image

- Experimental details
- Figure 3 Decreased frequencies of Treg cells after DC vaccination are associated with extended survival. PBMC from pre and post-DC vaccination time points were stained with an antibody cocktail that identifies Treg cell populations (CD3 + CD4 + CD25 + CD127 low ). The ratio of post vaccination/pre-vaccination Treg cell frequencies from each patient was calculated and linked with the overall survival of each patient. (A) Flow cytometric analysis of Treg cell populations from a normal volunteer. (B) Representative FACS plots of Treg cell frequencies from two glioblastoma patients (7-799, 32-204) before and after DC vaccination.

- Submitted by
- Invitrogen Antibodies (provider)
- Main image

- Experimental details
- Figure 1 Gating strategy to identify T cell subsets (CD4+, CD8+ and gammadeltaTCR+) and counting beads based on a representative sample. (a) Gating strategy to identify T cell subsets. T lymphocytes were selected based on CD3 expression and side scatter (SSC) characteristics. The CD3+ population was further divided into CD4+/CD8+ T lymphocytes (based on CD4 and CD8 expression) and gammadeltaT positive and negative CD3 cells (based on gammadeltaTCR expression). (b) Gating strategy to identify counting beads. First, two populations of counting beads were selected based on the forward and side scatter characteristics. Second, FITC positive beads were counted for the cell count analyses. Third, the frequency of each bead population was assessed to compare with bead lot characteristics.

- Submitted by
- Invitrogen Antibodies (provider)
- Main image

- Experimental details
- Figure 4 Decreased expression of CTLA-4 on CD3 + CD4 + and CD3 + CD8 + T cells after DC vaccination is associated with extended survival. PBMC from pre and post-DC vaccination time points were stained with an antibody cocktail that identifies CD4 and CD8 T cell populations (CD3 + CD4 + or CD3 + CD8 + ) and evaluated for the expression of CTLA-4. The ratio of post vaccination/pre-vaccination expression of CTLA-4 from each patient was calculated and linked with the overall survival of each patient. (A) Flow cytometric analysis of CD3 + CD4 + T cell expression of CTLA-4 from a normal volunteer. (B) Representative FACS plots of CTLA-4 expression from CD3 + CD4 + T cells in two glioblastoma patients (4-908, 21-828) before and after DC vaccination.

- Submitted by
- Invitrogen Antibodies (provider)
- Main image
- Experimental details
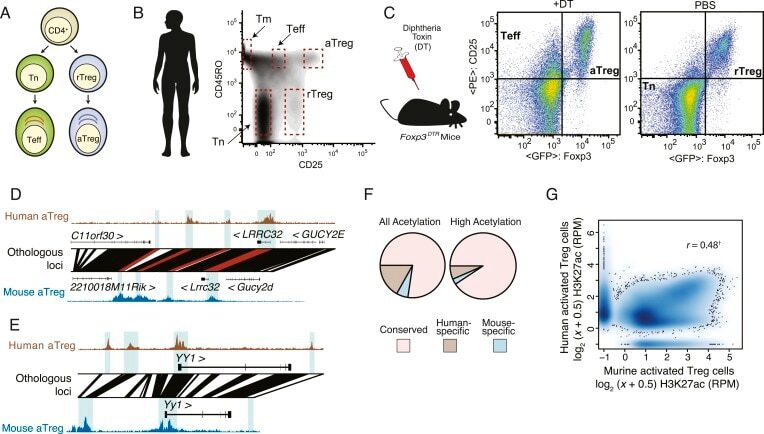
- Figure 1. Analysis of genetic and epigenetic conservation in mouse and human Treg and CD4 + T cell subsets. ( A ) Schematic representation of profiled CD4 + T-cell subsets. Abbreviations: naive T cell (Tn); effector T cell (Teff); resting regulatory T cell (rTreg); activated regulatory T cells (aTreg). ( B ) The indicated human CD4 + T-cell subpopulations were FACS sorted based on CD3 , CD4, CD45RO, and CD25 expression from preparations of peripheral blood mononuclear cells (PBMCs) from healthy human donors. Highly purified Treg cell subpopulations were obtained using a FACS Aria II fluorescent cell sorter ( Figure 1--figure supplement 1A ). Epigenetic profiling was performed using the following 16 cell samples isolated from 7 healthy donors: including 7 aTreg, 4 rTreg, 2 Teff, 2 Tmem, and 1 Tn independently isolated cell populations. See also Figure 1--figure supplement 1A,B . ( C ) Resting and activated murine CD4 + T-cell subpopulations were FACS sorted from Foxp3 DTR-GFP mice injected with PBS or diphtheria toxin (DT), respectively. In Foxp3 DTR-GFP mice, Treg cells express diphtheria toxin receptor (DTR). Mice injected with DT underwent punctual Treg cell depletion and consequent transient systemic inflammation, which resulted in activation of rebounding Treg and conventional T cells. A total of 10 mouse cell samples isolated using FACS sorting from DT-treated and DT-untreated Foxp3 DTR mice were analyzed: 2 aTreg, 4 rTreg, 2 Teff, and 4 Tn biological replicates. ( D , E
- Submitted by
- Invitrogen Antibodies (provider)
- Main image
- Experimental details
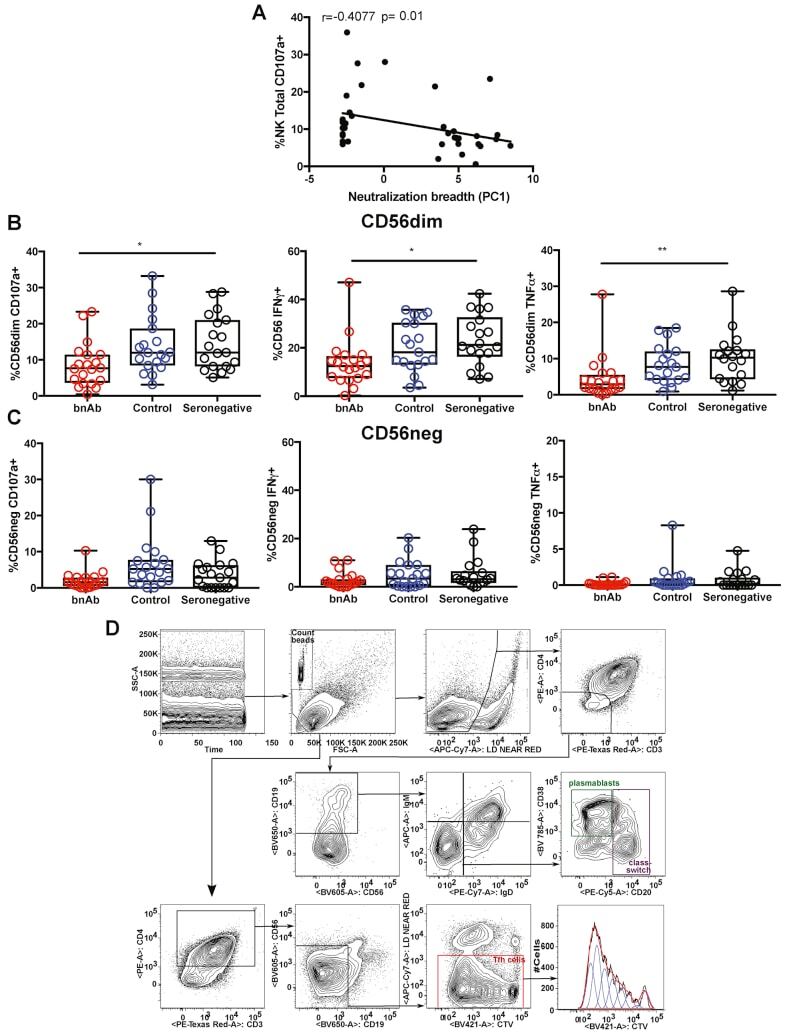
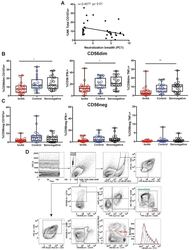
- Figure S6 Functional Analysis of CD56dim and CD56neg NK Subsets and Gating Strategy for Analysis of NK:Tfh:B Cell Co-culture, Related to Figures 4 and 5 (A) Spearman correlation of percentage of total NK cells undergoing degranulation (assessed by CD107a expression) on exposure to target cells with plasma HIV-1 neutralization breadth (PC1). (B and C) Summary boxplots for CD107a expression, IFN-gamma and TNF-alpha production from (B) CD56dim NK cells and (C) CD56neg NK cells following target cell stimulation in bnAb (red), control (blue) and HIV seronegative individuals (black). Each symbol represents data from an individual subject and the box-and-whisker plots show the median, quartiles and range. * p < 0.05, ** p < 0.01. P values corrected for MCA and viral load. (D) Class-switched memory B cells were identified as live CD3-CD4-CD56-CD19+IgD-IgM-CD20+CD38+/- cells and plasmablasts as live CD3-CD4-CD56-CD19+IgD-IgM-CD20-CD38+ cells. Tfh cells were identified as live CD3+CD4+CD19-CD56- cells. The division index was calculated using Flowjo software. CountBright absolute counting beads were used to calculate absolute numbers. The staining shown is from a representative subject (Tfh+B cell only condition).