Explore
 Validate
 Learn
Learn Flow cytometry
Antibody data
- Antibody Data
- Antigen structure
- References [0]
- Comments [0]
- Validations
- Flow cytometry [2]
- Other assay [27]
Submit
Validation data
Reference
Comment
Report error
- Product number
- 56-0038-42 - Provider product page

- Provider
- Invitrogen Antibodies
- Product name
- CD3 Monoclonal Antibody (UCHT1), Alexa Fluor™ 700, eBioscience™
- Antibody type
- Monoclonal
- Antigen
- Other
- Description
- Description: The UCHT1 monoclonal antibody reacts with human CD3e, a 20 kDa subunit of the TCR complex.Along with the other CD3 subunits gamma and delta, the epsilon chain is required for proper assembly, trafficking and surface expression of the TCR complex.CD3 is expressed by thymocytes in a developmentally regulated manner and by all mature T cells.Crosslinking of TCR via immobilized UCHT1 initiates an intracellular biochemical pathway resulting in cellular activation and proliferation. Applications Reported:This UCHT1 antibody has been reported for use in flow cytometric analysis. Applications Tested: Has been pre-titrated and tested by flow cytometric analysis of normal human peripheral blood cells. This can be used at 5 µL (0.5 µg) per test. A test is defined as the amount (µg) of antibody that will stain a cell sample in a final volume of 100 µL. Cell number should be determined empirically but can range from 10^5 to 10^8 cells/test. The Alexa Fluor® 700 emits at 723 nm and can be excited with the red laser (633 mm). Most instruments will require a 685 LP mirror and 710/20 filter. Please make sure that your instrument is capable of detecting this fluorochrome. Excitation: 633-647 nm; Emission: 723 nm; Laser: Red Laser. Filtration: 0.2 µm post-manufacturing filtered.
- Reactivity
- Human
- Host
- Mouse
- Conjugate
- Near infrared dye
- Isotype
- IgG
- Antibody clone number
- UCHT1
- Vial size
- 100 Tests
- Concentration
- 5 µL/Test
- Storage
- 4° C, store in dark, DO NOT FREEZE!
No comments: Submit comment
Supportive validation
- Submitted by
- Invitrogen Antibodies (provider)
- Main image
- Experimental details
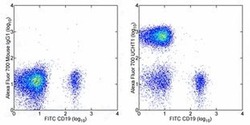
- Staining of normal human peripheral blood cells with Anti-Human CD19 FITC (Product # 11-0199-42) and Mouse IgG1 K Isotype Control Alexa Fluor® 700 (Product # 56-4714-80) (left) or Anti-Human CD3 Alexa Fluor® 700 (right). Cells in the lymphocyte gate were used for analysis.
- Conjugate
- Near infrared dye

- Submitted by
- Invitrogen Antibodies (provider)
- Main image

- Experimental details
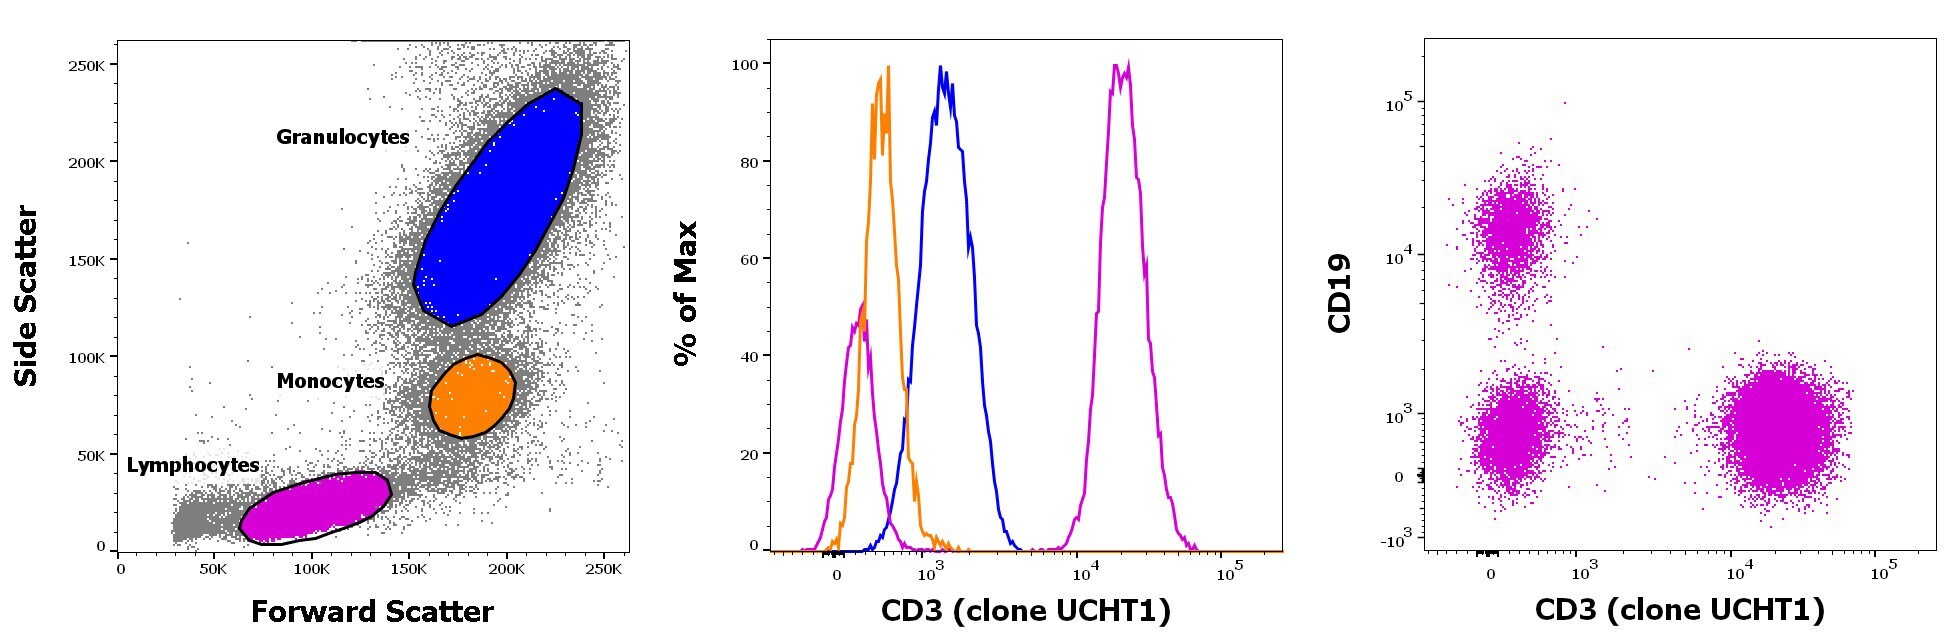
- Staining of human peripheral blood mononuclear cells with CD45 Pacific Blue, CD19 FITC and CD3 Alexa Fluor 700. As expected based on known relative expression patterns, CD3 clone UCHT1 stains a subset of lymphocytes (pink), but not monocytes (orange) and granulocytes (blue).
- Conjugate
- Near infrared dye
Supportive validation
- Submitted by
- Invitrogen Antibodies (provider)
- Main image
- Experimental details
- NULL
- Conjugate
- Near infrared dye

- Submitted by
- Invitrogen Antibodies (provider)
- Main image

- Experimental details
- NULL
- Conjugate
- Near infrared dye
- Submitted by
- Invitrogen Antibodies (provider)
- Main image
- Experimental details
- NULL
- Conjugate
- Near infrared dye

- Submitted by
- Invitrogen Antibodies (provider)
- Main image

- Experimental details
- NULL
- Conjugate
- Near infrared dye
- Submitted by
- Invitrogen Antibodies (provider)
- Main image
- Experimental details
- NULL
- Conjugate
- Near infrared dye
- Submitted by
- Invitrogen Antibodies (provider)
- Main image

- Experimental details
- NULL
- Conjugate
- Near infrared dye
- Submitted by
- Invitrogen Antibodies (provider)
- Main image
- Experimental details
- NULL
- Conjugate
- Near infrared dye
- Submitted by
- Invitrogen Antibodies (provider)
- Main image
- Experimental details
- NULL
- Conjugate
- Near infrared dye
- Submitted by
- Invitrogen Antibodies (provider)
- Main image
- Experimental details
- NULL
- Conjugate
- Near infrared dye
- Submitted by
- Invitrogen Antibodies (provider)
- Main image
- Experimental details
- NULL
- Conjugate
- Near infrared dye
- Submitted by
- Invitrogen Antibodies (provider)
- Main image
- Experimental details
- NULL
- Conjugate
- Near infrared dye
- Submitted by
- Invitrogen Antibodies (provider)
- Main image
- Experimental details
- NULL
- Conjugate
- Near infrared dye

- Submitted by
- Invitrogen Antibodies (provider)
- Main image

- Experimental details
- NULL
- Conjugate
- Near infrared dye
- Submitted by
- Invitrogen Antibodies (provider)
- Main image
- Experimental details
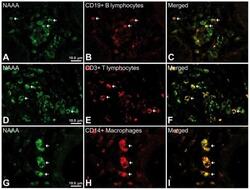
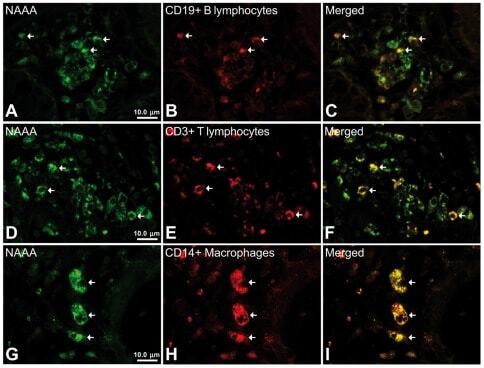
- Figure 6 Representative high-magnification photomicrographs showing double immunofluorescence for NAAA, CD19, CD3 and CD14 in order to characterize the immune cells in the mucosa infiltrate of UC patients. NAAA immunofluorescence was observed in CD19+ B lymphocytes (A-C), CD3+ T lymphocytes (D-F) and CD14+ macrophages (G-I).
- Conjugate
- Near infrared dye
- Submitted by
- Invitrogen Antibodies (provider)
- Main image
- Experimental details
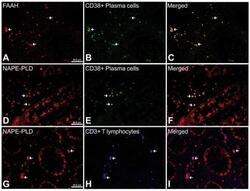
- Figure 9 Representative high-magnification photomicrographs showing double immunofluorescence for FAAH, NAPE-PLD, CD38 and CD3 in order to characterize the immune cells in the mucosa infiltrate of UC patients. Nearly all FAAH immunofluorescent cells are plasma cell-specific CD38 (A-C). NAPE-PLD immunofluorescence was observed in both CD38+ plasma cells (D-F) and CD3+ T lymphocytes (G-I).
- Conjugate
- Near infrared dye

- Submitted by
- Invitrogen Antibodies (provider)
- Main image

- Experimental details
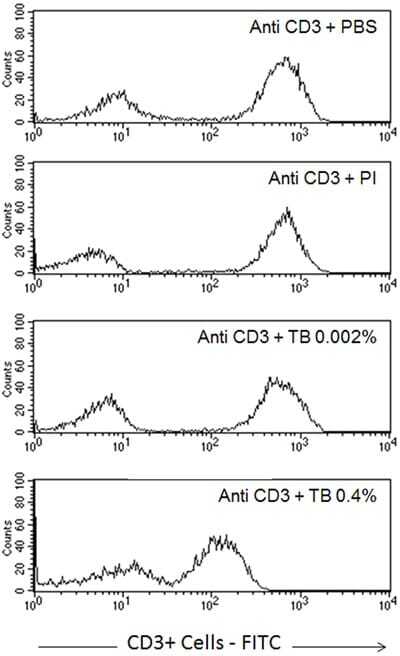
- Figure 6 Profile of T-lymphocytes stained with monoclonal antibody anti-CD3-FITCfollowed by treatment with propidium iodide (PI) and trypan blue (TB) at 0.002and 0.4% (w/v) or PBS (untreated control).
- Conjugate
- Near infrared dye
- Submitted by
- Invitrogen Antibodies (provider)
- Main image
- Experimental details
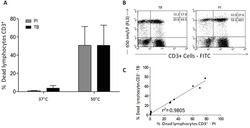
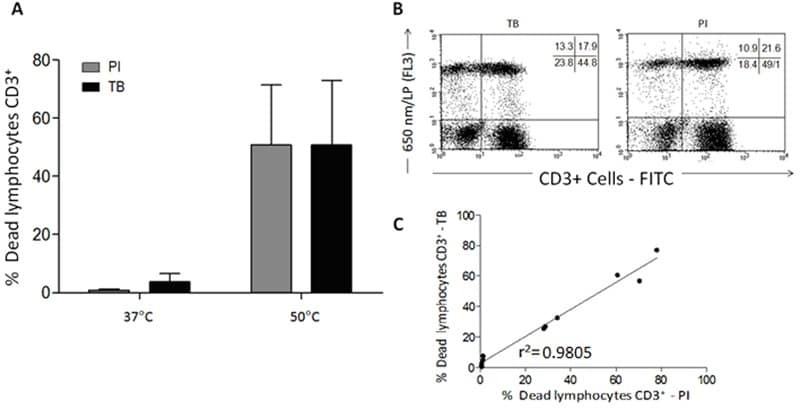
- Figure 7 A , Percentage of dead human T-lymphocytes(CD3-FITC + cells) submitted to cell culture at temperatures (T)of 37degC (physiologic temperature) or 50degC (high-stress temperature) followed bystaining with trypan blue (TB) or propidium iodide (PI). B ,Dot-plot graph profile between human lymphocytes submitted to pretreatment withhigh-stress temperature (50degC) followed by staining with TB and PI andmonoclonal antibody anti-CD3-FITC + . C , Pearson'scorrelation test between dead CD3 + lymphocytes using PI and TB flowcytometry assays.
- Conjugate
- Near infrared dye
- Submitted by
- Invitrogen Antibodies (provider)
- Main image

- Experimental details
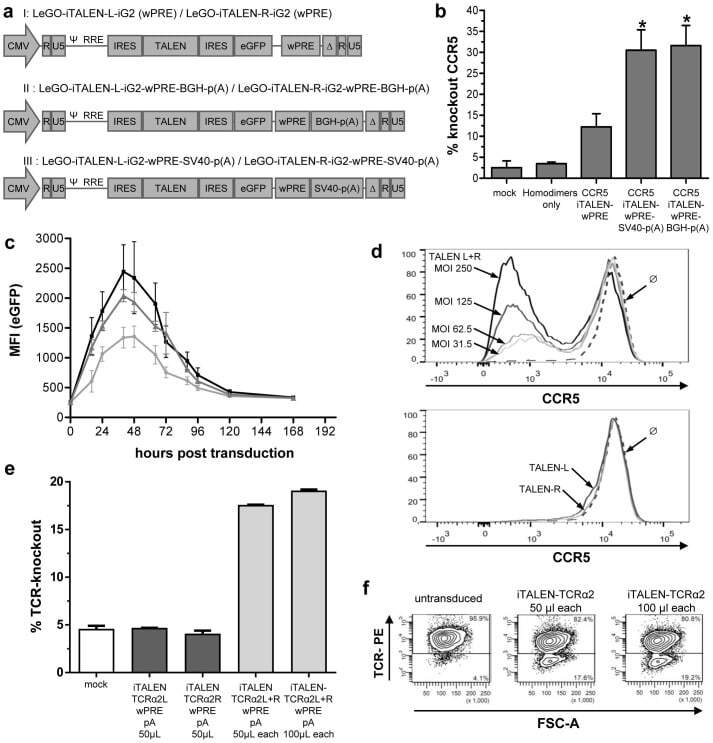
- Figure 3 Functional analysis of NRTLV-delivered TALEN constructs. (a) Schematic vector design of I: LeGO-iTALEN-iG2 (wPRE), II: LeGO-iTALEN-iG2-wPRE-BGH-p(A) and III: LeGO-iTALEN-iG2-wPRE-SV40-p(A) 3 rd generation LVV derived from LeGO-system 11 . CMV = CMV-ie promoter; Delta (DeltaU3), R, U5 = elements of SIN-LTR, self-inactivating long terminal repeat; Psi = Psi , packaging signal; RRE = Rev response element; SFFV = promoter of spleen focus-forming virus; wPRE = Woodchuck hepatitis virus posttranscriptional regulatory element; IRES = internal ribosome entry site; eGFP = enhanced green fluorescent protein; p(A) = polyadenylation signal; BGH = bovine growth hormone; SV40 = simian virus 40. (b) Knockout of CCR5 in reporter cell line CCR5+/293T-cell clones were co-transduced with non-concentrated NRTLVs delivering different iTALEN-constructs with either no internal polyadenylation (p(A)) signal (iTALEN-wPRE), or internal BGH-p(A) (iTALEN-wPRE-BGH-p(A)) or SV40-p(A) (iTALEN-wPRE-SV40-p(A)) signals downstream of the wPRE-element, respectively. Mock-transduction and transduction of left or right TALEN-arms, only, served as negative controls (homodimers only). Measured for 3 independently produced vector preparations, each time in duplicates, *p
- Conjugate
- Near infrared dye
- Submitted by
- Invitrogen Antibodies (provider)
- Main image
- Experimental details
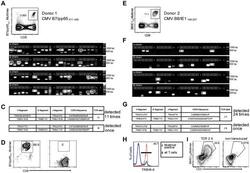
- Figure 2 Single-cell PCR delivers sequences of functional CMV-specific TCRs. (A) PBMCs from Donor 1 were recovered and stained with HLA-B7/pp65 417-426 multimers. Dot plot shows the further analyzed CD8 and MHC multimer double-positive cell population. Cells were pre-gated on live lymphocytes (propidium iodide-negative, and CD3-positive). (B) TCR SCAN as described in Figure 1 and agarose gel electrophoresis of the resulting PCR products was performed. The photography shows the agarose gel. Upper row shows alpha-chain products matched with the respective beta-chains in the lower row. White boxes indicate alpha- and matched beta-chain-products derived from identical single cell samples. (C) The table summarizes the V- D- J- segment type and amino acid sequences of TCRs identified from CMV-multimer positive T cells in Figure 2A . TCR1A was identified 11 times and TCR 1B was detected once. (D) MHC multimer-positive T cells from the same donor were in vitro expanded and six T cell clones were successfully maintained. All clones contained TCR1A as confirmed by PCR and sequencing. The left FACS plot shows HLA-B7/pp65 417-426 staining and the right FACS plot shows staining with an irrelevant MHC multimer. (E) PBMCs from donor 2 were recovered and stained with HLA-B8/IE-1 199-207 multimers. The dot plot shows the further analyzed CD8 and MHC multimer double-positive cell population. Cells were pre-gated on living lymphocytes (propidium iodide negative and CD3 positive). (F) TCR SCAN a
- Conjugate
- Near infrared dye
- Submitted by
- Invitrogen Antibodies (provider)
- Main image
- Experimental details
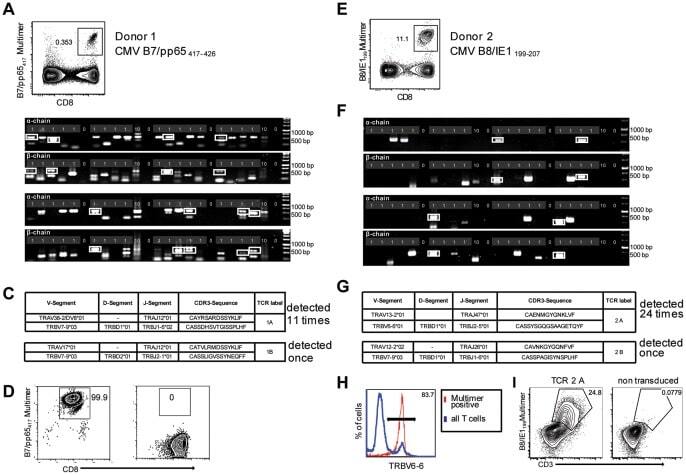
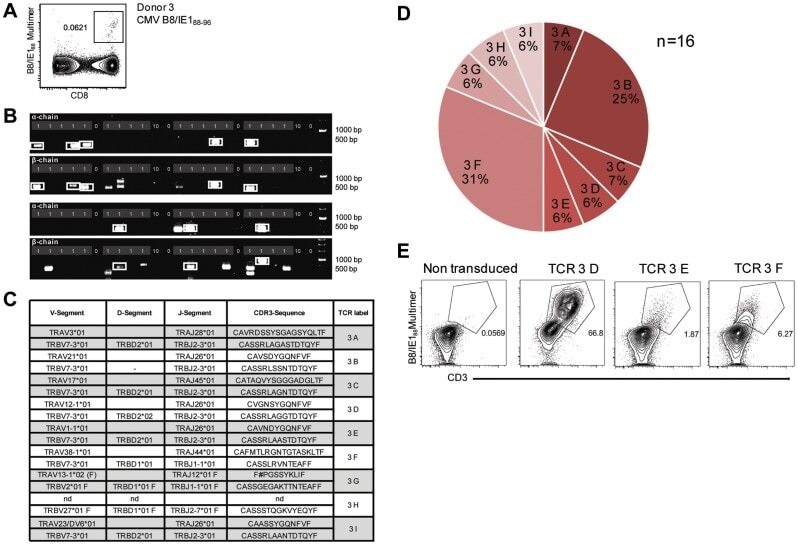
- Figure 3 Characterization of a small diverse T cell repertoire and transgenic expression of detected TCRs. (A) PBMCs from donor 3 were stained with HLA-B8/IE-1 88-96 multimers. Dot plot shows the further analyzed CD8 and MHC multimer double-positive cell population. Cells were pre-gated on living lymphocytes (propidium iodide-negative and CD3-positive). (B) A PCR slide with single antigen-specific T cells from Figure 3A were FACS-isolated. TCR SCAN as described in Figure 1 and agarose gel electrophoresis of the resulting PCR products was performed. Upper row shows alpha-chain products matched with the respective beta-chains in the lower row. White boxes indicate samples alpha- and matched beta-chain-products derived from identical single cell samples. (C) The table summarizes the V- D- J- segment type and amino acid sequences of TCRs identified from CMV-multimer positive T cells in Figure 3A . In three independent experiments we identified nine different TCRs (TCR 3A-I) (D) Pie chart indicates the prevalence of identified TCRs from donor 3. Percentages represent incidence of respective TCR divided by total number of positive samples. (E) Sequences from TCR 3D, 3E and 3G were expressed in Jurkat76 T cells by retroviral gene transfer. Non-transduced (left FACS plot) and transduced Jurkat76 T cells were analyzed for expression of CD3 and MHC multimer binding.
- Conjugate
- Near infrared dye
- Submitted by
- Invitrogen Antibodies (provider)
- Main image

- Experimental details
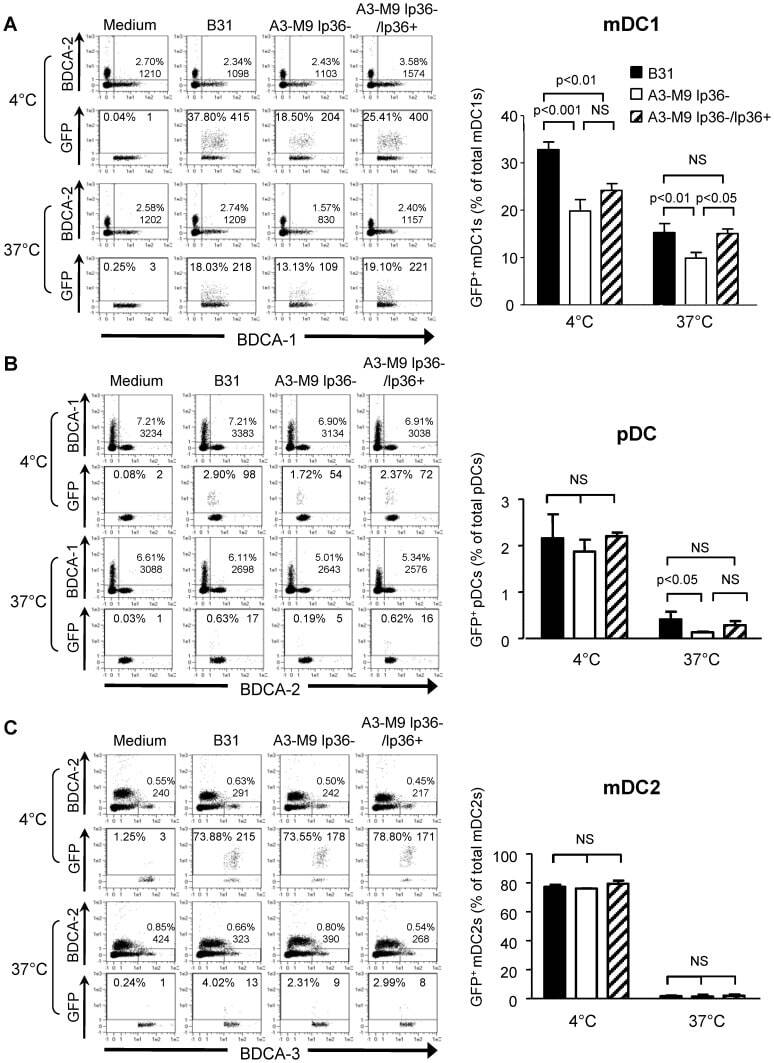
- Figure 5 lp36 contributes to the association of B. burgdorferi with specific populations of dendritic cells. Human PBMCs (4x10 6 ) were co-incubated with 4x10 7 GFP-tagged B31 (black bars), A3-M9 lp36- (white bars) or A3-M9 lp36-/lp36+ (cross-hatched bars) B. burgdorferi for 6 hours at 4degC or 37degC. The percentages of GFP + mDC1s (CD19 - CD3 - BDCA2 - BDCA1 + ) ( A ), pDCs (CD19 - CD3 - BDCA2 + BDCA1 - ) or ( B ) mDC2s (CD19 - CD3 - BDCA3 + BDCA2 - ) ( C ) were determined by multiparameter flow cytometry. Dot plots representing 500,000 collected events are provided to illustrate gating strategies (left). Column graphs represent the mean and standard deviation of three biological replicates (right). Statistical analysis was performed using a one-way ANOVA with a Tukey's post-test for multiple comparisons.
- Conjugate
- Near infrared dye
- Submitted by
- Invitrogen Antibodies (provider)
- Main image
- Experimental details
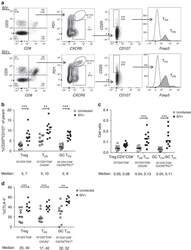
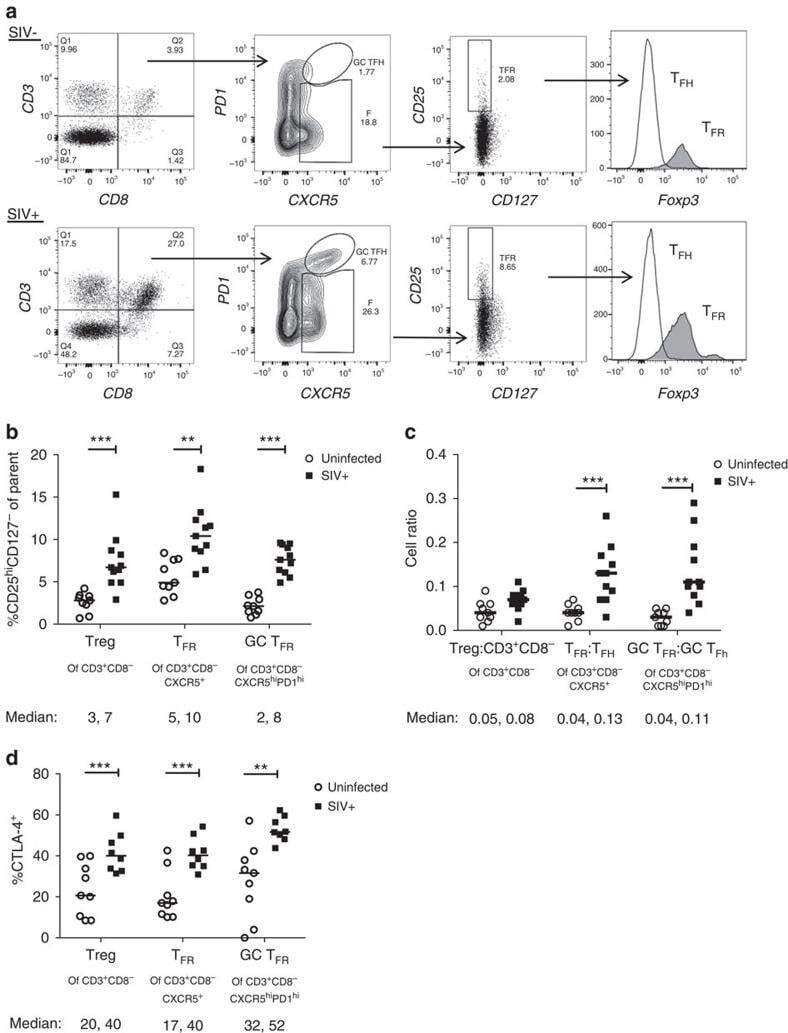
- Figure 2 T FR expansion in lymphoid tissues during chronic SIV infection. ( a ) Disaggregated lymph node and spleen cells from SIV uninfected ( n =9) or chronically SIV-infected rhesus macaques ( n =11) were analysed by flow cytometry. Representative examples of flow cytometry gating are shown. Of viable CD3 + CD8 - cells, follicular subsets were defined as CXCR5 + cells (F) and germinal centre subsets were defined as CXCR5 hi PD-1 hi cells (GC). Of these subsets, regulatory cells were defined as CD25 hi CD127 - . T FR (CXCR5 + CD25 hi CD127 - ) were Foxp3 + , whereas T FH (CXCR5 + CD25 lo/- ) were Foxp3 - . ( b ) The percentages of each rhesus macaque regulatory subset, as analysed in a are shown. ( c ) The ratios of each regulatory cell population to its non-regulatory cell counterpart are shown. ( d ) The percentage of total CTLA-4 expression is shown in SIV-uninfected ( n =9) and chronically SIV-infected ( n =8) rhesus macaques. The horizontal bars of each graph indicate the median value and are listed where appropriate for clarity. Statistical analyses were performed by Mann-Whitney (Wilcoxon) tests to compare unpaired, nonparametric values and significance is denoted by asterisks where * P
- Conjugate
- Near infrared dye
- Submitted by
- Invitrogen Antibodies (provider)
- Main image
- Experimental details
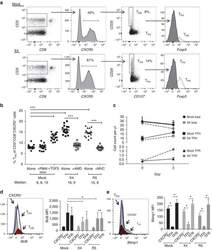
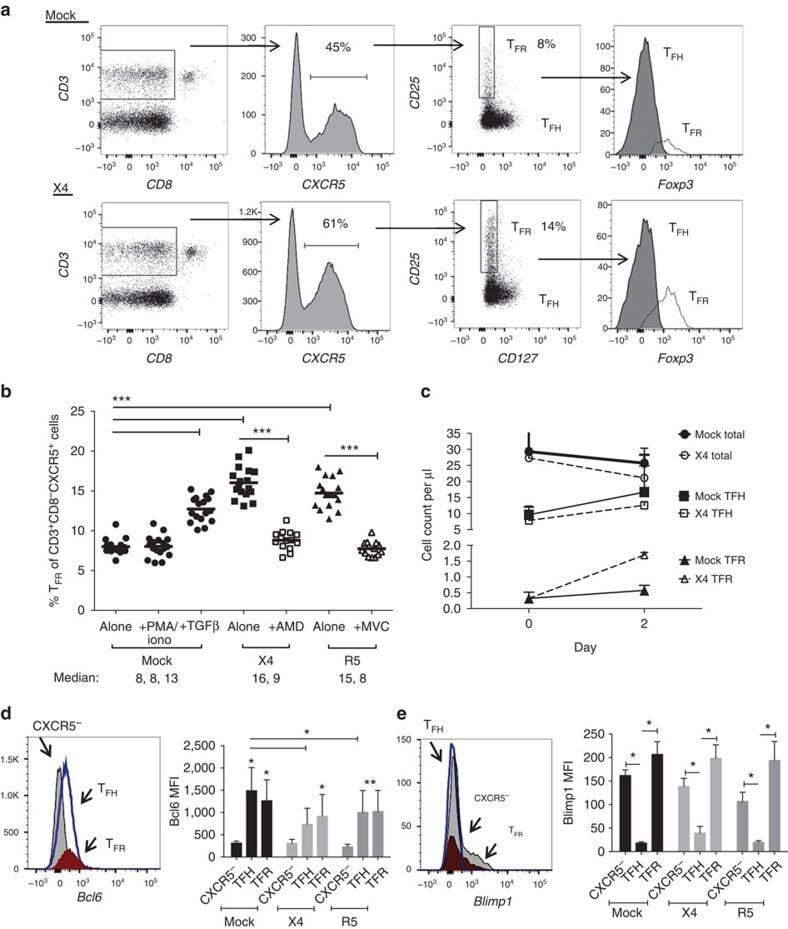
- Figure 3 HIV entry and replication promote T FR expansion. Disaggregated tonsil cells were spinoculated with X4 or R5 HIV and T FR populations were analysed by flow cytometry ( n =15). ( a ) A representative example of tonsil cell flow gating. From viable CD3 + CD8 - cells, T FR are defined as CXCR5 + and CD25 hi CD127 - . T FR cells contain Foxp3 + cells, whereas remaining T FH (CXCR5 + CD25 lo/- ) cells are Foxp3 - . ( b ) Percentages of T FR determined by gating strategies in a are shown. Experimental conditions include mock-spinoculated cells cultured with PMA (50 ng ml -1 ) and ionomycin (1 mug ml -1 ) or exogenous TGF-beta (100 ng ml -1 ) for 24 h and cells pretreated to block CXCR4 (AMD, 200 muM) and CCR5 (MVC, 2 muM). ( c ) Using flow cytometry counting beads, the number of cells per mul were determined for total (CD3 + CD8 - ), T FH (CXCR5 + CD25 lo/- ) and T FR (CXCR5 + CD25 hi CD127 - ) subsets in mock- and X4-spinoculated samples ( n =3). ( d ) Bcl-6 expression is shown in CXCR5- (grey), T FH (blue) and T FR (red) populations after mock-, X4- or R5-spinoculation ( n =5). ( e ) Blimp-1 expression was also determined as in d . The horizontal bars of each graph indicate the median value and are listed where appropriate for clarity. Statistical analyses were performed by Friedman nonparametric tests ( b , d , e ) and significance is denoted by asterisks where * P
- Conjugate
- Near infrared dye
- Submitted by
- Invitrogen Antibodies (provider)
- Main image
- Experimental details
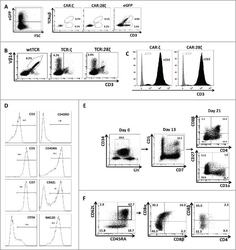
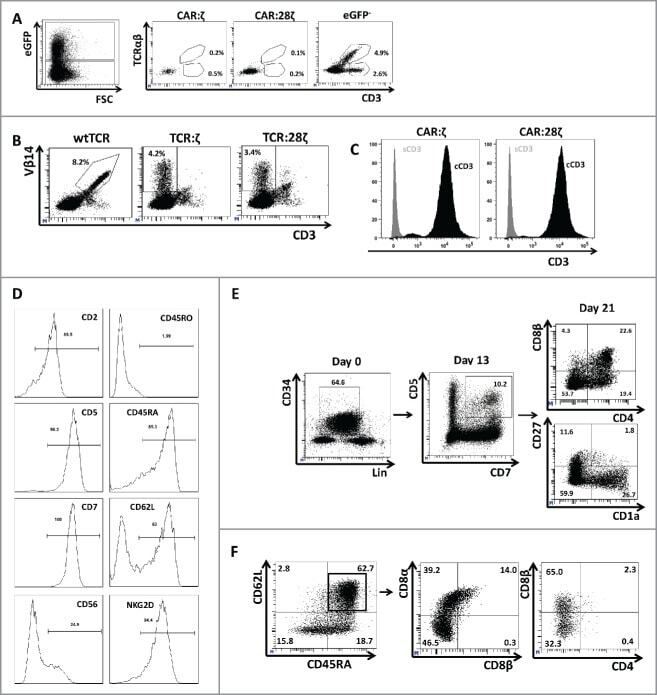
- Figure 3. Phenotype and endogenous TCR expression of CD34 + HPC-derived transgenic AR + T cells. Flow cytometric analysis of the AR-transgenic T cells. (A) CAR-transgenic GFP + cells of cultures transduced to express either the CAR:zeta or the CAR:28zeta were analyzed on day 26 of OP9-DL1 culture for CD3 and TCRalphabeta expression. As a control, GFP - cells are shown from the OP9-DL1 culture transduced to express the CAR:zeta ( N = 5). (B) Dot plots show CD3 expression of cells from the OP9-DL1 cultures transgenic for the wtTCR, TCR:zeta and TCR:28zeta. Vbeta14 staining is used to mark transgene expression, as no GFP is expressed by the transgenic cells ( N = 5). (C) Surface and cytoplasmic staining for CD3 of in vitro generated mature T cells that were expanded for one cycle on feeder cells in the presence of cytokines. (D) Expression of various membrane markers by the CD27 + CD1a - mature T cells at the end of OP9-DL1 culture (46 d) ( N = 2). (E) Day 0: fresh cord blood after MACS CD34 enrichment sorted using the sorting window shown. Day 13: cord blood cells cultured on OP9-DL1 were sorted for CD5 CD7 double positive cells, using the indicated sorting window. The cells were then transduced to express CAR:28zeta and further differentiated on OP9-DL1 feeder layer. Day 21: analysis of the transgenic GFP + cultured cells for DP cells and CD27 + CD1a - mature cells. (F) Flow cytometric analysis of GFP + CAR:28zeta-transgenic cultures, gated on GFP + CD27 + CD1a - mature AR + c
- Conjugate
- Near infrared dye
- Submitted by
- Invitrogen Antibodies (provider)
- Main image
- Experimental details
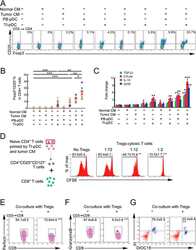
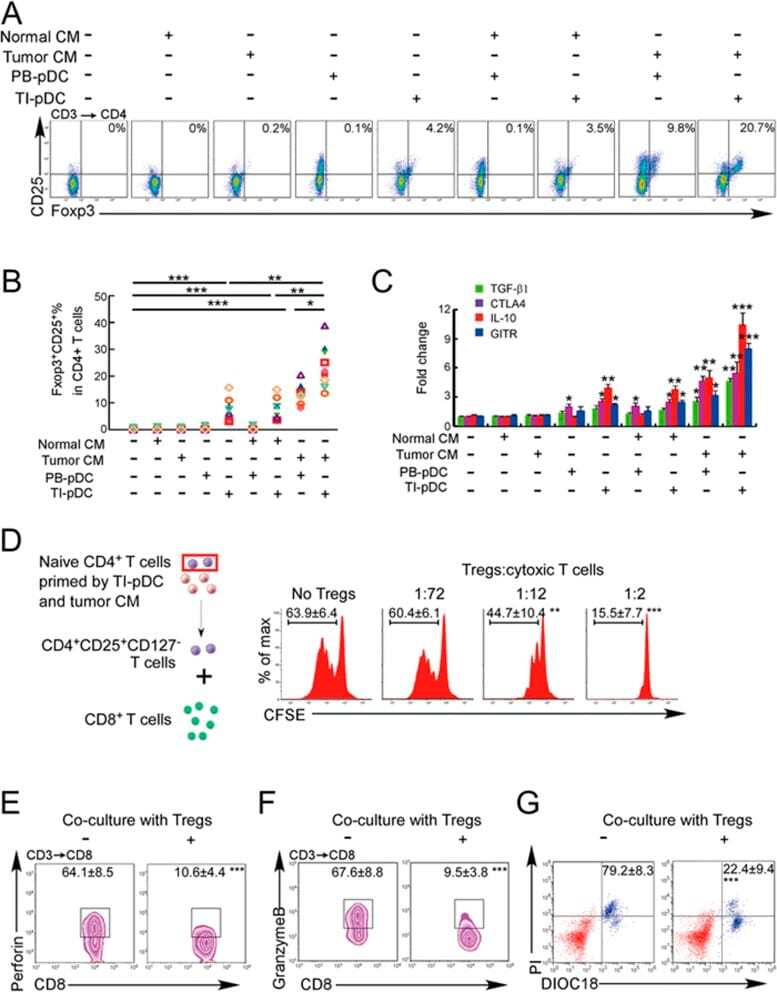
- Figure 3 Naive CD4 + T cells are converted to functional Tregs by tumor-infiltrating DCs and tumor conditioned medium (CM). (A-C) Naive CD4 + T cells from peripheral blood of patients with invasive breast carcinoma were co-cultured with or without autologous pDCs isolated from tumor (TI) or peripheral blood (PB) for 9 days in the presence or absence of 30% CM from autologous tumor slices or adjacent normal tissue slices. (A , B) Non-adherent cells from co-cultures were stained for CD3, CD4, CD25 and intracellular Foxp3, and analyzed by flow cytometry. Representative plots of gated CD3 + CD4 + cells (A) and quantification of percentage of Foxp3 + CD25 + cells among CD3 + CD4 + cells (B) are shown (mean +- SEM, n = 19; * P < 0.05, ** P < 0.01, *** P < 0.001 by Student's t -test). (C) Expression of Treg-associated genes, assessed by qRT-PCR normalized to GAPDH , in sorted CD4 + T cells, relative to expression in cultures without DCs or CM (mean +- SEM, n = 19; * P < 0.05, ** P < 0.01, *** P < 0.001 compared with naive CD4 + T cells cultured alone by Student's t -test). (D-G) Effect of naive CD4 + T cell-derived Tregs, obtained by co-culture with TI pDCs and tumor CM as above, on function of autologous tumor-specific CD8 + T cells. Tumor-specific CD8 + T cells were generated for each subject by stimulating autologous PB CD8 + T cells with autologous tumor lysate-pulsed autologous DCs. Tregs were recovered from co-cultures by magnetic sorting. (D) CFSE-labeled CD8 + T ce
- Conjugate
- Near infrared dye
- Submitted by
- Invitrogen Antibodies (provider)
- Main image
- Experimental details
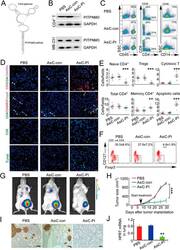
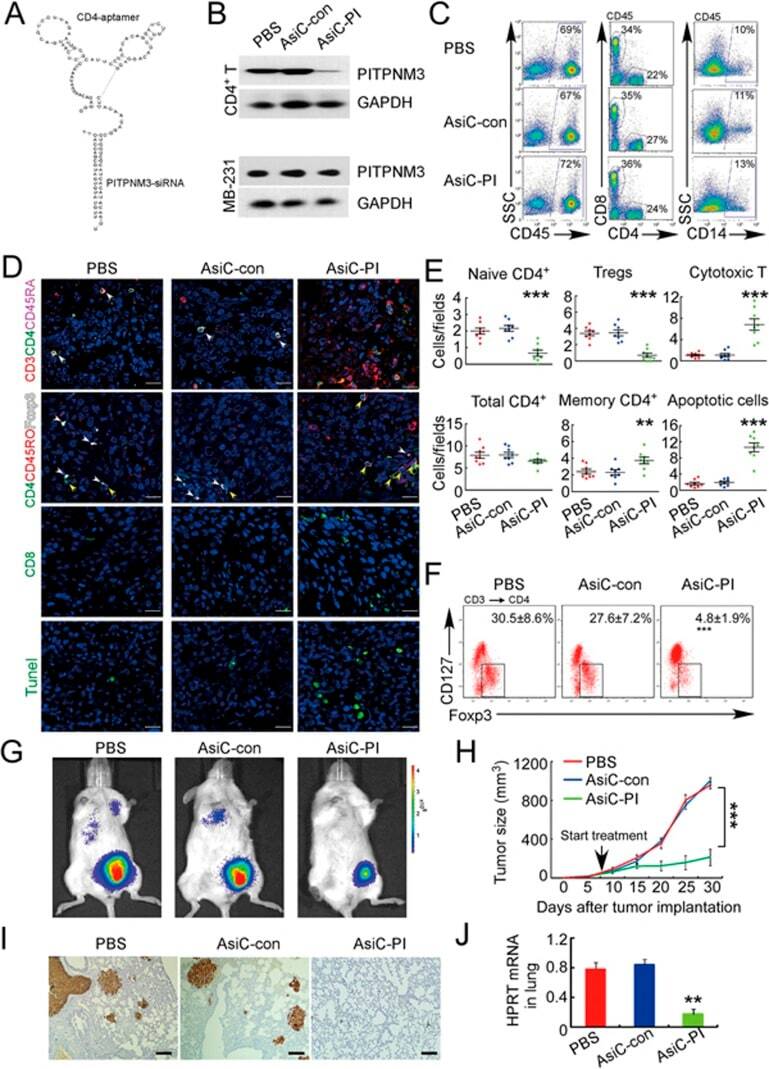
- Figure 6 In vivo knockdown of PITPNM3 in CD4 + T cells reverses immunosuppression and inhibits tumor progression in humanized mice. (A) Humanized mice bearing palpable MDA-MB-231 orthotopic xenografts were intraperitoneally injected daily for 14 days with PBS, 1 nmol CD4-aptamer-control siRNA (AsiC-con) or CD4-aptamer-siRNA targeting PITPNM3 (sequence in A , AsiC-PI) to assess the role of PITPNM3 in TI Tregs, and other T cells and tumor control. Experimental schematic is provided in Supplementary information, Figure S9A . (B) Representative immunoblots showing selective knockdown of PITPNM3 protein in PB CD4 + T cells, but not tumor xenografts ( n = 3). (C) PITPNM3 knockdown did not affect the distribution of human CD45 + hematopoietic cells, CD4 + and CD8 + T cells, and CD14 + monocytes in the peripheral blood of humanized mice. Representative flow plots are shown ( n = 3). (D , E) Effect of PITPNM3 knockdown on TI naive CD4 + , Tregs and CD8 + T cell numbers, and apoptosis by TUNEL assay in xenografts. D shows representative immunofluorescence microscopy images. Top row indicates CD4 + naive T cells by arrows; the second row indicates CD4 + CD45RO + Foxp3 - CD4 + memory T cells (yellow arrows) and Foxp3 + Tregs (white arrows). Scale bar, 50 mum. E shows number of cells of each subtype/high power field in eight mice ( ** P < 0.01, *** P < 0.001 compared to PBS group by Student's t -test). (F) Flow cytometry analysis of gated human CD3 + CD4 + cells isolated from xenogra
- Conjugate
- Near infrared dye
- Submitted by
- Invitrogen Antibodies (provider)
- Main image
- Experimental details
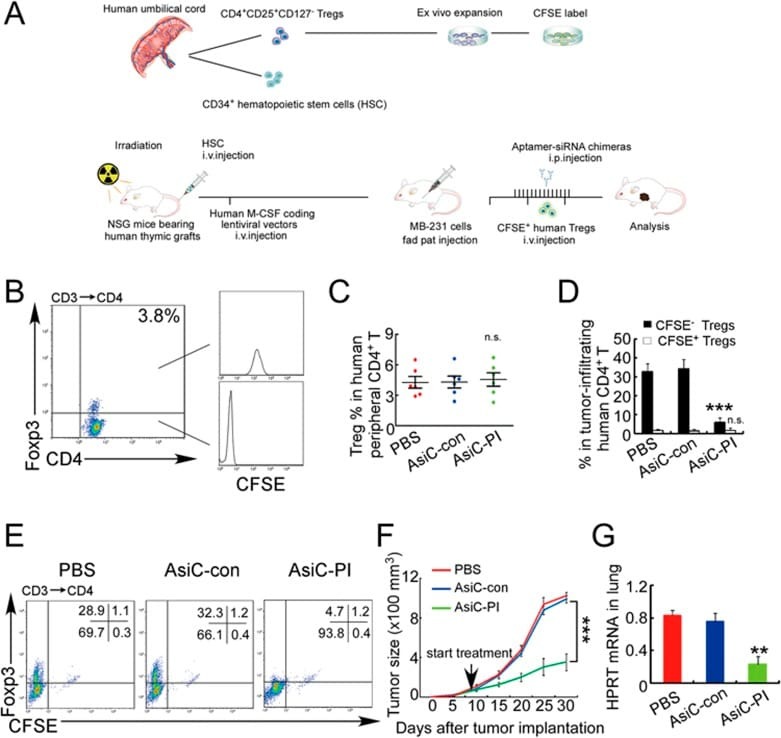
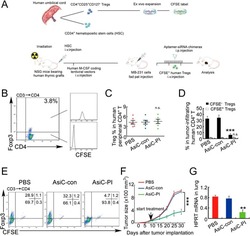
- Figure 7 CD4-aptamer-siRNA targeting PITPNM3 reduces TI Tregs and inhibits tumor progression in humanized mice with circulating human Tregs. Humanized mice, implanted with MDA-MB-231 tumors and concurrently injected intravenously with autologous Tregs, were intraperitoneally injected daily for 14 days after tumors became palpable with PBS, 1 nmol CD4-aptamer-control siRNA (AsiC-con) or CD4-aptamer-siRNA targeting PITPNM3 to assess the role of PITPNM3 in TI Tregs, and other T cells and tumor control. Tregs were administered every 10 days after the initial injection and mice were sacrificed 30 days after tumor cell inoculation. (A) Experimental schematic. (B , C) Peripheral blood cells of humanized mice were stained for human CD3, CD4 and Foxp3, and analyzed by flow cytometry. A representative flow plot (B) and the percentage (mean +- SEM) of PB CD4 + cells that are CFSE + Tregs in six mice per group (C) are shown. (D , E) Isolated cells from xenografts were stained for human CD3, CD4 and Foxp3. The percentage (mean +- SEM) of six mice per group (D) and representative flow plot (E) of FoxP3 + Tregs are shown. Most Tregs were CFSE - (i.e., did not come from infused Tregs) and the number of TI Tregs was reduced by knocking down PITPNM3 in CD4 + T cells ( *** P < 0.001 compared to the PBS group by Student's t -test). (F) Tumor size (mean +- SEM, n = 6 per group; *** P < 0.001 by two-way ANOVA with Bonferroni multiple comparison tests). (G) Lung metastases assessed by qRT-PCR
- Conjugate
- Near infrared dye