Explore
 Validate
 Learn
Learn Western blot
 Immunoprecipitation
 Flow cytometry
Antibody data
- Antibody Data
- Antigen structure
- References [41]
- Comments [0]
- Validations
- Flow cytometry [1]
- Other assay [36]
Submit
Validation data
Reference
Comment
Report error
- Product number
- 32-1700 - Provider product page

- Provider
- Invitrogen Antibodies
- Product name
- CDH11 Monoclonal Antibody (5B2H5)
- Antibody type
- Monoclonal
- Antigen
- Recombinant full-length protein
- Description
- This antibody is specific for the ~110 kDa Cadherin 11 protein. Cross-reactivity with other Cadherin family members has not been observed. This antibody is confirmed reactive with human and mouse Cadherin 11. Reactivity was confirmed on western blots using MDA.MB231 cells (human) and mouse L fibroblast lysates. For Immunohistochemistry of frozen sections, incubate 30-60 minutes at room temperature or overnight at 4°C.
- Reactivity
- Human, Mouse
- Host
- Mouse
- Isotype
- IgG
- Antibody clone number
- 5B2H5
- Vial size
- 100 μg
- Concentration
- 0.5 mg/mL
- Storage
- -20°C
Submitted references Therapeutic Effect of Cyclin-Dependent Kinase 4/6 Inhibitor on Dermal Fibrosis in Murine Models of Systemic Sclerosis.
Lasp1 regulates adherens junction dynamics and fibroblast transformation in destructive arthritis.
Regulation of Neural Circuit Development by Cadherin-11 Provides Implications for Autism.
Cadherin-11 Is Required for Neural Crest Specification and Survival.
Intrinsic Endocardial Defects Contribute to Hypoplastic Left Heart Syndrome.
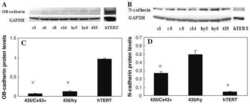
Cadherin 11 Inhibition Downregulates β-catenin, Deactivates the Canonical WNT Signalling Pathway and Suppresses the Cancer Stem Cell-Like Phenotype of Triple Negative Breast Cancer.
The cell-cell junctions of mammalian testes: II. The lamellar smooth muscle monolayer cells of the peritubular wall are laterally connected by vertical adherens junctions-a novel architectonic cell-cell junction system.
The role of cadherin-11 in microcystin-LR-induced migration and invasion in colorectal carcinoma cells.
Cadherins mediate cocaine-induced synaptic plasticity and behavioral conditioning.
PLEKHA7 defines an apical junctional complex with cytoskeletal associations and miRNA-mediated growth implications.
Genomic similarity between gastroesophageal junction and esophageal Barrett's adenocarcinomas.
Cadherin-11 involves in synovitis and increases the migratory and invasive capacity of fibroblast-like synoviocytes of osteoarthritis.
Cadherin-11 endocytosis through binding to clathrin promotes cadherin-11-mediated migration in prostate cancer cells.
Induction of entosis by epithelial cadherin expression.
Cadherin-11 regulates motility in normal cortical neural precursors and glioblastoma.
Glucocorticoids and histone deacetylase inhibitors cooperate to block the invasiveness of basal-like breast cancer cells through novel mechanisms.
Epigenetic disruption of cadherin-11 in human cancer metastasis.
A decrease in DKK1, a WNT inhibitor, contributes to placental lipid accumulation in an obesity-prone rat model.
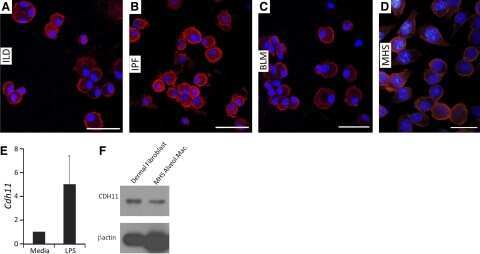
Cadherin-11 contributes to pulmonary fibrosis: potential role in TGF-β production and epithelial to mesenchymal transition.
The human cadherin 11 is a pro-apoptotic tumor suppressor modulating cell stemness through Wnt/β-catenin signaling and silenced in common carcinomas.
The tumour-associated glycoprotein podoplanin is expressed in fibroblast-like synoviocytes of the hyperplastic synovial lining layer in rheumatoid arthritis.
Endogenous versus tumor-specific host response to breast carcinoma: a study of stromal response in synchronous breast primaries and biopsy site changes.
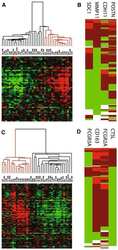
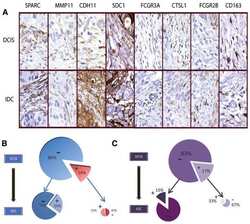
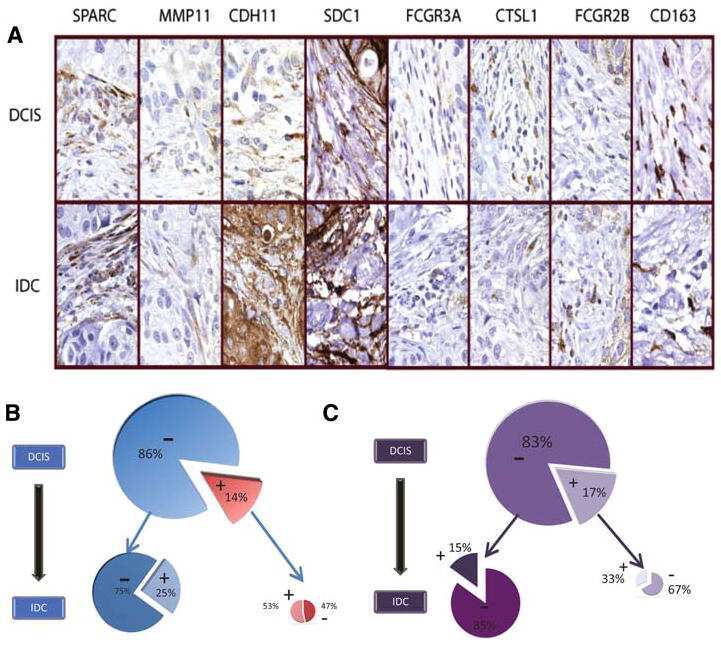
Analysis of stromal signatures in the tumor microenvironment of ductal carcinoma in situ.
Variations in stromal signatures in breast and colorectal cancer metastases.
Periostin advances atherosclerotic and rheumatic cardiac valve degeneration by inducing angiogenesis and MMP production in humans and rodents.
Co-culture with mesenchymal stromal cells increases proliferation and maintenance of haematopoietic progenitor cells.
Post-transcriptional regulation of cadherin-11 expression by GSK-3 and beta-catenin in prostate and breast cancer cells.
Expressing connexin 43 in breast cancer cells reduces their metastasis to lungs.
Tumor necrosis factor alpha drives cadherin 11 expression in rheumatoid inflammation.
Cadherin-11 promotes the metastasis of prostate cancer cells to bone.
Coexpression of two mesenchymal cadherins, cadherin 11 and N-cadherin, on murine fibroblast-like synoviocytes.
Transcriptome analysis reveals an osteoblast-like phenotype for human osteotropic breast cancer cells.
p120 catenin is essential for mesenchymal cadherin-mediated regulation of cell motility and invasiveness.
Prototypical type I E-cadherin and type II cadherin-7 mediate very distinct adhesiveness through their extracellular domains.
Expression of cadherins and catenins correlates with distinct histologic types of ovarian carcinomas.
Transforming growth factor-beta induces differentiation of the labyrinthine trophoblast stem cell line SM10.
Roles of cell-adhesion molecules nectin 1 and nectin 3 in ciliary body development.
Breast cancer metastatic potential: correlation with increased heterotypic gap junctional intercellular communication between breast cancer cells and osteoblastic cells.
Epiblast cells that express MyoD recruit pluripotent cells to the skeletal muscle lineage.
A novel cell-cell junction system: the cortex adhaerens mosaic of lens fiber cells.
An alternatively spliced cadherin-11 enhances human breast cancer cell invasion.
Yamamoto A, Saito T, Hosoya T, Kawahata K, Asano Y, Sato S, Mizoguchi F, Yasuda S, Kohsaka H
Arthritis & rheumatology (Hoboken, N.J.) 2022 May;74(5):860-870
Arthritis & rheumatology (Hoboken, N.J.) 2022 May;74(5):860-870
Lasp1 regulates adherens junction dynamics and fibroblast transformation in destructive arthritis.
Beckmann D, Römer-Hillmann A, Krause A, Hansen U, Wehmeyer C, Intemann J, de Gorter DJJ, Dankbar B, Hillen J, Heitzmann M, Begemann I, Galic M, Weinhage T, Foell D, Ai R, Kremerskothen J, Kiener HP, Müller S, Kamradt T, Schröder C, Leitão E, Horsthemke B, Rosenstiel P, Nordström K, Gasparoni G, Gasparoni N, Walter J, Li N, Yang X, Chung HR, Pavenstädt H, Lindemann N, Schnittler HJ, Wang W, Firestein GS, Pap T, Korb-Pap A
Nature communications 2021 Jun 15;12(1):3624
Nature communications 2021 Jun 15;12(1):3624
Regulation of Neural Circuit Development by Cadherin-11 Provides Implications for Autism.
Frei JA, Niescier RF, Bridi MS, Durens M, Nestor JE, Kilander MBC, Yuan X, Dykxhoorn DM, Nestor MW, Huang S, Blatt GJ, Lin YC
eNeuro 2021 Jul-Aug;8(4)
eNeuro 2021 Jul-Aug;8(4)
Cadherin-11 Is Required for Neural Crest Specification and Survival.
Manohar S, Camacho-Magallanes A, Echeverria C Jr, Rogers CD
Frontiers in physiology 2020;11:563372
Frontiers in physiology 2020;11:563372
Intrinsic Endocardial Defects Contribute to Hypoplastic Left Heart Syndrome.
Miao Y, Tian L, Martin M, Paige SL, Galdos FX, Li J, Klein A, Zhang H, Ma N, Wei Y, Stewart M, Lee S, Moonen JR, Zhang B, Grossfeld P, Mital S, Chitayat D, Wu JC, Rabinovitch M, Nelson TJ, Nie S, Wu SM, Gu M
Cell stem cell 2020 Oct 1;27(4):574-589.e8
Cell stem cell 2020 Oct 1;27(4):574-589.e8
Cadherin 11 Inhibition Downregulates β-catenin, Deactivates the Canonical WNT Signalling Pathway and Suppresses the Cancer Stem Cell-Like Phenotype of Triple Negative Breast Cancer.
Satriyo PB, Bamodu OA, Chen JH, Aryandono T, Haryana SM, Yeh CT, Chao TY
Journal of clinical medicine 2019 Jan 27;8(2)
Journal of clinical medicine 2019 Jan 27;8(2)
The cell-cell junctions of mammalian testes: II. The lamellar smooth muscle monolayer cells of the peritubular wall are laterally connected by vertical adherens junctions-a novel architectonic cell-cell junction system.
Domke LM, Franke WW
Cell and tissue research 2019 Feb;375(2):451-482
Cell and tissue research 2019 Feb;375(2):451-482
The role of cadherin-11 in microcystin-LR-induced migration and invasion in colorectal carcinoma cells.
Zhu Q, Wang Z, Zhou L, Ren Y, Gong Y, Qin W, Bai L, Hu J, Wang T
Oncology letters 2018 Feb;15(2):1417-1422
Oncology letters 2018 Feb;15(2):1417-1422
Cadherins mediate cocaine-induced synaptic plasticity and behavioral conditioning.
Mills F, Globa AK, Liu S, Cowan CM, Mobasser M, Phillips AG, Borgland SL, Bamji SX
Nature neuroscience 2017 Apr;20(4):540-549
Nature neuroscience 2017 Apr;20(4):540-549
PLEKHA7 defines an apical junctional complex with cytoskeletal associations and miRNA-mediated growth implications.
Kourtidis A, Anastasiadis PZ
Cell cycle (Georgetown, Tex.) 2016;15(4):498-505
Cell cycle (Georgetown, Tex.) 2016;15(4):498-505
Genomic similarity between gastroesophageal junction and esophageal Barrett's adenocarcinomas.
Ferrer-Torres D, Nancarrow DJ, Kuick R, Thomas DG, Nadal E, Lin J, Chang AC, Reddy RM, Orringer MB, Taylor JM, Wang TD, Beer DG
Oncotarget 2016 Aug 23;7(34):54867-54882
Oncotarget 2016 Aug 23;7(34):54867-54882
Cadherin-11 involves in synovitis and increases the migratory and invasive capacity of fibroblast-like synoviocytes of osteoarthritis.
Ding X, Zhang Y, Huang Y, Liu S, Lu H, Sun T
International immunopharmacology 2015 May;26(1):153-61
International immunopharmacology 2015 May;26(1):153-61
Cadherin-11 endocytosis through binding to clathrin promotes cadherin-11-mediated migration in prostate cancer cells.
Satcher RL, Pan T, Bilen MA, Li X, Lee YC, Ortiz A, Kowalczyk AP, Yu-Lee LY, Lin SH
Journal of cell science 2015 Dec 15;128(24):4629-41
Journal of cell science 2015 Dec 15;128(24):4629-41
Induction of entosis by epithelial cadherin expression.
Sun Q, Cibas ES, Huang H, Hodgson L, Overholtzer M
Cell research 2014 Nov;24(11):1288-98
Cell research 2014 Nov;24(11):1288-98
Cadherin-11 regulates motility in normal cortical neural precursors and glioblastoma.
Schulte JD, Srikanth M, Das S, Zhang J, Lathia JD, Yin L, Rich JN, Olson EC, Kessler JA, Chenn A
PloS one 2013;8(8):e70962
PloS one 2013;8(8):e70962
Glucocorticoids and histone deacetylase inhibitors cooperate to block the invasiveness of basal-like breast cancer cells through novel mechanisms.
Law ME, Corsino PE, Jahn SC, Davis BJ, Chen S, Patel B, Pham K, Lu J, Sheppard B, Nørgaard P, Hong J, Higgins P, Kim JS, Luesch H, Law BK
Oncogene 2013 Mar 7;32(10):1316-29
Oncogene 2013 Mar 7;32(10):1316-29
Epigenetic disruption of cadherin-11 in human cancer metastasis.
Carmona FJ, Villanueva A, Vidal A, Muñoz C, Puertas S, Penin RM, Gomà M, Lujambio A, Piulats JM, Mesía R, Sánchez-Céspedes M, Manós M, Condom E, Eccles SA, Esteller M
The Journal of pathology 2012 Oct;228(2):230-40
The Journal of pathology 2012 Oct;228(2):230-40
A decrease in DKK1, a WNT inhibitor, contributes to placental lipid accumulation in an obesity-prone rat model.
Strakovsky RS, Pan YX
Biology of reproduction 2012 Mar;86(3):81
Biology of reproduction 2012 Mar;86(3):81
Cadherin-11 contributes to pulmonary fibrosis: potential role in TGF-β production and epithelial to mesenchymal transition.
Schneider DJ, Wu M, Le TT, Cho SH, Brenner MB, Blackburn MR, Agarwal SK
FASEB journal : official publication of the Federation of American Societies for Experimental Biology 2012 Feb;26(2):503-12
FASEB journal : official publication of the Federation of American Societies for Experimental Biology 2012 Feb;26(2):503-12
The human cadherin 11 is a pro-apoptotic tumor suppressor modulating cell stemness through Wnt/β-catenin signaling and silenced in common carcinomas.
Li L, Ying J, Li H, Zhang Y, Shu X, Fan Y, Tan J, Cao Y, Tsao SW, Srivastava G, Chan AT, Tao Q
Oncogene 2012 Aug 23;31(34):3901-12
Oncogene 2012 Aug 23;31(34):3901-12
The tumour-associated glycoprotein podoplanin is expressed in fibroblast-like synoviocytes of the hyperplastic synovial lining layer in rheumatoid arthritis.
Ekwall AK, Eisler T, Anderberg C, Jin C, Karlsson N, Brisslert M, Bokarewa MI
Arthritis research & therapy 2011 Mar 7;13(2):R40
Arthritis research & therapy 2011 Mar 7;13(2):R40
Endogenous versus tumor-specific host response to breast carcinoma: a study of stromal response in synchronous breast primaries and biopsy site changes.
Wu JM, Beck AH, Pate LL, Witten D, Zhu SX, Montgomery KD, Allison KH, van de Rijn M, West RB
Clinical cancer research : an official journal of the American Association for Cancer Research 2011 Feb 1;17(3):437-46
Clinical cancer research : an official journal of the American Association for Cancer Research 2011 Feb 1;17(3):437-46
Analysis of stromal signatures in the tumor microenvironment of ductal carcinoma in situ.
Sharma M, Beck AH, Webster JA, Espinosa I, Montgomery K, Varma S, van de Rijn M, Jensen KC, West RB
Breast cancer research and treatment 2010 Sep;123(2):397-404
Breast cancer research and treatment 2010 Sep;123(2):397-404
Variations in stromal signatures in breast and colorectal cancer metastases.
Webster JA, Beck AH, Sharma M, Espinosa I, Weigelt B, Schreuder M, Montgomery KD, Jensen KC, van de Rijn M, West R
The Journal of pathology 2010 Oct;222(2):158-65
The Journal of pathology 2010 Oct;222(2):158-65
Periostin advances atherosclerotic and rheumatic cardiac valve degeneration by inducing angiogenesis and MMP production in humans and rodents.
Hakuno D, Kimura N, Yoshioka M, Mukai M, Kimura T, Okada Y, Yozu R, Shukunami C, Hiraki Y, Kudo A, Ogawa S, Fukuda K
The Journal of clinical investigation 2010 Jul;120(7):2292-306
The Journal of clinical investigation 2010 Jul;120(7):2292-306
Co-culture with mesenchymal stromal cells increases proliferation and maintenance of haematopoietic progenitor cells.
Walenda T, Bork S, Horn P, Wein F, Saffrich R, Diehlmann A, Eckstein V, Ho AD, Wagner W
Journal of cellular and molecular medicine 2010 Jan;14(1-2):337-50
Journal of cellular and molecular medicine 2010 Jan;14(1-2):337-50
Post-transcriptional regulation of cadherin-11 expression by GSK-3 and beta-catenin in prostate and breast cancer cells.
Farina AK, Bong YS, Feltes CM, Byers SW
PloS one 2009;4(3):e4797
PloS one 2009;4(3):e4797
Expressing connexin 43 in breast cancer cells reduces their metastasis to lungs.
Li Z, Zhou Z, Welch DR, Donahue HJ
Clinical & experimental metastasis 2008;25(8):893-901
Clinical & experimental metastasis 2008;25(8):893-901
Tumor necrosis factor alpha drives cadherin 11 expression in rheumatoid inflammation.
Vandooren B, Cantaert T, ter Borg M, Noordenbos T, Kuhlman R, Gerlag D, Bongartz T, Reedquist K, Tak PP, Baeten D
Arthritis and rheumatism 2008 Oct;58(10):3051-62
Arthritis and rheumatism 2008 Oct;58(10):3051-62
Cadherin-11 promotes the metastasis of prostate cancer cells to bone.
Chu K, Cheng CJ, Ye X, Lee YC, Zurita AJ, Chen DT, Yu-Lee LY, Zhang S, Yeh ET, Hu MC, Logothetis CJ, Lin SH
Molecular cancer research : MCR 2008 Aug;6(8):1259-67
Molecular cancer research : MCR 2008 Aug;6(8):1259-67
Coexpression of two mesenchymal cadherins, cadherin 11 and N-cadherin, on murine fibroblast-like synoviocytes.
Agarwal SK, Lee DM, Kiener HP, Brenner MB
Arthritis and rheumatism 2008 Apr;58(4):1044-54
Arthritis and rheumatism 2008 Apr;58(4):1044-54
Transcriptome analysis reveals an osteoblast-like phenotype for human osteotropic breast cancer cells.
Bellahcène A, Bachelier R, Detry C, Lidereau R, Clézardin P, Castronovo V
Breast cancer research and treatment 2007 Jan;101(2):135-48
Breast cancer research and treatment 2007 Jan;101(2):135-48
p120 catenin is essential for mesenchymal cadherin-mediated regulation of cell motility and invasiveness.
Yanagisawa M, Anastasiadis PZ
The Journal of cell biology 2006 Sep 25;174(7):1087-96
The Journal of cell biology 2006 Sep 25;174(7):1087-96
Prototypical type I E-cadherin and type II cadherin-7 mediate very distinct adhesiveness through their extracellular domains.
Chu YS, Eder O, Thomas WA, Simcha I, Pincet F, Ben-Ze'ev A, Perez E, Thiery JP, Dufour S
The Journal of biological chemistry 2006 Feb 3;281(5):2901-10
The Journal of biological chemistry 2006 Feb 3;281(5):2901-10
Expression of cadherins and catenins correlates with distinct histologic types of ovarian carcinomas.
Sarrió D, Moreno-Bueno G, Sánchez-Estévez C, Bañón-Rodríguez I, Hernández-Cortés G, Hardisson D, Palacios J
Human pathology 2006 Aug;37(8):1042-9
Human pathology 2006 Aug;37(8):1042-9
Transforming growth factor-beta induces differentiation of the labyrinthine trophoblast stem cell line SM10.
Selesniemi K, Reedy M, Gultice A, Guilbert LJ, Brown TL
Stem cells and development 2005 Dec;14(6):697-711
Stem cells and development 2005 Dec;14(6):697-711
Roles of cell-adhesion molecules nectin 1 and nectin 3 in ciliary body development.
Inagaki M, Irie K, Ishizaki H, Tanaka-Okamoto M, Morimoto K, Inoue E, Ohtsuka T, Miyoshi J, Takai Y
Development (Cambridge, England) 2005 Apr;132(7):1525-37
Development (Cambridge, England) 2005 Apr;132(7):1525-37
Breast cancer metastatic potential: correlation with increased heterotypic gap junctional intercellular communication between breast cancer cells and osteoblastic cells.
Kapoor P, Saunders MM, Li Z, Zhou Z, Sheaffer N, Kunze EL, Samant RS, Welch DR, Donahue HJ
International journal of cancer 2004 Sep 20;111(5):693-7
International journal of cancer 2004 Sep 20;111(5):693-7
Epiblast cells that express MyoD recruit pluripotent cells to the skeletal muscle lineage.
Gerhart J, Neely C, Stewart B, Perlman J, Beckmann D, Wallon M, Knudsen K, George-Weinstein M
The Journal of cell biology 2004 Mar 1;164(5):739-46
The Journal of cell biology 2004 Mar 1;164(5):739-46
A novel cell-cell junction system: the cortex adhaerens mosaic of lens fiber cells.
Straub BK, Boda J, Kuhn C, Schnoelzer M, Korf U, Kempf T, Spring H, Hatzfeld M, Franke WW
Journal of cell science 2003 Dec 15;116(Pt 24):4985-95
Journal of cell science 2003 Dec 15;116(Pt 24):4985-95
An alternatively spliced cadherin-11 enhances human breast cancer cell invasion.
Feltes CM, Kudo A, Blaschuk O, Byers SW
Cancer research 2002 Nov 15;62(22):6688-97
Cancer research 2002 Nov 15;62(22):6688-97
No comments: Submit comment
Supportive validation
- Submitted by
- Invitrogen Antibodies (provider)
- Main image
- Experimental details
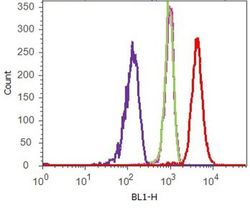
- Flow cytometry analysis of Cadherin-11 was done on HEK-293 cells. Cells were fixed with 70% ethanol for 10 minutes, permeabilized with 0.25% Triton™ X-100 for 20 minutes, and blocked with 5% BSA for 1 hour at room temperature. Cells were labeled with Cadherin-11 Mouse Monoclonal Antibody (321700, red histogram) or with mouse isotype control (pink histogram) at 2 µg - 4 µg/million cells in 2.5% BSA. After incubation at room temperature for 2 - 3 hours, the cells were labeled with Alexa Fluor® 488 Rabbit Anti-Mouse Secondary Antibody (A11059) at a dilution of 1:400 for 30 minutes at room temperature. The representative 10,000 cells were acquired and analyzed for each sample using an Attune® Acoustic Focusing Cytometer. The purple histogram represents unstained control cells and the green histogram represents no-primary-antibody control.

Supportive validation
- Submitted by
- Invitrogen Antibodies (provider)
- Main image
- Experimental details
- NULL
- Submitted by
- Invitrogen Antibodies (provider)
- Main image
- Experimental details
- NULL

- Submitted by
- Invitrogen Antibodies (provider)
- Main image
- Experimental details
- NULL

- Submitted by
- Invitrogen Antibodies (provider)
- Main image
- Experimental details
- NULL
- Submitted by
- Invitrogen Antibodies (provider)
- Main image
- Experimental details
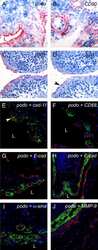
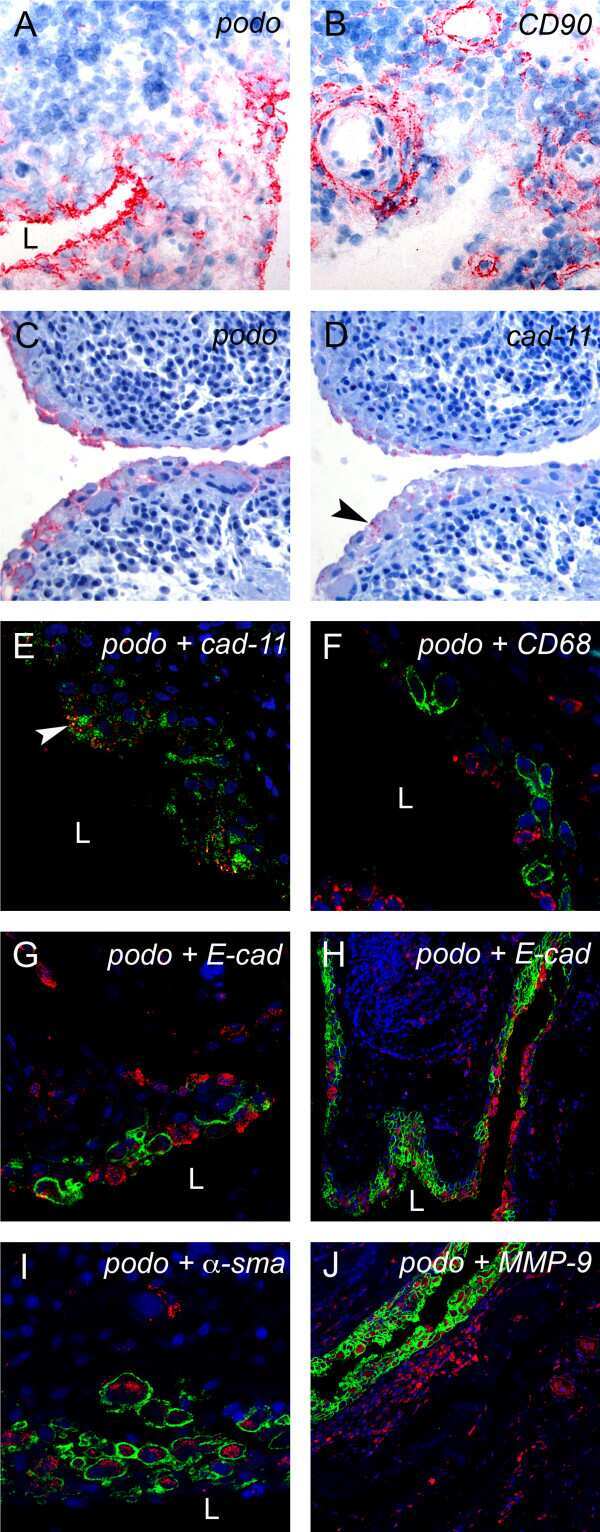
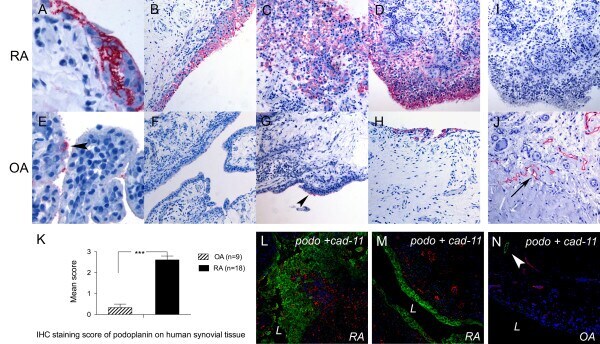
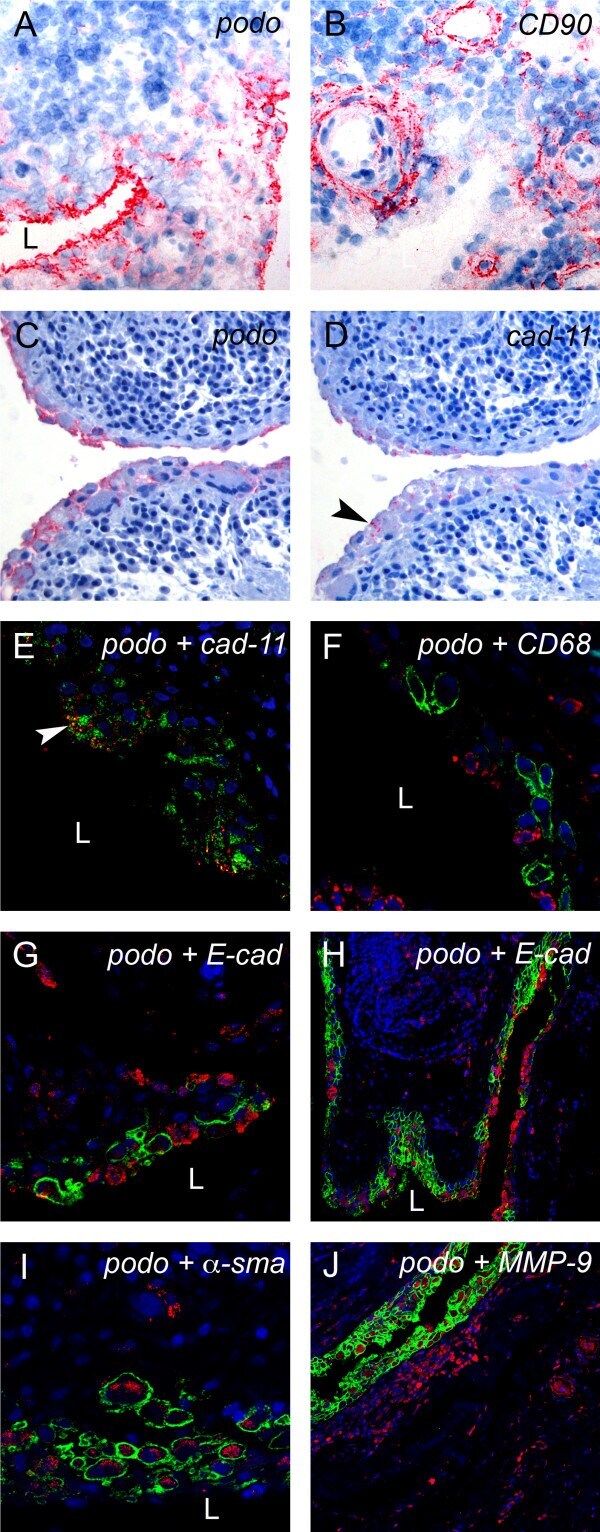
- Figure 3 Podoplanin is expressed in FLS in areas of synovial transformation . Immunohistochemistry of (A and B) frozen and (C-J) paraffin-embedded human synovial tissue from patients with rheumatoid arthritis (RA) using antibodies against (A and C) podoplanin (D2-40), (B) CD90 (AS02) and (D) cadherin-11 (3B2H5) (arrowhead). Double immunofluorescence staining analysed by confocal microscopy showing, in green, (E) podoplanin 18H5 and (F-J) podoplanin D2-40, and in red, (E) cadherin-11 (3B2H5), (F) CD68 (KP1), (G and overview in H) E-cadherin (H-108), (I) alpha-smooth muscle actin (alpha-sma) (PA1-37024) and (J) matrix metalloproteinase 9 (MMP-9). (E) Note colocalization of podoplanin and cadherin-11 (arrowhead). L, lumen.
- Submitted by
- Invitrogen Antibodies (provider)
- Main image
- Experimental details
- NULL

- Submitted by
- Invitrogen Antibodies (provider)
- Main image
- Experimental details
- NULL
- Submitted by
- Invitrogen Antibodies (provider)
- Main image
- Experimental details
- NULL

- Submitted by
- Invitrogen Antibodies (provider)
- Main image
- Experimental details
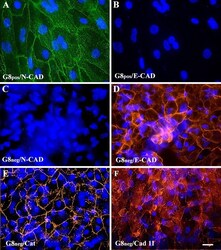
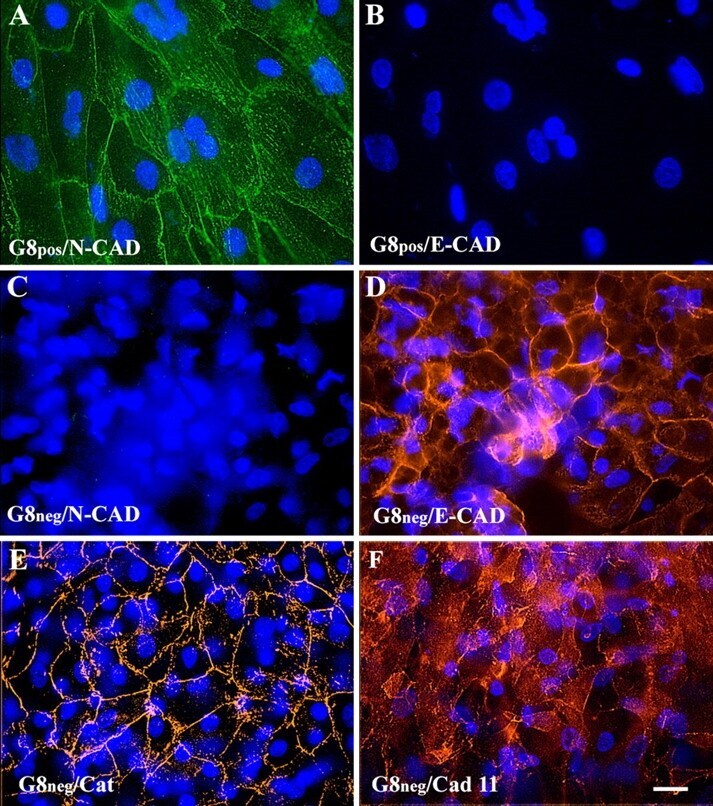
- Figure 2. Immunofluorescence localization of cadherins and beta -catenin in G8 po s and G8 neg cultures. G8 pos and G8 neg cells were isolated from stages 3 to 5 epiblasts, cultured for 5 d, and double labeled with antibodies to N- and E-cadherin (A-D), or single labeled with antibodies to cadherin 11 and beta-catenin. Most G8 pos cells expressed N- but not E-cadherin (A and B). G8 neg cultures contained cells with E- but not N-cadherin (C and D). G8 neg cells stained with antibodies to beta-catenin (E) and cadherin 11 (F). Bar, 10 mum.
- Submitted by
- Invitrogen Antibodies (provider)
- Main image
- Experimental details
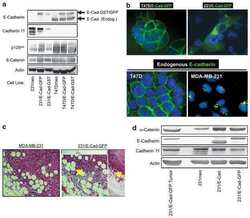
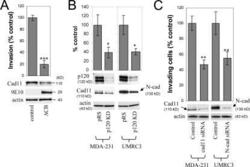
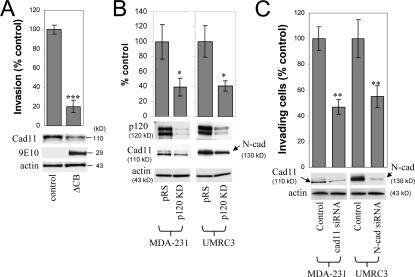
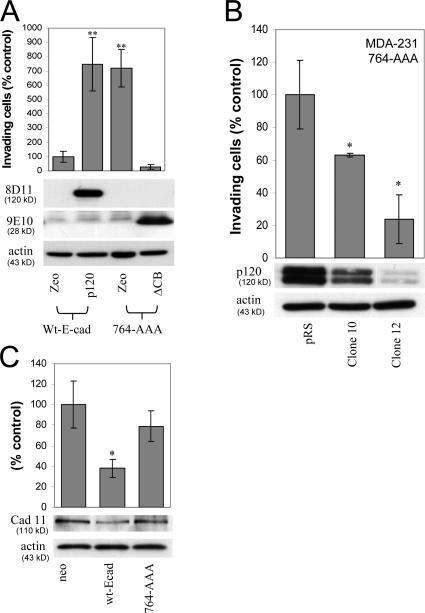
- Figure 3. Endogenous mesenchymal cadherins promote cell invasiveness. (A) Expression of the E-cadherin juxtamembrane domain inhibits cadherin 11 levels and blocks invasiveness. MDA-231 cells were infected with control retrovirus (zeo) or retrovirus expressing a small, p120-binding, myc-tagged fragment of the E-cadherin cytoplasmic tail (DeltaCB) that cannot associate with beta-catenin. Polyclonal stable cell lines were subjected to invasion assays, toward a gradient of HGF ( n = 6). (bottom) Lysates from both cell lines were subjected to SDS-PAGE and Western blotted for expression of cadherin 11, DeltaCB (using the myc tag-specific mAb 9E10), and actin. (B) p120 regulates the levels of endogenous mesenchymal cadherins. Polyclonal populations of p120-depleted MDA-231 or UMRC3 cells were examined for their expression of cadherin 11 or N-cadherin, respectively. Note that upon p120 depletion (top), levels of endogenous mesenchymal cadherins (middle and graphs) are reduced ( n = 3). (C) Endogenous mesenchymal cadherins promote cell invasiveness. MDA-231 and UMRC3 cells were transiently transfected by electroporation with either control siRNA or siRNA specific for human cadherin 11 or N-cadherin, respectively. Control experiments verified maximal knock down of cadherin expression 3 d after transfection. 2 d after transfection, cells were serum starved overnight and plated in Matrigel-coated transwells. Invasiveness was determined 24 h later in response to a gradient of HGF (MDA-231
- Submitted by
- Invitrogen Antibodies (provider)
- Main image
- Experimental details
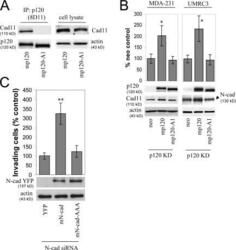
- Figure 4. p120 binding regulates the levels of endogenous mesenchymal cadherins. (A) The p120-A1-deletion mutant does not bind mesenchymal cadherins. Lysates of p120-depleted MDA-231 cells (clone 3) reexpressing murine p120 (mp120) or a murine p120 mutant lacking the first armadillo domain (mp120-A1) were immunoprecipitated with the murine p120-specific mAb 8D11. Precipitates were then subjected to SDS-PAGE and Western blotted for the presence of cadherin 11 or p120. As shown, cadherin 11 coimmunoprecipitates with wt p120 but not with mp120-A1. (right) Expression of cadherin 11 in total cell lysates of both cell lines. (B) The p120-A1-deletion mutant does not regulate the levels of endogenous mesenchymal cadherins. p120-depleted MDA-231 cells (clone 3) stably expressing control neo, mp120, or mp120-A1 were lysed and subjected to SDS-PAGE and Western blotted for expression of p120, cadherin 11, or actin as a loading control (left). (right) Similar Western blots of p120-depleted UMRC3 cells blotted for expression of N-cadherin. In both cases, reexpression of mp120, but not mp120-A1, increases mesenchymal cadherin levels. (C) p120 binding is required for the invasion-promoting effects of N-cadherin. UMRC3 cells were transiently transfected with human N-cadherin-specific siRNA together with control YFP, murine N-cadherin-YFP, or N-cad-AAA-YFP, a murine N-cadherin mutant unable to bind p120 (N-cad-AAA). In contrast to wt N-cadherin, N-cad-AAA failed to promote invasiveness. Error

- Submitted by
- Invitrogen Antibodies (provider)
- Main image
- Experimental details
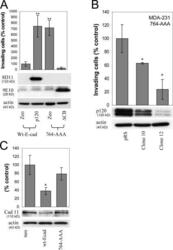
- Figure 9. p120 binding to E-cadherin suppresses invasiveness and reduces mesenchymal cadherin levels. (A) E-cadherin-free p120 promotes invasiveness. MDA-MB-231 cells stably expressing wt E-cadherin or a p120-uncoupled E-cadherin mutant (764-AAA) were infected with retroviruses expressing zeomycin resistance alone (zeo) or together with murine p120 or DeltaCB. DeltaCB is a myc-tagged truncation mutant of the E-cadherin cytoplasmic domain, which binds p120 but not beta-catenin. Invasion assays using HGF as chemoattractant were performed as described earlier ( n = 6). (bottom) Lysates from all four cell lines were subjected to SDS-PAGE and Western blotted for expression of exogenous p120 (mAb 8D11 recognizes murine but not endogenous human p120), DeltaCB (9E10), and actin as a loading control. (B) Endogenous p120 promotes the invasiveness of p120-uncoupled E-cadherin in a dose-dependent manner. MDA-231 cells expressing the p120-uncoupled 764-AAA E-cadherin mutant were infected with control pRS retrovirus or viruses expressing p120-specific shRNA. Individual clones of shRNA-expressing cells were selected and examined for levels of endogenous p120 and in vitro invasiveness toward HGF ( n = 6). Note that levels of endogenous p120 in the clonal cell lines correlate directly to their invasiveness in vitro. (C) p120 recruitment to E-cadherin inhibits cadherin 11 levels. Lysates of MDA-231 cells stably expressing control neo, wt E-cadherin, or the p120-uncoupled 764-AAA E-cadherin mut
- Submitted by
- Invitrogen Antibodies (provider)
- Main image
- Experimental details
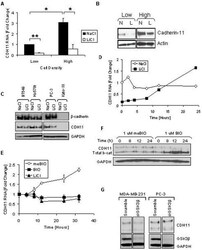
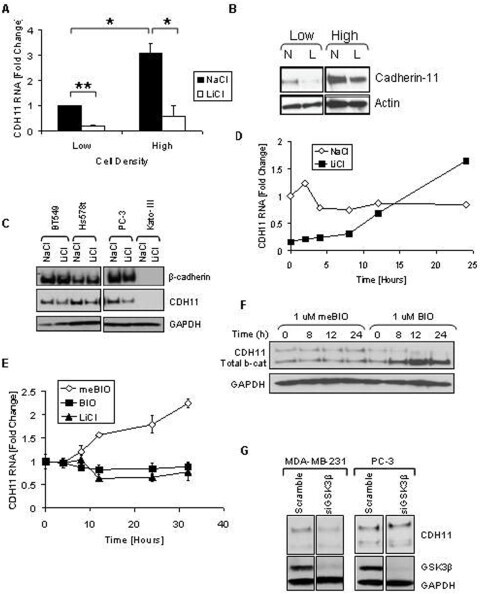
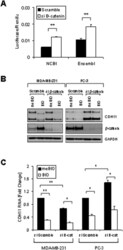
- Figure 1 Density increases cadherin-11 and GSK3beta inhibitors decrease cadherin-11 expression. A and B: MDA-MB-231 cells were plated at two densities, 50% and 90% confluency, called low and high, respectively. The cells were allowed to grow overnight in serum-free medium. 24 hours after plating cells were treated with 20 mM NaCl (N) or 20 mM LiCl (L). 24 hours after treatment, RNA and protein were collected for real-time PCR (A) and Western (B) analysis. C: Cancer cells BT549, Hs578T, PC-3, and Kato-III were plated at a medium density and allowed to adhere. Cells were then treated with 20 mM LiCl or NaCl control. 48 hours after transfection protein was collected for Western blot analysis. D: MDA-MB-231 cells were plated at a medium density, serum starved overnight, and treated with 20 mM NaCl or 20 mM LiCl. 24 hours after treatment, the cells were washed once with PBS and maintained in serum-free medium containing only 20 mM NaCl. RNA was collected at the times indicated for real-time PCR analysis. E and F: MDA-MB-231 cells were plated at a medium density and serum starved overnight. 16 hours after plating, the cells were treated with 1 muM meBIO (control), 1 muM BIO, or 20 mM LiCl. RNA (E) or protein (F) was collected at the designated times and analyzed using real-time PCR (E) and Western blot analysis (F). G: MDA-MB-231 and PC-3 cells were transfected with either non-specific scrambled siRNA (siScramble), or siRNA directed against GSK3beta (si GSK3). 48 hours after transf
- Submitted by
- Invitrogen Antibodies (provider)
- Main image

- Experimental details
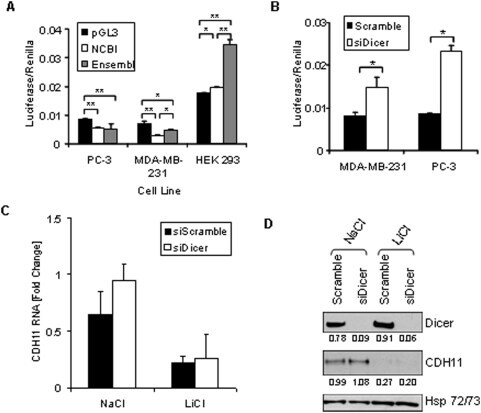
- Figure 4 The stabilizing and destabilizing effects of the cadherin-11 3'UTR. A: PC-3, MDA-MB-231, and HEK 293 cells were transfected with pGL3-Promoter, pGL3-CDH11-3'UTR NCBI, or pGL3-CDH11-3'UTR Ensembl and pCMV-Renilla. 48 hours after transfection, cells were lysed using passive lysis buffer and luciferase activity was analyzed. (* indicates a p-value >0.01; ** indicates a p-value >0.001) B: MDA-MB-231 and PC-3 cells were transfected with pGL3-CDH11 3'-UTR and pCMV-Renilla along with either non-specfic siRNA (siScramble) or siRNA directed against Dicer (siDicer). 48 hours after transfection, cells were lysed using passive lysis buffer and luciferase activity was analyzed. (* indicates a p-value >0.05) C and D: MDA-MB-231 cells were transfected with non-specific siRNA (siScramble), or siRNA directed against Dicer (si Dicer). Cells were collected for real-time PCR (C) and Western blot (D) analysis 72 hours after transfection.
- Submitted by
- Invitrogen Antibodies (provider)
- Main image

- Experimental details
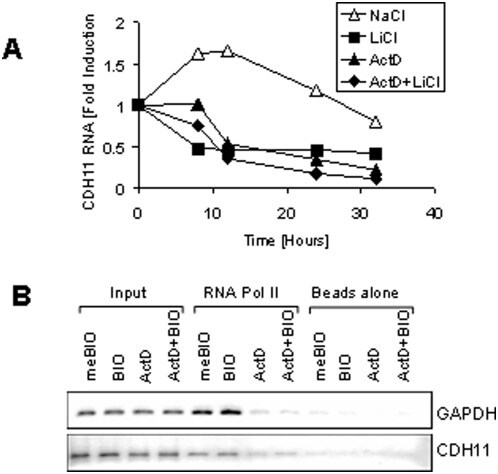
- Figure 2 Transcriptional mechanism of cadherin-11 regulation. A: MDA-MB-231 cells were grown at a medium density for 16 hours in the absence of serum. The cells were then pretreated with 5 mug/ml actinomycin D or an equivalent volume of ethanol (untreated). 30 minutes later the cells were treated with either 20 mM NaCl (control) or LiCl. At the indicated time points, RNA and protein were collect for real-time PCR analysis. B: MDA-MB-231 cells were treated with 20 mM NaCl or LiCl for 24 hours. Genomic DNA was then harvested for RNA polymerase II ChIP analysis followed by PCR specific to GAPDH and cadherin-11.
- Submitted by
- Invitrogen Antibodies (provider)
- Main image
- Experimental details
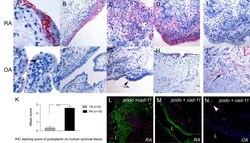
- Figure 1 Podoplanin is expressed in human synovial tissue in RA . Immunohistochemistry (IHC) of human synovial tissue from (A-D, I) rheumatoid arthritis (RA), (E-H, J) osteoarthritis (OA) (A-D, E-H, J) using antipodoplanin antibody (D2-40) or (I) mouse immunoglobulin G 1 . (J) Positive control showing lymph vessels (arrow). (K) IHC staining score of podoplanin on human synovial tissue from 18 RA and 9 OA patients. Double immunofluorescence staining of (L and M) RA and (N) OA synovium using antipodoplanin (green) and anti-cadherin-11 (red) antibodies. Note the extensive hyperplasia of the podoplanin-positive lining layer cells (C and D, L) and the podoplanin-positive lymph vessel (arrowhead in N) but negative lining layer in OA (N) . L, lumen. ***statistical significance P < 0,0001.
- Submitted by
- Invitrogen Antibodies (provider)
- Main image
- Experimental details
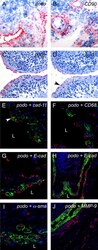
- Figure 3 Podoplanin is expressed in FLS in areas of synovial transformation . Immunohistochemistry of (A and B) frozen and (C-J) paraffin-embedded human synovial tissue from patients with rheumatoid arthritis (RA) using antibodies against (A and C) podoplanin (D2-40), (B) CD90 (AS02) and (D) cadherin-11 (3B2H5) (arrowhead). Double immunofluorescence staining analysed by confocal microscopy showing, in green, (E) podoplanin 18H5 and (F-J) podoplanin D2-40, and in red, (E) cadherin-11 (3B2H5), (F) CD68 (KP1), (G and overview in H) E-cadherin (H-108), (I) alpha-smooth muscle actin (alpha-sma) (PA1-37024) and (J) matrix metalloproteinase 9 (MMP-9). (E) Note colocalization of podoplanin and cadherin-11 (arrowhead). L, lumen.
- Submitted by
- Invitrogen Antibodies (provider)
- Main image
- Experimental details
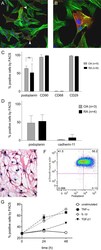
- Figure 4 Podoplanin is expressed in cultured primary FLS and the expression is increased by pro-inflammatory cytokines . (A) Immunofluorescence staining of primary rheumatoid arthritis fibroblast-like synoviocytes (RA-FLS) showing podoplanin (red) and actin stress fibres (green). Note accumulated podoplanin staining in membrane protrusions (arrowheads). (B) Magnification of podoplanin-positive RA-FLS. (C and D) Flow cytometry (FACS) of primary FLS cultures from patients with RA (filled bars) and patients with osteoarthritis (OA) (striped bars) showing the percentage of positive cells of viable cell populations using (C) antipodoplanin and phenotype markers (CD90, CD68 and CD29) and (D) cadherin-11 antibodies. (E) Immunocytochemistry of an aggressively growing RA-FLS culture using antipodoplanin antibody. Note the dendritic phenotype with long cytoplasmatic protrusions. (F) Representative flow cytometry plot of primary RA-FLS stained for podoplanin and alpha-smooth muscle actin (alpha-sma) showing the double-positive population (podoplanin + and alpha-sma + ) of 58.2% in the upper right quadrant. (G) Graph showing the percentage of podoplanin-positive primary FLS by flow cytometry at baseline, 24 and 48 hours of stimulation with control (complete medium) (open circles), 10 ng/ml tumour necrosis factor (TNF)-alpha (filled squares), 1 ng/ml interleukin (IL)-1beta (open diamond) and 1 ng/ml transforming growth factor beta receptor 1 (TGF-beta1) (filled triangles), respectively, o
- Submitted by
- Invitrogen Antibodies (provider)
- Main image
- Experimental details
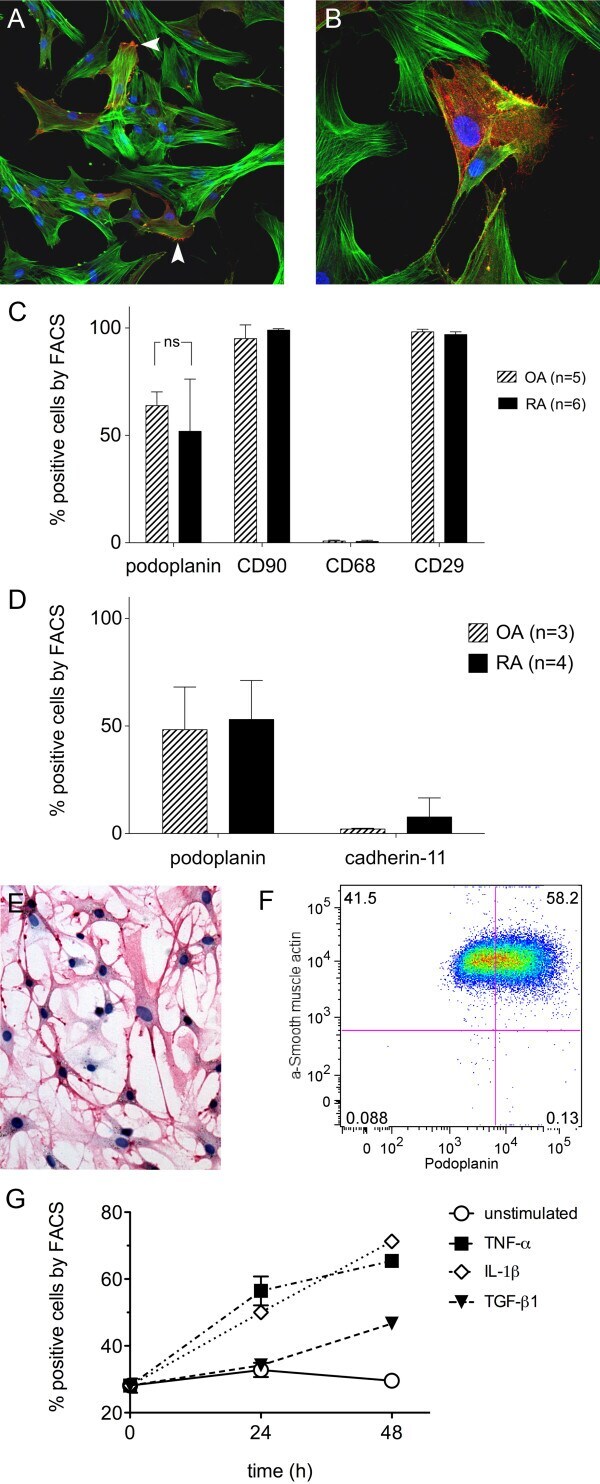
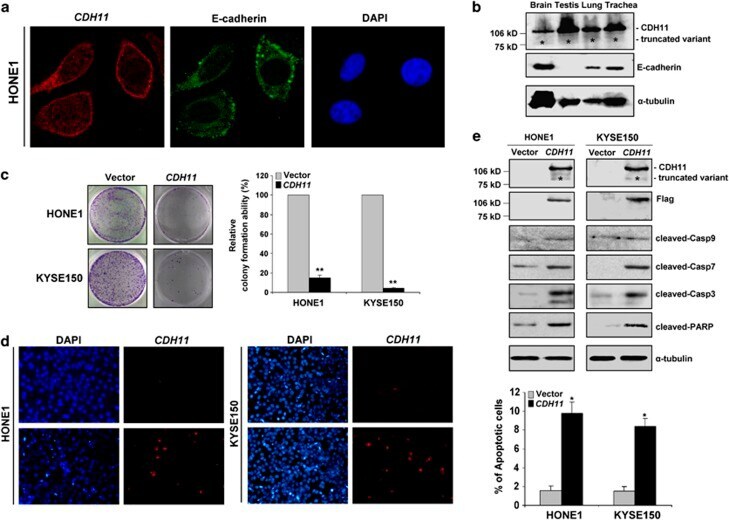
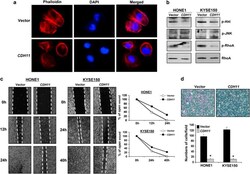
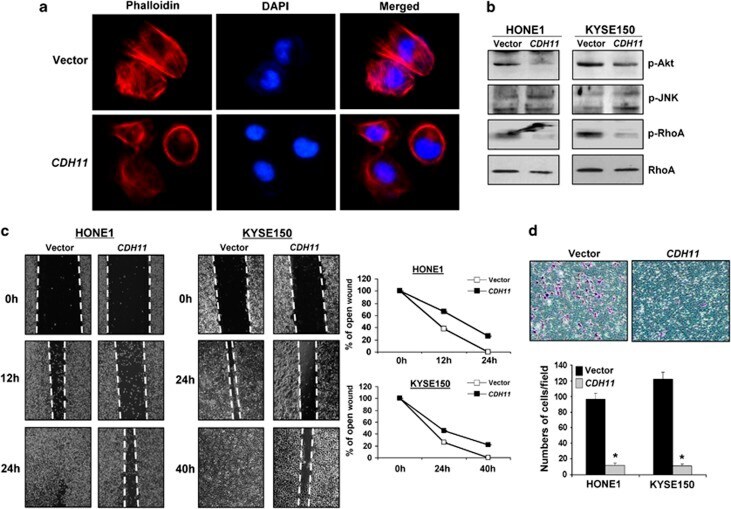
- Figure 5 Subcellular localization and functional analyses of CDH11. ( a ) Confocal microscopy assay showed that CDH11 (red) is clearly expressed on the cell membrane in CDH11 -transfected HONE1 cells using mouse anti-CDH11 monoclonal antibody, with double immunostaining for E-cadherin (green) as a control. DAPI counterstaining (blue) was used to visualize DNA. ( b ) CDH11 and E-cadherin protein expression detected in human normal tissues of brain, testis, lung and trachea by western blot. *Indicates truncated variant band. ( c ) CDH11 inhibits tumor cell growth. Representative colony formation assays. Quantitative analyses of colony numbers are shown in the right as values of mean+-s.d., * P
- Submitted by
- Invitrogen Antibodies (provider)
- Main image
- Experimental details
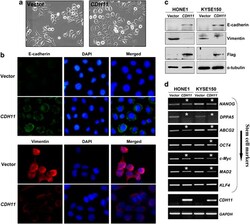
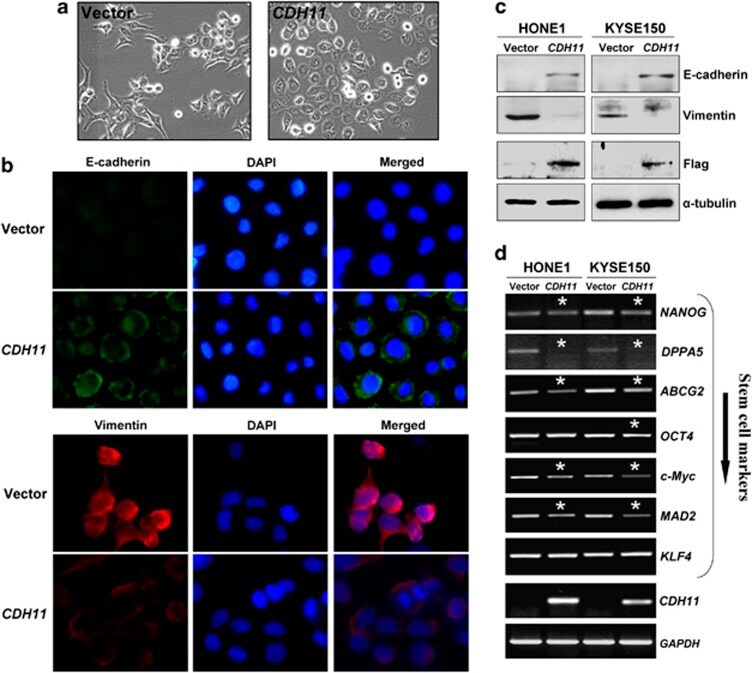
- Figure 8 ( a ) Morphology changes of HONE1 cells transfected with CDH11 or empty vector by phase-contrast microscopy. Original magnification, x 400. ( b ) Indirect immunofluorescence detecting the expression of E-cadherin and Vimentin in CDH11 - or vector-transfected HONE1 cells. ( c ) Western blot showing the expression of E-cadherin and Vimentin in CDH11- or vector-transfected cells. alpha-Tubulin was used as a loading control. ( d ) Downregulation of representative stem cell markers in CDH11 -transfected tumor cells. *Indicates significantly downregulated bands.
- Submitted by
- Invitrogen Antibodies (provider)
- Main image
- Experimental details
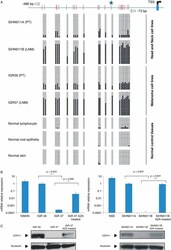
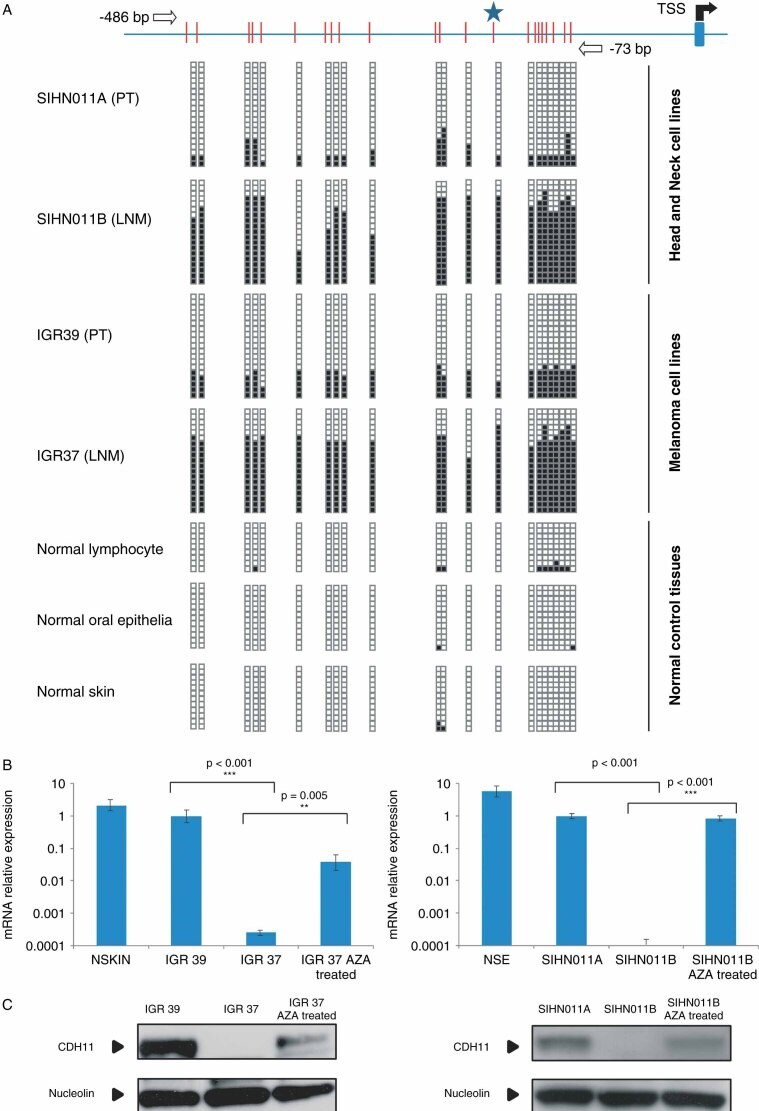
- Figure 2 DNA methylation-associated transcriptional silencing of CDH11 . (A) Bisulphite genomic sequencing of CDH11 promoter CpG Island. CpG dinucleotides are represented as short vertical lines and the transcriptional start site (TSS) is represented as a long black arrow over a blue stripe. The locations of the bisulphite genomic sequencing primers are indicated by white arrows. A minimum of eight single clones are shown for each sample. Presence of a methylated or unmethylated cytosine is indicated by a black or a white square, respectively. (B) Quantification of CDH11 mRNA expression levels in IGR39, IGR37, SIHN011A and SIHN011B cell lines and normal control tissues by qRT-PCR. Values are expressed as mean +- SD of three independent experiments, each conducted in triplicate; p values were obtained from Student's t -tests. (C) Quantification of CDH11 protein by western blot; nucleolin was used as the loading control
- Submitted by
- Invitrogen Antibodies (provider)
- Main image
- Experimental details
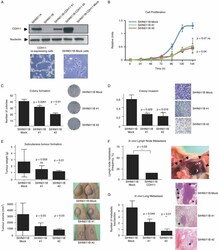
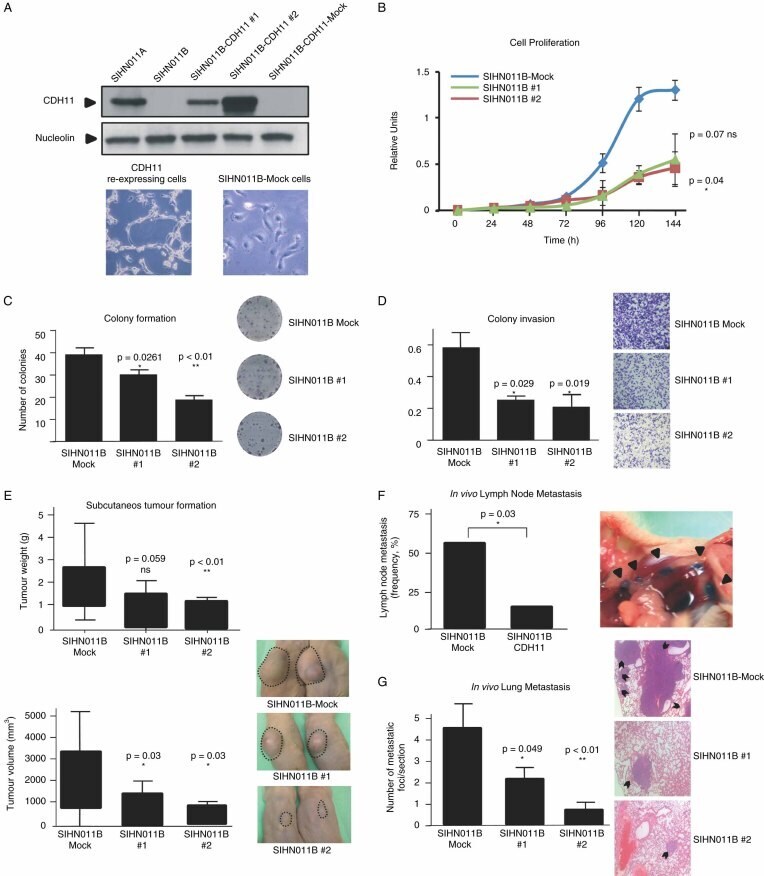
- Figure 3 Restoration of CDH11 expression in metastatic cancer cells reduces growth, motility and dissemination. (A) Full-length cDNA sequence of CDH11 was cloned in pEGFP-IRES plasmid for stable transfection of cadherin-11 in SIHN011B cells. Two transfected clones (SIHN011B #1 and SIHN011B #2) are shown. (B) Cell proliferation differences between CDH11 -expressing clones and the corresponding controls determined by the MTT assay and monitored for 6 days; values displayed were obtained from independent experiments with 15 replicates and expressed as mean +- SD; p values were obtained from Student's t -tests. (C) Colony formation assay. The number of colonies formed 2 weeks after seeding 1000 cells on 35 mm plates and maintained on selection media were quantified and plotted; p values were obtained from Student's t -tests. (D) Invasiveness assessment, using the Matrigel-coated Boyden chamber assay. The number of cells invading through the membrane was quantified after 48 h of incubation. Images show a representative field of the membrane, and were taken at x 20 magnification; values are expressed as mean +- SD; p values were obtained from Student's t -tests. (E) Inhibitory effects of CDH11 expression on tumourigenicity. Head and neck metastatic cells transfected with CDH11 or empty vector were injected into the flanks of SCID mice. Tumour weight and volume were measured after 21 days. Bars represent the standard error of the mean (SEM); p values were obtained fro
- Submitted by
- Invitrogen Antibodies (provider)
- Main image
- Experimental details
- Figure 4 Depletion of CDH11 expression enhances growth and motility of cancer cells derived from primary tumours. (A) Depletion of CDH11 expression was achieved through stable CDH11 shRNA vector transfection (SIHN011A-57/5), compared with the scrambled shRNA-transfected control cells (SIHN011A-Scb). (B) Proliferation rates assessed by the MTT assay were registered over 5 days. Values represented were obtained from independent experiments with 15 replicates and expressed as mean +- SD; p value obtained from Student's t -test. (C) Colony formation assay. The numbers of colonies formed after 2 weeks were quantified and plotted; a significant increase in the number of colonies was noted in the CDH11 -knockdown cells; p value was obtained from Student's t -test. (D) Invasiveness assessment using the Matrigel-coated Boyden chamber assay; the number of cells invading through the membrane was quantified after 48 h of incubation. Cadherin-11-depleted cells SIHN011A-57/5 had significant increased invasive capacities with respect to the control SIHN011A-Scb cells. Values are expressed as mean +- SD; p value was obtained by Student's t -test. Images show a representative field of the membrane and were taken at x 20 magnification. (E) Enhancing effects of CDH11 down-regulation on tumourigenicity in athymic nude mice. The head and neck metastatic cells shRNA depleted for CDH11 and the scrambled shRNA control cells were injected into the flanks of SCID mice. Tumour weight and

- Submitted by
- Invitrogen Antibodies (provider)
- Main image

- Experimental details
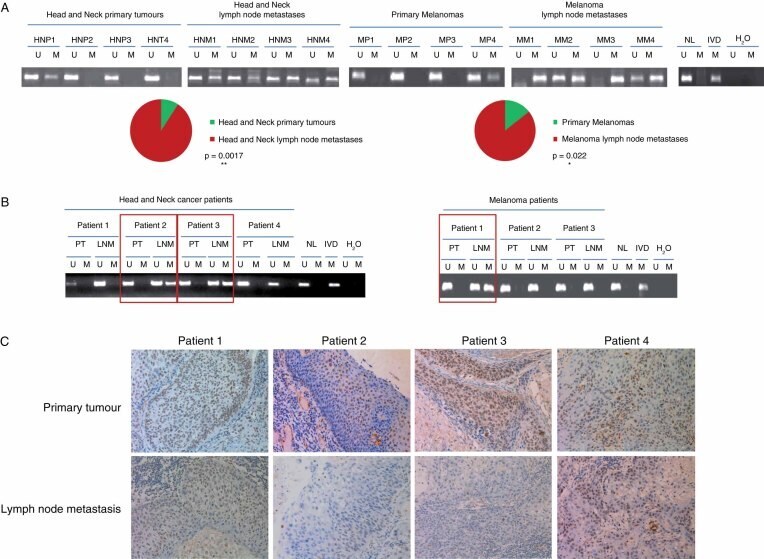
- Figure 5 Epigenetic inactivation of CDH11 occurs preferentially in the lymph node metastases of cancer patients. (A) Methylation-specific PCR was performed on bisulphite-treated DNA extracted from primary tumour and lymph node metastases of head and neck cancer and melanoma patients. The presence of a band under the U or M lanes indicates unmethylated or methylated sequences, respectively. Normal lymphocytes (NLs) and in vitro methylated DNA (IVD) are shown as positive controls for the unmethylated and methylated sequences, respectively. The significant enrichment of CDH11 hypermethylation in lymph node metastasis in comparison to primary tumours is represented in the pie diagrams below; p value was obtained from Fisher's exact test. (B) CDH11 methylation-specific PCR analysis of matched primary tumour/lymph node metastasis from seven patients shows the confinement of CDH11 hypermethylation in the disseminated samples. (C) Expression of the CDH11 protein by immunohistochemistry in paired primary tumour/metastasis samples of the four head and neck cancer patients studied in Figure 5 B. The presence of CDH11 CpG island hypermethylation was associated with CDH11 loss, whereas an unmethylated CDH11 CpG island was linked to the presence of the CDH11 protein
- Submitted by
- Invitrogen Antibodies (provider)
- Main image

- Experimental details
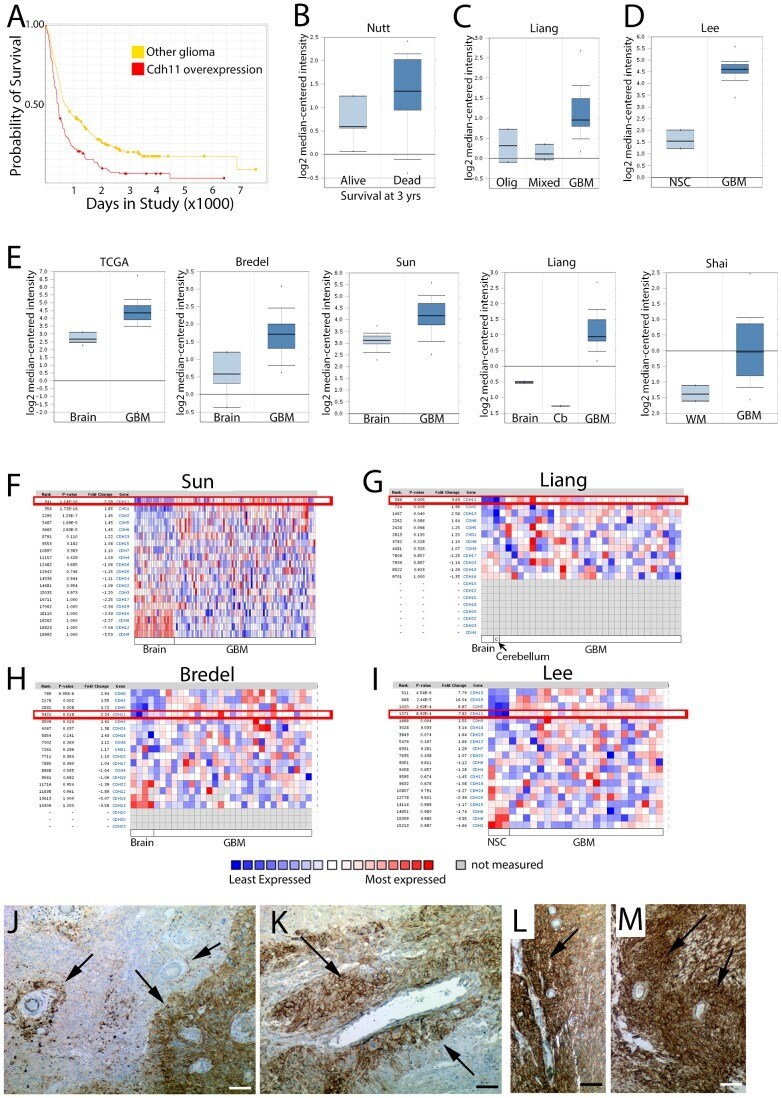
- Figure 3 CDH11 is differentially expressed in human glioma vs. normal brain, and overexpression confers worsened prognosis. ( A ) Kaplan-Meier Survival Plot for samples with differential CDH11 gene expression reveal that glioma patients with overexpression (red curve) have a worse prognosis than patients with intermediate expression. Log-rank P-value for Up-Regulated vs. Intermediate = 3.8535E-6. Data from NCI 2005< http://rembrandt.nci.nih.gov >. ( B ) CDH11 expression is predictive for survival in GBM; fold-change 3.6, P = 0.005 by T-test (Data from [38] ). ( C ) CDH11 expression is higher in GBM vs. mixed glioma or oligodendroglial tumors; fold-change = 1.8, P = 5.83x10 -4 by T-Test (Data from [39] ). ( D ) CDH11 expression is higher in GBM vs. neural stem cells. Fold change = 7.8, P = 8.92x10 -4 (Data from [40] ). ( E ) CDH11 is relatively overexpressed in GBM vs. normal brain tissue. TCGA glioblastoma dataset analysis shows 2.9 fold overexpression of CDH11 (P = 1.14x10 -10, T-Test). GBM vs. Normal in (Bredel [41] ): 2.2 fold increase; P = 0.018 (T-test). GBM vs. Normal (Sun [42] ): 2.1 fold increase (P = 1.14x10 -16 , T-test). GBM vs. normal (Liang [39] ): 3.6 fold increase (P = 0.005, T-test). GBM vs. WM (Shai [43] ): 2.5 fold overexpression compared to white matter (P = 9.75x10 -8 ; T-test). ( F-I ) Relative expression of cadherin genes in GBM vs. normal from [42] ( F ), [39] ( G ), [41] ( H ), and [40] ( I ) reveals that CDH11 (boxed in red) is differentially regulate
- Submitted by
- Invitrogen Antibodies (provider)
- Main image
- Experimental details
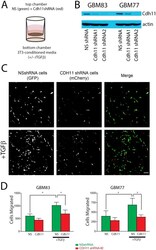
- Figure 5 CDH11 knockdown reduces TGFbeta-induced glioma cell motility. ( A ) Equal numbers of GBM cells expressing non-silencing shRNA and mCherry are seeded on the top of a porous polycarbonate membrane with GBM cells expressing shRNA to CDH11 and GFP and allowed to migrate towards bottom chamber with 3T3-conditioned. ( B ) Western blot confirming protein knockdown in shRNA treatments. ( C ) Images from the bottom of the polycarbonate filter showing control NS cells and CDH11 knockdown cells, quantified in ( D ) N = 3 biological replicates for each cell line; repeated measures ANOVA P = 0.01 (Line 83); 0.0308 (Line 77); * P

- Submitted by
- Invitrogen Antibodies (provider)
- Main image
- Experimental details
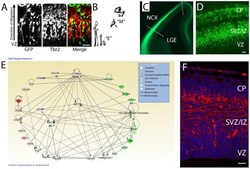
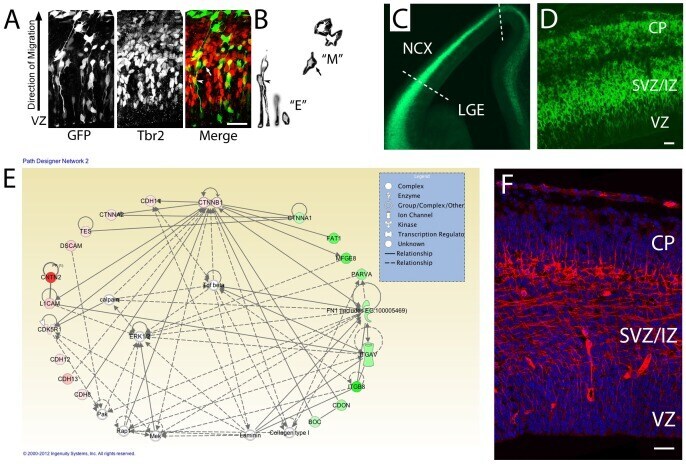
- Figure 1 Network analysis of dynamically-regulated adhesion molecules reveal that cortical cells express Cdh11 as they transition from polarized epithelial to multipolar migratory cells and exit the VZ. ( A ) VZ cells electroporated with GFP expression plasmid reveal both polarized epithelial morphology ""E"" and multipolar migratory morphology ""M"" in the developing cortex. Immunostaining for the intermediate progenitor marker Tbr2 (Eomes) highlight cells undergoing the transition from E (arrowhead) to M (arrow). ( B ) Images extracted from the GFP image in ( A ) showing cells with epithelial ""E"" and multipolar ""M"" morphology. ( C, D ) Section of E12.5 Eomes:GFP reporter mouse. Dotted lines show how the cortex was separated, then dissociated into single cells for FACS. ( D ) Higher power image through E12.5 Eomes:GFP reporter mouse. ( E ) >3-fold up and >3-fold down regulated adhesion molecules were imported with beta-catenin to populate the IPA network. Green colors indicate genes with higher expression in VZ and red indicate higher expression outside VZ. Solid lines indicate direct protein-protein interactions. (F) Immunoreactivity for CDH11 in E14.5 mouse cerebral cortex showing enriched expression in SVZ/IZ and deeper CP. Bar = 50 um.
- Submitted by
- Invitrogen Antibodies (provider)
- Main image
- Experimental details
- Figure 5 beta-catenin as a regulator of cadherin-11 expression. A: PC-3 cells were transfected with pGL3-CDH11-3'UTR NCBI or pGL3-CDH11-3'UTR Ensembl and pCMV-Renilla and along with either non-specific siRNA or siRNA directed against CTNNB1. 48 hours after transfection cells were were lysed using passive lysis buffer and luciferase activity was analyzed. Luciferase activity was normalized to renilla activity. (** indicates a p-value >0.001). B: MDA-MB-231 and PC-3 cells were transfected with either non-specific scrambled siRNA (siScramble) or siRNA directed against CTNNB1 (si beta-cat). 24 hours after transfection cells were treated with 1 muM BIO or meBIO (control). 48 hours after transfection protein was isolated for Western blot analysis. C: MDA-MB-231 and PC-3 cells were transfected with either non-specific scrambled siRNA (siScramble) or siRNA directed against CTNNB1 (si beta-cat). 24 hours after transfection cells were treated with 1 muM BIO or meBIO (control). 48 hours after transfection RNA was isolated for real-time PCR analysis. (* indicates a p-value >0.05; ** indicates a p-value >0.005)

- Submitted by
- Invitrogen Antibodies (provider)
- Main image
- Experimental details
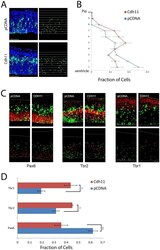
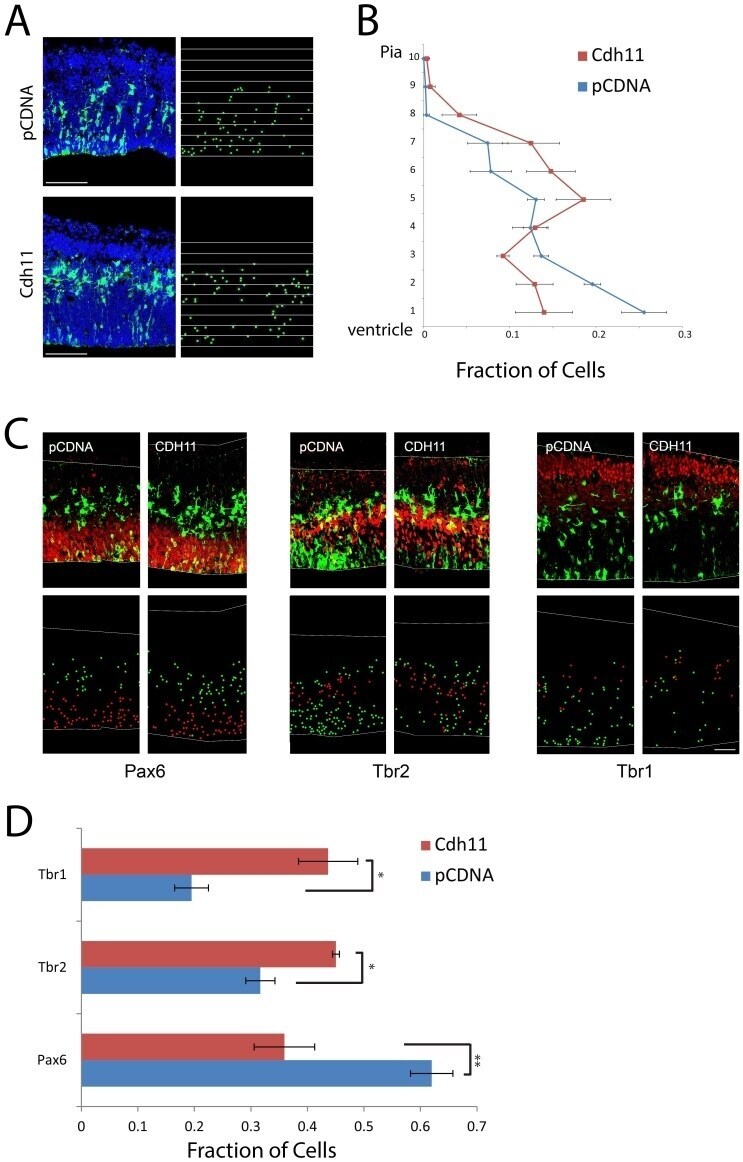
- Figure 2 Overexpression of CDH11 in cortical VZ precursors causes premature exit from the VZ and neuronal differentiation. ( A ) E13.5 cortical precursors were electroporated in utero using either pCDNA control (N = 4) (top) or with pCAG-Cdh11 expression plasmid along with pCAG-EGFP plasmid (N = 4) and analyzed at E14.5. Electroporated cells were identified with antibody staining against GFP and sections counterstained with the DNA dye DAPI (pseudocolored blue). To quantify changes in cortical positioning of electroporated cells, ten equal sized bins were drawn over each image. Each white dot corresponds with the soma of an electroporated cell. Bar = 100 um. ( B ) The fraction of the total GFP+ cells in each of the ten bins was then graphed for the two experimental conditions. Brackets indicate 1 SEM. N = 4 brains (PCDNA), 3 brains (Cdh11). ( C ) Sections were stained for radial glial marker Pax6, intermediate progenitor marker Tbr2, and neuronal marker Tbr1. Electroporated cells are pseudocolored green, and the respective antigens, red. Bar = 50 um. The dot plots highlight the cell bodies of electroporated cells, with red representing electroporated cells that express the marker of interest and green indicating electroporated cells that do not express the marker. ( D ) Histograms represent fraction of total electroporated cells found in each brain region, showing the fraction of cells that express each marker after electroporation (red/(red+green)), showing premature neurona
- Submitted by
- Invitrogen Antibodies (provider)
- Main image
- Experimental details
- Figure 7 ( a ) Impaired actin stress fiber organization in CDH11 -expressing HONE1 cells. Original magnification, x 400. ( b ) Expression of several key regulators of actin stress fiber reorganization in CDH11 - and vector-transfected cells. Western blot analysis was done using antibodies against phospho-Akt, phospho-JNK, phospho-Rho A and total Rho A. ( c ) Wound-healing assay of tumor cells transfected with either vector or CDH11. Pictures were taken at 0, 12, 24 or 40 h. Right panel: width of remaining open wound measured in relation to time 0 h separation. ( d ) CDH11 inhibited the invasive activity of tumor cells. Original magnification, x 400. * P
- Submitted by
- Invitrogen Antibodies (provider)
- Main image
- Experimental details
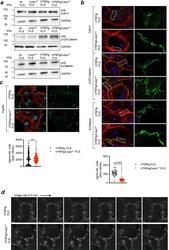
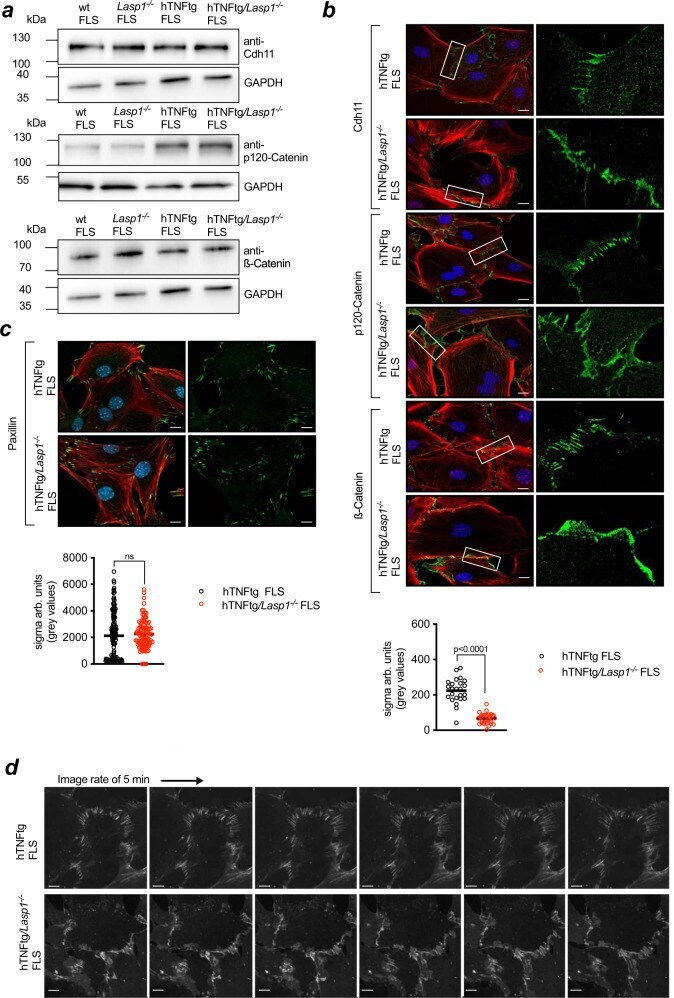
- Fig. 4 Lasp1 deficiency alters cadherin-11 containing cell-to-cell contacts. a Immunoblotting for adherens junction proteins (Cdh11 = Cadherin-11, p120-Catenin and beta-Catenin) in FLS from wt, Lasp1 -/- , hTNFtg and hTNFtg /Lasp1 -/- mice (representative images from n = 4 independent experiments). b Immunocytochemical staining of these AJ proteins in FLS from hTNFtg and hTNFtg /Lasp1 -/- mice in green, the F-Actin cytoskeleton with Phalloidin-Rhodamine in red and the nuclei with DAPI in blue (representative images of n = 9 per group, scale bar: 10 um). Furthermore, the differences in zipper-formation quantified by variance analysis. Intensity profile of beta-Catenin staining was determined by measuring fluctuation of signal intensity in linescans parallel to cell periphery (hTNFtg FLS n = 7 reslices from 24 cells; hTNFtg /Lasp1 -/- FLS n = 7 reslices from 30 cells). c Immunocytochemical staining of the cell-matrix marker Paxillin in FLS from hTNFtg and hTNFtg /Lasp1 -/- mice in green, the F-Actin cytoskeleton with Phalloidin-Rhodamine in red and the nuclei with DAPI in blue (representative images of n = 4 per group, scale bar: 10 um). Differences in formation quantified by variance analysis. The stainings were quantified by measuring fluctuation of signal intensity in linescans parallel to cell periphery (hTNFtg FLS n = 4 reslices from 144 cells; hTNFtg /Lasp1 -/- FLS n = 4 reslices from 102 cells). d Live-cell fluorescence imaging of FLS from hTNFtg and hTNFtg /Lasp1 -/- mi
- Submitted by
- Invitrogen Antibodies (provider)
- Main image
- Experimental details
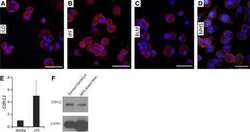
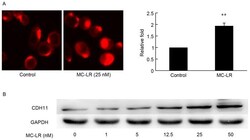
- Figure 2. MC-LR induces the expression of CDH11 in HT-29 cells. Expression of CDH11 in HT-29 cells was detected by (A) cellular immunofluorescence and (B) western blotting analysis of CDH11 following treatment by MC-LR at different doses (0, 1, 5, 12.5, 25 and 50 nM) with GAPDH expression acting as the loading control. The fluorescence intensity of CDH11 of each immunofluorescence sample was calculated and analyzed. Magnification, x400. Bars represent mean +- standard deviation of fluorescence intensity from three independent experiments. **P

- Submitted by
- Invitrogen Antibodies (provider)
- Main image

- Experimental details
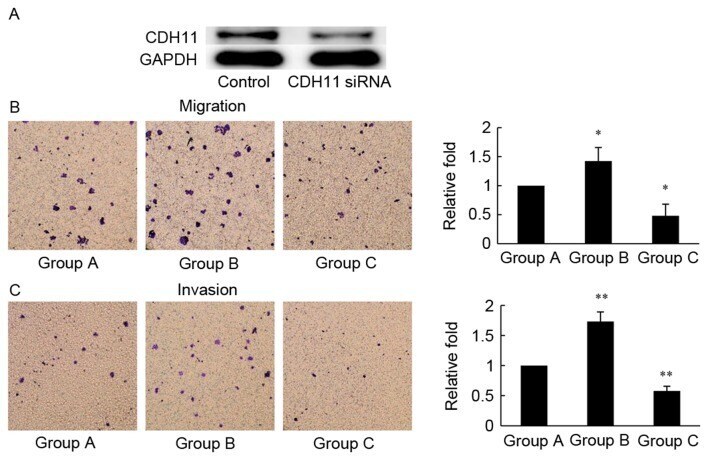
- Figure 3. MC-LR-induced migration and invasion is antagonized by CDH11-siRNA in HT-29 cells. (A) HT-29 cells were transfected with CDH11 or negative control siRNA for 48 h, and CDH11 protein levels were evaluated using western blotting analysis. GAPDH was probed as an internal control. (B) Cell migration assay (72 h) and (C) cell invasion assay (96 h) was performed to assess the motility and invasiveness of HT-29 cells following treatment with: Group A, negative control siRNA; Group B, negative control siRNA and MC-LR (25 nM); and Group C, CDH11 siRNA and MC-LR (25 nM). Magnification, x400. Bars represent mean +- standard deviation of numbers of translocated cells from three independent experiments. *P
- Submitted by
- Invitrogen Antibodies (provider)
- Main image
- Experimental details
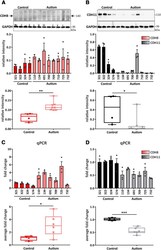
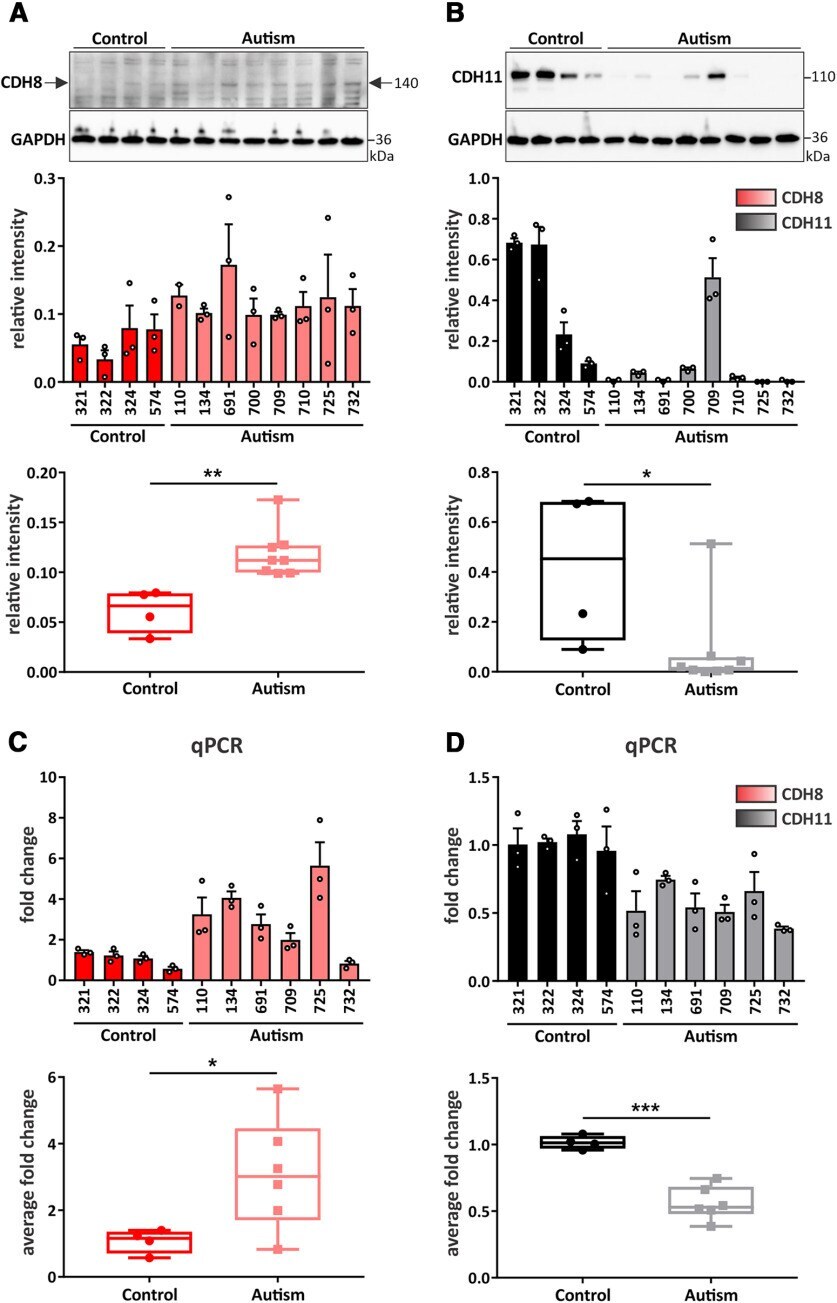
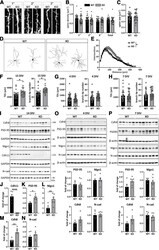
- Figure 5. iPSC-derived cortical NPCs and organoids from autistic individuals show altered expression of CDH8 and CDH11. Western blot analysis and quantification of ( A ) CDH8 and ( B ) CDH11 expression in iPSC-derived cortical NPCs from typically-developing control and autistic individuals at 19 DIV. Quantification of the expression of each cadherin is represented as bar graph and as box and whisker plot; * p < 0.05, ** p < 0.01; unpaired two-tailed t test. N = 4 control and 8 autistic individuals, triplicates of each individual. Cadherin signals were normalized to GAPDH. Quantification of mRNA expression of ( C ) CDH8 and ( D ) CDH11 in cortical organoids derived from iPSCs of control and autistic individuals at 60 DIV via qPCR; * p < 0.05, *** p < 0.001; unpaired two-tailed t test. N = 4 control and 6 autism individuals, triplicates of each individual.
- Submitted by
- Invitrogen Antibodies (provider)
- Main image
- Experimental details
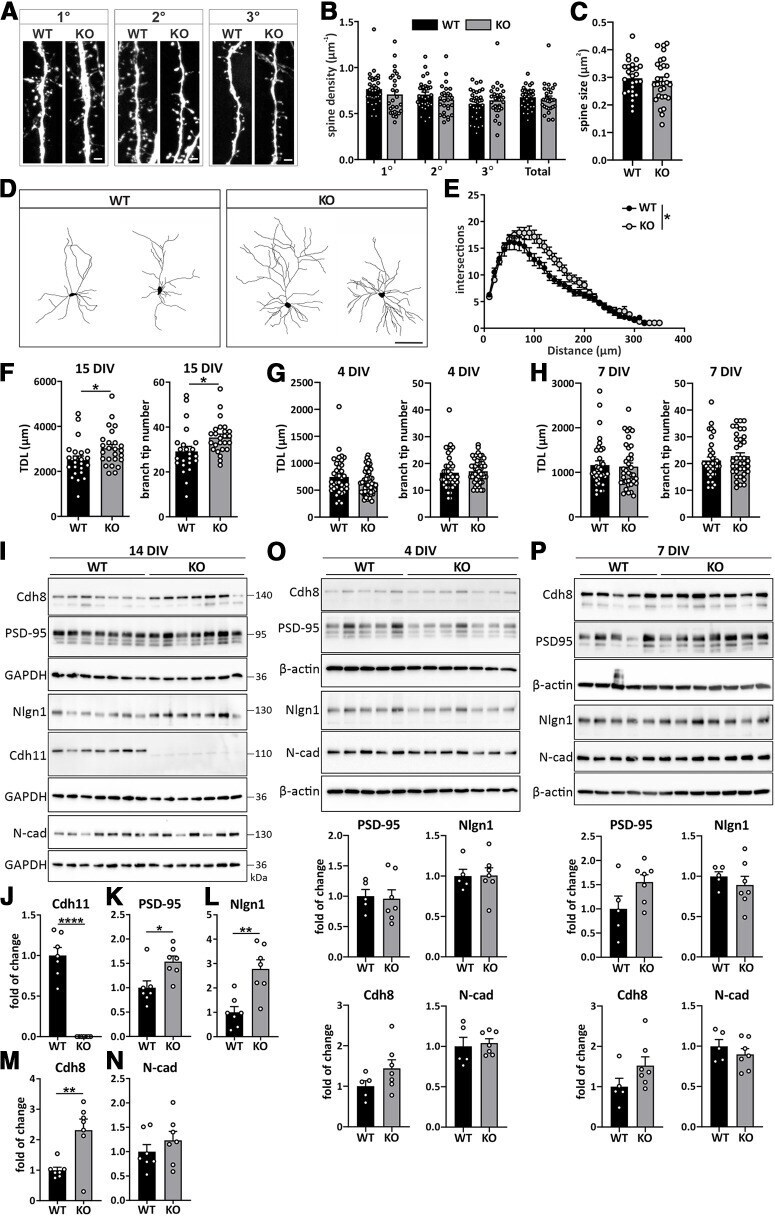
- Figure 6. Increased dendrite complexity in Cdh11 -/- neurons is accompanied by elevated expression levels of excitatory synaptic markers. A , Confocal fluorochrome images of dendritic spines from primary, secondary and tertiary dendrites from 15 DIV Cdh11 WT and KO hippocampal neurons transfected with pLL3.7-GFP. Scale bar: 2 mum. B , Quantification of the mean spine density ( N = 33 WT and 28 KO neurons from 8 animals per genotype) and ( C ) mean spine size (26 WT neurons/7 animals and 30 KO neurons/8 animals) of 15 DIV Cdh11 WT and KO hippocampal neurons. D , Representative images of reconstructed dendritic trees from 15 DIV Cdh11 WT and KO hippocampal neurons. Scale bar: 100 mum. E , Sholl analysis of reconstructed neurons. Significant difference was determined by quantifying the area under the Sholl curve (AUC) between WT and KO neurons; * p < 0.05, unpaired two-tailed t test. N = 23 WT and 25 KO neurons from 8 animals per genotype. Quantification of TDL and branch tip number of Cdh11 WT and KO neurons at ( F ) 15 DIV, ( G ) 4 DIV, and ( H ) 7 DIV; * p < 0.05, unpaired two-tailed t test. 15 DIV: N = 23 WT and 25 KO neurons from 8 animals per genotype; 4 DIV: N = 38 WT neurons/4 animals and 52 KO neurons/3 animals; 7 DIV: N = 33 WT and 37 KO neurons from 4 animals per genotype. I , Western blot analysis of the expression levels of cadherin-11, PSD-95, neuroligin-1, cadherin-8, and N-cadherin in 14 DIV Cdh11 WT and KO hippocampal cultures. Cadherin-11 is not detectable in C
- Submitted by
- Invitrogen Antibodies (provider)
- Main image

- Experimental details
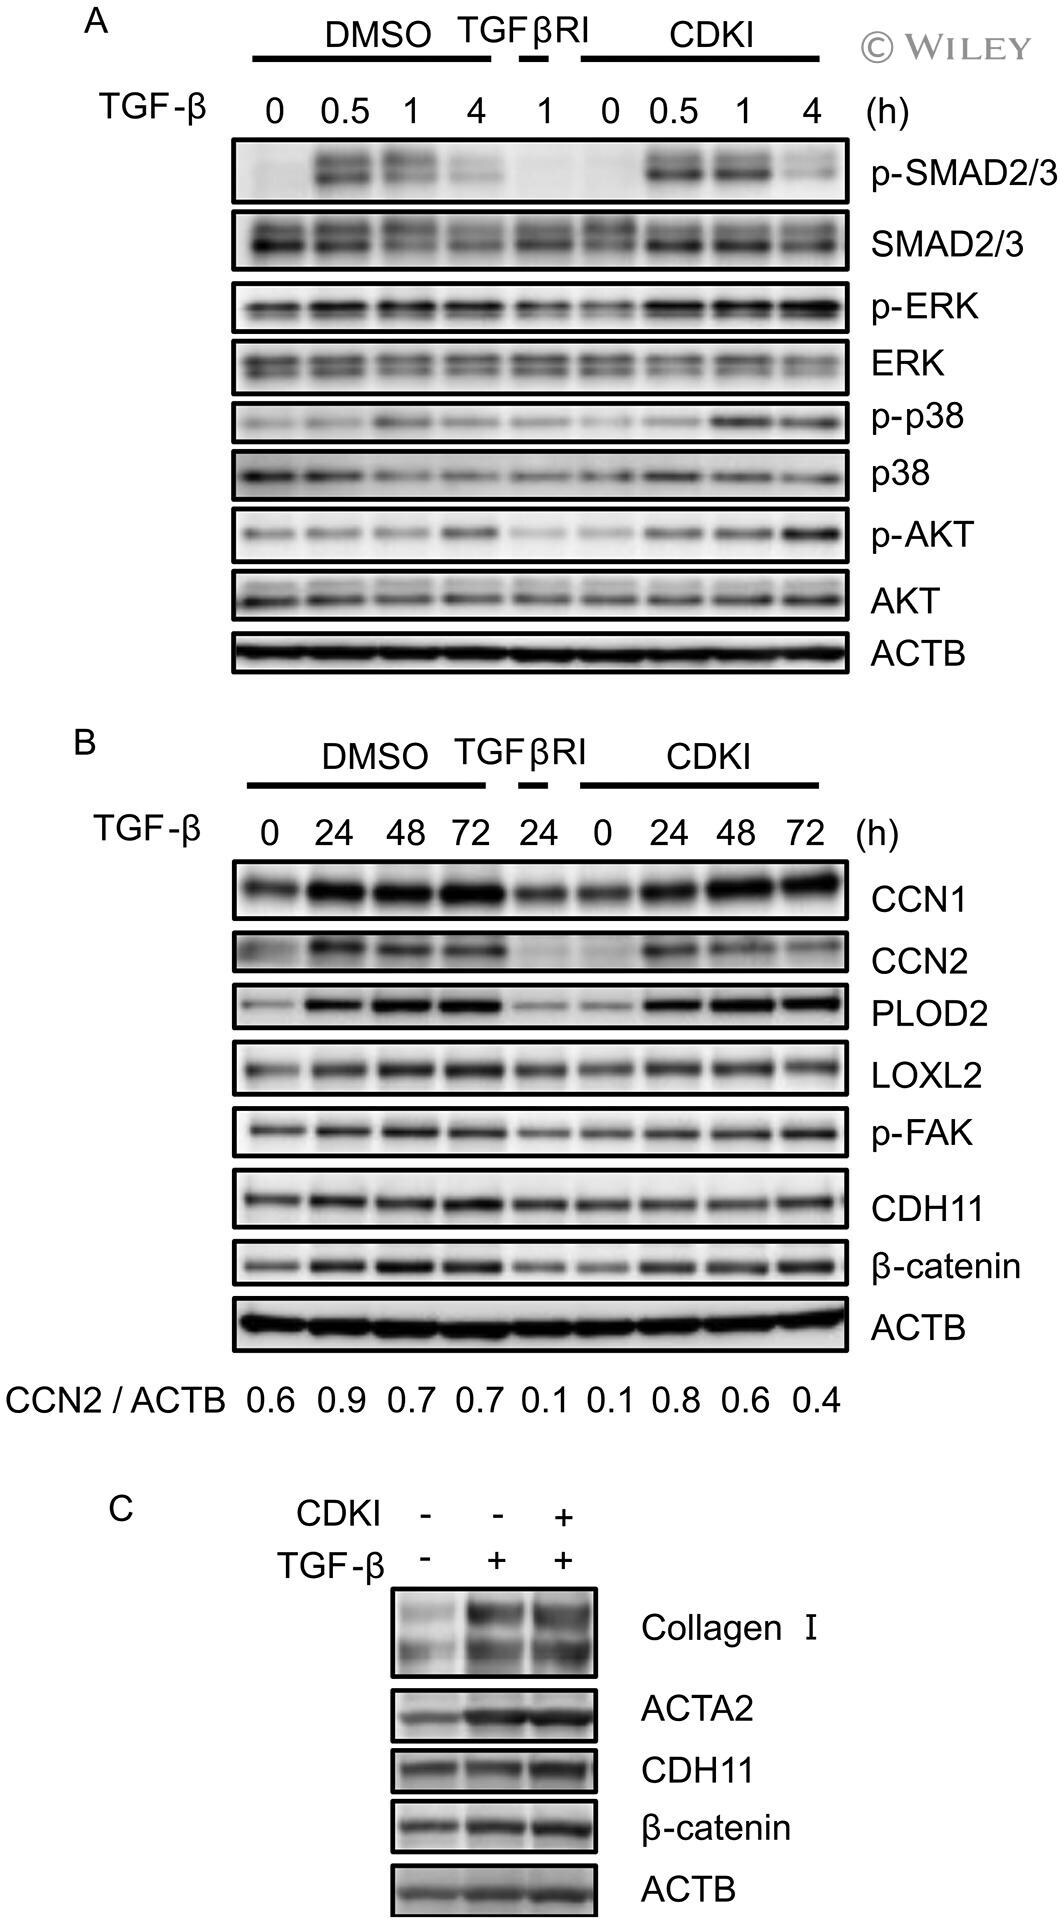
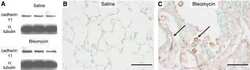
- 5 Figure Effect of CDK4/6 inhibitor treatment on TGFbeta canonical and noncanonical signals, and on molecules important for myofibroblast differentiation. A , Western blots were analyzed for TGFbeta canonical and noncanonical signals in TGFbeta-treated human SSc dermal fibroblasts in the presence of 2 mu M CDK4/6 inhibitor or 10 mu M TGFbetaR inhibitor for the indicated amounts of time. B , Western blots were analyzed for expression of molecules important for myofibroblast differentiation in TGFbeta-treated SSc fibroblasts in the presence of 2 mu M CDK4/6 inhibitor or 10 mu M TGFbetaR inhibitor for the indicated amounts of time. C , Western blots were analyzed for expression of type I collagen, alpha-smooth muscle actin gene ACTA2, cadherin-11 gene CDH11, and beta-catenin in TGFbeta-treated SSc fibroblasts, with the cells plated at confluence density and cultured in the presence of 2 mu M CDK4/6 inhibitor for 96 hours. In all blots, beta-actin (ACTB) was used as a loading control. Results are representative of >2 independent experiments. See Figure 1 for other definitions.