Explore
 Validate
 Learn
Learn32-4500
antibody from Invitrogen Antibodies
Targeting: SRSF1
ASF, MGC5228, SF2, SF2p33, SFRS1, SRp30a
 Western blot
 Immunoprecipitation
 Flow cytometry
Antibody data
- Antibody Data
- Antigen structure
- References [54]
- Comments [0]
- Validations
- Flow cytometry [1]
- Other assay [53]
Submit
Validation data
Reference
Comment
Report error
- Product number
- 32-4500 - Provider product page

- Provider
- Invitrogen Antibodies
- Product name
- SRSF1 Monoclonal Antibody (96)
- Antibody type
- Monoclonal
- Antigen
- Recombinant full-length protein
- Reactivity
- Human, Mouse, Rat
- Host
- Mouse
- Isotype
- IgG
- Antibody clone number
- 96
- Vial size
- 100 μg
- Concentration
- 0.5 mg/mL
- Storage
- -20°C
Submitted references Tissue-specific alternative splicing separates the catalytic and cell signaling functions of human leucyl-tRNA synthetase.
Overexpression of hsa_circ_0001445 reverses oxLDL‑induced inhibition of HUVEC proliferation via SRSF1.
Splicing factor SRSF1 limits IFN-γ production via RhoH and ameliorates experimental nephritis.
The Thiazole-5-Carboxamide GPS491 Inhibits HIV-1, Adenovirus, and Coronavirus Replication by Altering RNA Processing/Accumulation.
The effect of splicing MST1R in gastric cancer was enhanced by lncRNA FENDRR.
FGF-2 promotes angiogenesis through a SRSF1/SRSF3/SRPK1-dependent axis that controls VEGFR1 splicing in endothelial cells.
RBFOX2 alters splicing outcome in distinct binding modes with multiple protein partners.
Disruption of exon-bridging interactions between the minor and major spliceosomes results in alternative splicing around minor introns.
First Identification of RNA-Binding Proteins That Regulate Alternative Exons in the Dystrophin Gene.
Hallmarks and Determinants of Oncogenic Translation Revealed by Ribosome Profiling in Models of Breast Cancer.
hnRNPK promotes gastric tumorigenesis through regulating CD44E alternative splicing.
Biological and RNA regulatory function of MOV10 in mammalian germ cells.
Loss of 5-methylcytosine alters the biogenesis of vault-derived small RNAs to coordinate epidermal differentiation.
DAZL Regulates Germ Cell Survival through a Network of PolyA-Proximal mRNA Interactions.
Intronic PAH gene mutations cause a splicing defect by a novel mechanism involving U1snRNP binding downstream of the 5' splice site.
SRSF1 suppresses selection of intron-distal 5' splice site of DOK7 intron 4 to generate functional full-length Dok-7 protein.
Integrated Molecular Characterization of Uterine Carcinosarcoma.
SRSF1 promotes vascular smooth muscle cell proliferation through a Δ133p53/EGR1/KLF5 pathway.
Succession of splicing regulatory elements determines cryptic 5΄ss functionality.
Rescue of Isolated GH Deficiency Type II (IGHD II) via Pharmacologic Modulation of GH-1 Splicing.
Serine/Arginine-Rich Splicing Factor 3 and Heterogeneous Nuclear Ribonucleoprotein A1 Regulate Alternative RNA Splicing and Gene Expression of Human Papillomavirus 18 through Two Functionally Distinguishable cis Elements.
The alternative splicing program of differentiated smooth muscle cells involves concerted non-productive splicing of post-transcriptional regulators.
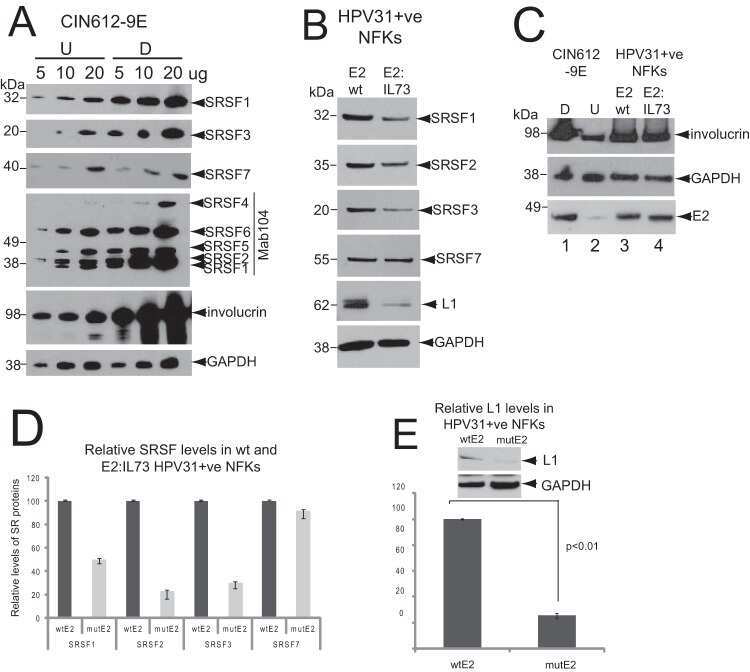
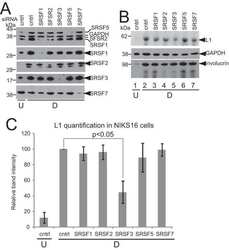
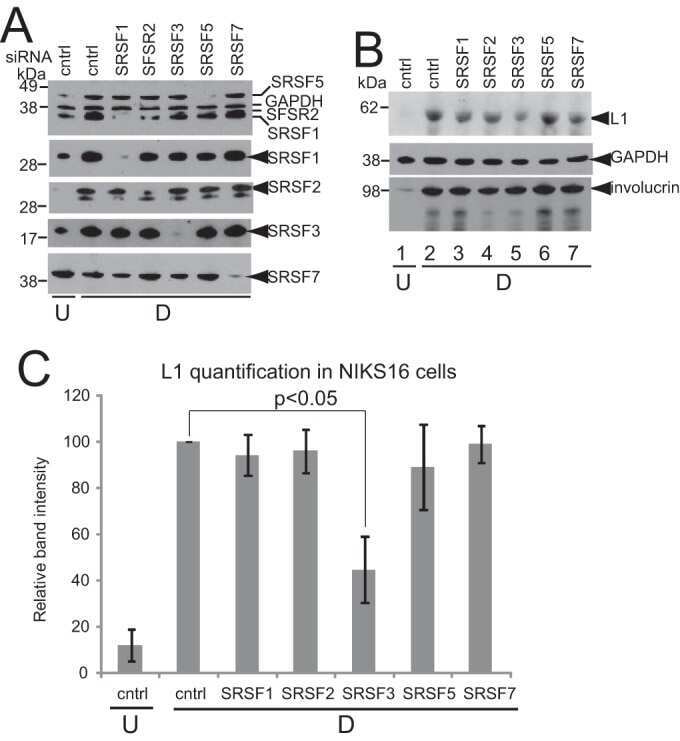
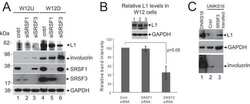
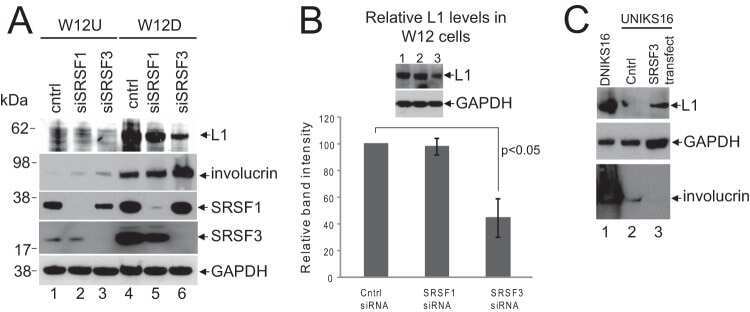
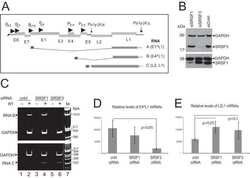
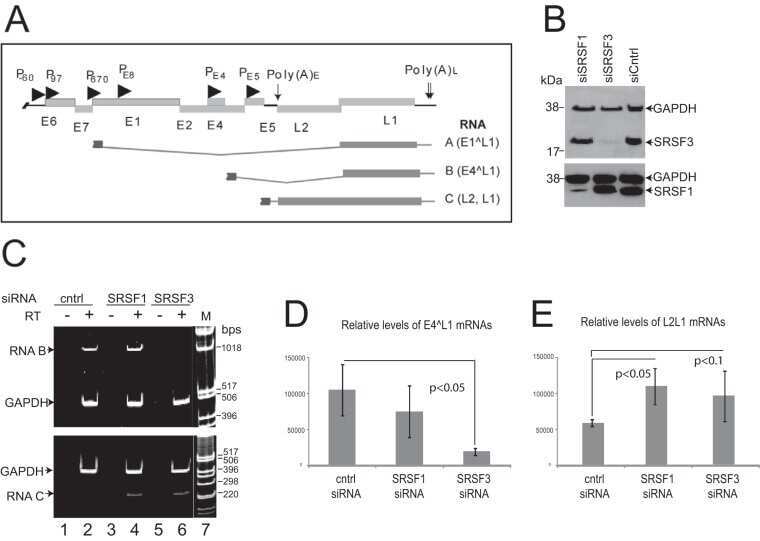
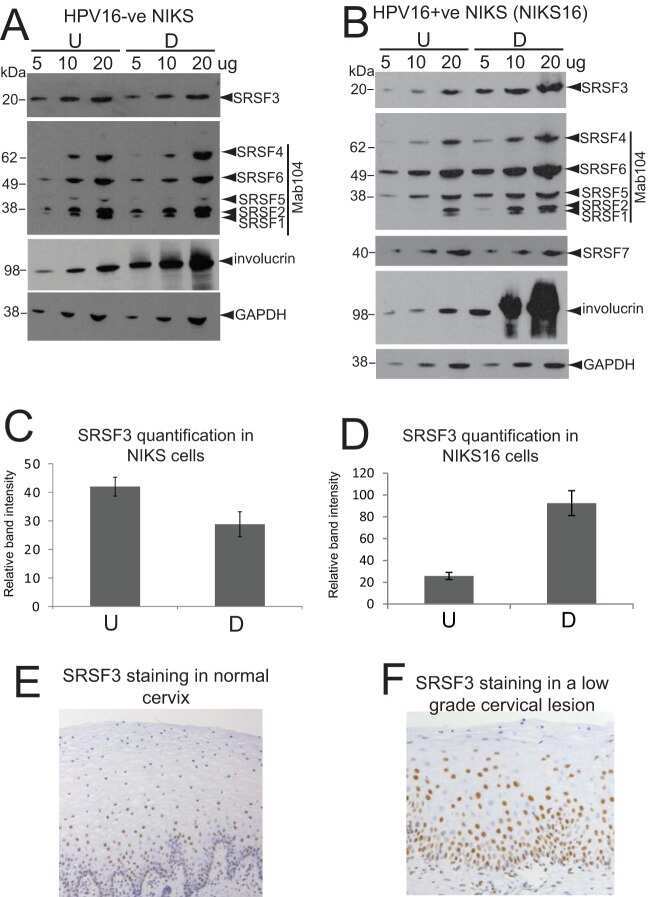
Human Papillomavirus E2 Regulates SRSF3 (SRp20) To Promote Capsid Protein Expression in Infected Differentiated Keratinocytes.
A genome landscape of SRSF3-regulated splicing events and gene expression in human osteosarcoma U2OS cells.
Human Papillomavirus 16 Oncoprotein Expression Is Controlled by the Cellular Splicing Factor SRSF2 (SC35).
Splice-shifting oligonucleotide (SSO) mediated blocking of an exonic splicing enhancer (ESE) created by the prevalent c.903+469T>C MTRR mutation corrects splicing and restores enzyme activity in patient cells.
SRSF1 and hnRNP H antagonistically regulate splicing of COLQ exon 16 in a congenital myasthenic syndrome.
Absence of an intron splicing silencer in porcine Smn1 intron 7 confers immunity to the exon skipping mutation in human SMN2.
Attenuation of the suppressive activity of cellular splicing factor SRSF3 by Kaposi sarcoma-associated herpesvirus ORF57 protein is required for RNA splicing.
Alanine repeats influence protein localization in splicing speckles and paraspeckles.
Identification by high-throughput imaging of the histone methyltransferase EHMT2 as an epigenetic regulator of VEGFA alternative splicing.
Identification of the adenovirus E4orf4 protein binding site on the B55α and Cdc55 regulatory subunits of PP2A: Implications for PP2A function, tumor cell killing and viral replication.
Eight nucleotide substitutions inhibit splicing to HPV-16 3'-splice site SA3358 and reduce the efficiency by which HPV-16 increases the life span of primary human keratinocytes.
Paraquat modulates alternative pre-mRNA splicing by modifying the intracellular distribution of SRPK2.
A synonymous polymorphic variation in ACADM exon 11 affects splicing efficiency and may affect fatty acid oxidation.
HnRNP A1 controls a splicing regulatory circuit promoting mesenchymal-to-epithelial transition.
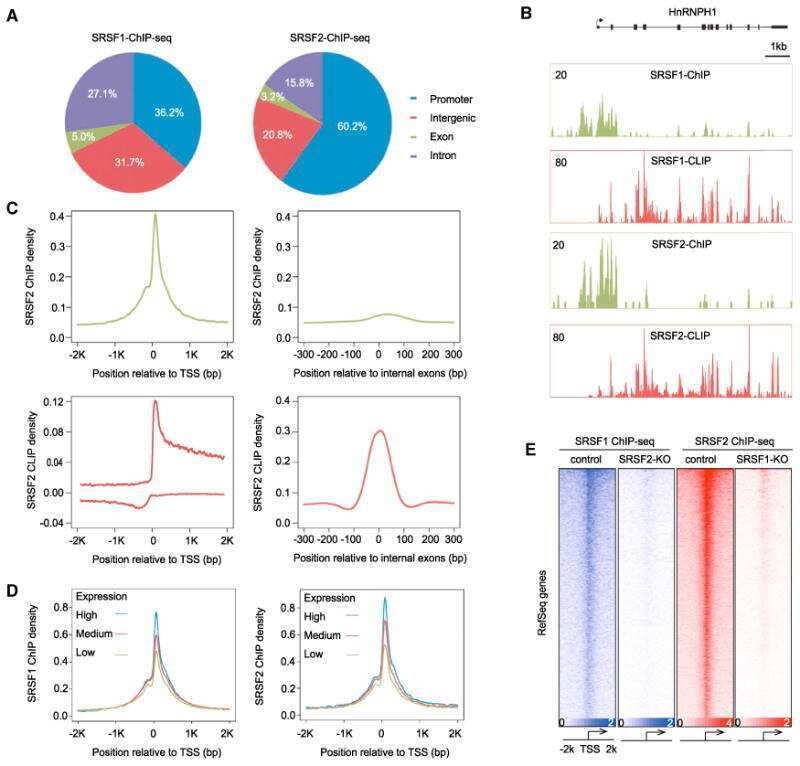
SR proteins collaborate with 7SK and promoter-associated nascent RNA to release paused polymerase.
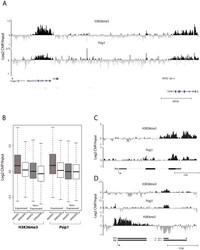
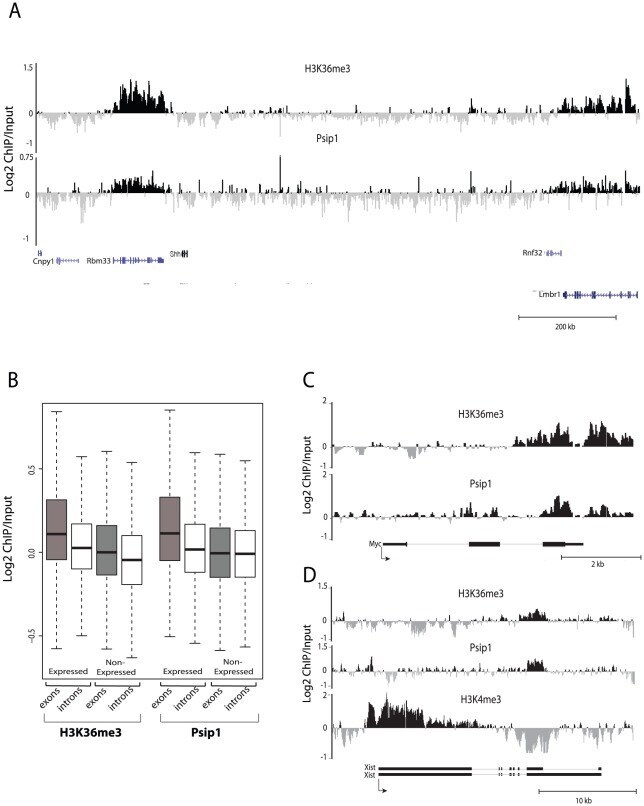
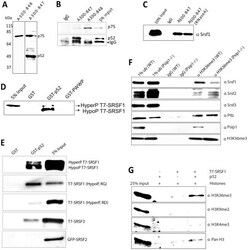
Psip1/Ledgf p52 binds methylated histone H3K36 and splicing factors and contributes to the regulation of alternative splicing.
Abnormal expression of the pre-mRNA splicing regulators SRSF1, SRSF2, SRPK1 and SRPK2 in non small cell lung carcinoma.
A retroelement modifies pre-mRNA splicing: the murine Glrb(spa) allele is a splicing signal polymorphism amplified by long interspersed nuclear element insertion.
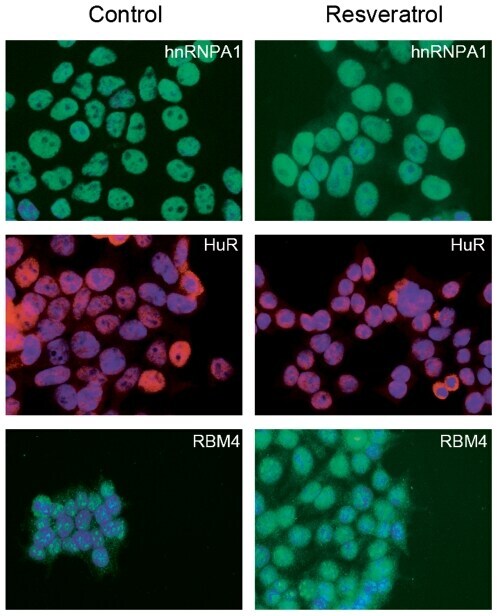
Resveratrol, by modulating RNA processing factor levels, can influence the alternative splicing of pre-mRNAs.
Nucleocytoplasmic localization of p70 S6K1, but not of its isoforms p85 and p31, is regulated by TSC2/mTOR.
A conserved splicing mechanism of the LMNA gene controls premature aging.
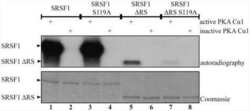
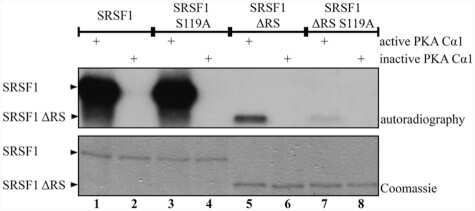
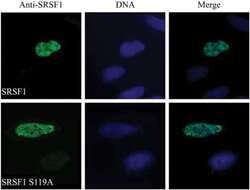
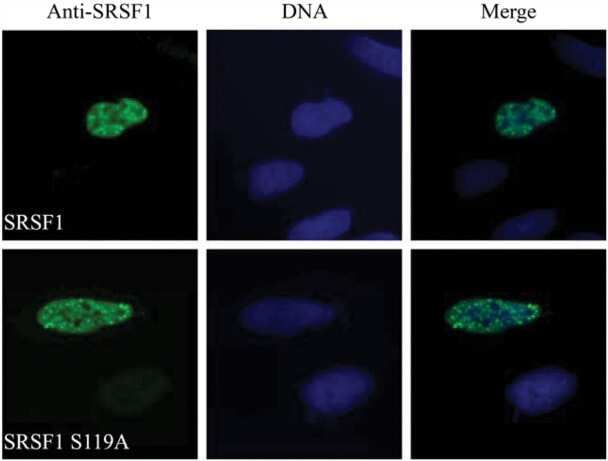
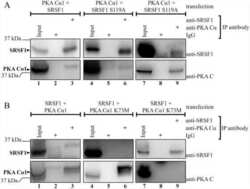
Protein kinase a-dependent phosphorylation of serine 119 in the proto-oncogenic serine/arginine-rich splicing factor 1 modulates its activity as a splicing enhancer protein.
Disturbed expression of splicing factors in renal cancer affects alternative splicing of apoptosis regulators, oncogenes, and tumor suppressors.
Coupled transcription-splicing regulation of mutually exclusive splicing events at the 5' exons of protein 4.1R gene.
The splicing factor SF2/ASF binds to ARS homologs in a human rDNA replication origin.
A novel role for PA28gamma-proteasome in nuclear speckle organization and SR protein trafficking.
RNA splicing capability of live neuronal dendrites.
RNA folding affects the recruitment of SR proteins by mouse and human polypurinic enhancer elements in the fibronectin EDA exon.
RNA folding affects the recruitment of SR proteins by mouse and human polypurinic enhancer elements in the fibronectin EDA exon.
Alteration of cellular RNA splicing and polyadenylation machineries during productive human cytomegalovirus infection.
Roles for SR proteins and hnRNP A1 in the regulation of c-src exon N1.
Roles for SR proteins and hnRNP A1 in the regulation of c-src exon N1.
Baymiller M, Nordick B, Forsyth CM, Martinis SA
The Journal of biological chemistry 2022 Apr;298(4):101757
The Journal of biological chemistry 2022 Apr;298(4):101757
Overexpression of hsa_circ_0001445 reverses oxLDL‑induced inhibition of HUVEC proliferation via SRSF1.
Liang G, Chen S, Xin S, Dong L
Molecular medicine reports 2021 Jul;24(1)
Molecular medicine reports 2021 Jul;24(1)
Splicing factor SRSF1 limits IFN-γ production via RhoH and ameliorates experimental nephritis.
Katsuyama T, Li H, Krishfield SM, Kyttaris VC, Moulton VR
Rheumatology (Oxford, England) 2021 Jan 5;60(1):420-429
Rheumatology (Oxford, England) 2021 Jan 5;60(1):420-429
The Thiazole-5-Carboxamide GPS491 Inhibits HIV-1, Adenovirus, and Coronavirus Replication by Altering RNA Processing/Accumulation.
Dahal S, Cheng R, Cheung PK, Been T, Malty R, Geng M, Manianis S, Shkreta L, Jahanshahi S, Toutant J, Chan R, Park S, Brockman MA, Babu M, Mubareka S, Mossman K, Banerjee A, Gray-Owen S, Brown M, Houry WA, Chabot B, Grierson D, Cochrane A
Viruses 2021 Dec 30;14(1)
Viruses 2021 Dec 30;14(1)
The effect of splicing MST1R in gastric cancer was enhanced by lncRNA FENDRR.
Zhou D, Zhu X, Wu X, Zheng J, Tou L, Zhou Y
Experimental and therapeutic medicine 2021 Aug;22(2):798
Experimental and therapeutic medicine 2021 Aug;22(2):798
FGF-2 promotes angiogenesis through a SRSF1/SRSF3/SRPK1-dependent axis that controls VEGFR1 splicing in endothelial cells.
Jia T, Jacquet T, Dalonneau F, Coudert P, Vaganay E, Exbrayat-Héritier C, Vollaire J, Josserand V, Ruggiero F, Coll JL, Eymin B
BMC biology 2021 Aug 25;19(1):173
BMC biology 2021 Aug 25;19(1):173
RBFOX2 alters splicing outcome in distinct binding modes with multiple protein partners.
Zhou D, Couture S, Scott MS, Abou Elela S
Nucleic acids research 2021 Aug 20;49(14):8370-8383
Nucleic acids research 2021 Aug 20;49(14):8370-8383
Disruption of exon-bridging interactions between the minor and major spliceosomes results in alternative splicing around minor introns.
Olthof AM, White AK, Mieruszynski S, Doggett K, Lee MF, Chakroun A, Abdel Aleem AK, Rousseau J, Magnani C, Roifman CM, Campeau PM, Heath JK, Kanadia RN
Nucleic acids research 2021 Apr 6;49(6):3524-3545
Nucleic acids research 2021 Apr 6;49(6):3524-3545
First Identification of RNA-Binding Proteins That Regulate Alternative Exons in the Dystrophin Gene.
Miro J, Bougé AL, Murauer E, Beyne E, Da Cunha D, Claustres M, Koenig M, Tuffery-Giraud S
International journal of molecular sciences 2020 Oct 21;21(20)
International journal of molecular sciences 2020 Oct 21;21(20)
Hallmarks and Determinants of Oncogenic Translation Revealed by Ribosome Profiling in Models of Breast Cancer.
Vaklavas C, Blume SW, Grizzle WE
Translational oncology 2020 Feb;13(2):452-470
Translational oncology 2020 Feb;13(2):452-470
hnRNPK promotes gastric tumorigenesis through regulating CD44E alternative splicing.
Peng WZ, Liu JX, Li CF, Ma R, Jie JZ
Cancer cell international 2019;19:335
Cancer cell international 2019;19:335
Biological and RNA regulatory function of MOV10 in mammalian germ cells.
Fu K, Tian S, Tan H, Wang C, Wang H, Wang M, Wang Y, Chen Z, Wang Y, Yue Q, Xu Q, Zhang S, Li H, Xie J, Lin M, Luo M, Chen F, Ye L, Zheng K
BMC biology 2019 May 14;17(1):39
BMC biology 2019 May 14;17(1):39
Loss of 5-methylcytosine alters the biogenesis of vault-derived small RNAs to coordinate epidermal differentiation.
Sajini AA, Choudhury NR, Wagner RE, Bornelöv S, Selmi T, Spanos C, Dietmann S, Rappsilber J, Michlewski G, Frye M
Nature communications 2019 Jun 11;10(1):2550
Nature communications 2019 Jun 11;10(1):2550
DAZL Regulates Germ Cell Survival through a Network of PolyA-Proximal mRNA Interactions.
Zagore LL, Sweet TJ, Hannigan MM, Weyn-Vanhentenryck SM, Jobava R, Hatzoglou M, Zhang C, Licatalosi DD
Cell reports 2018 Oct 30;25(5):1225-1240.e6
Cell reports 2018 Oct 30;25(5):1225-1240.e6
Intronic PAH gene mutations cause a splicing defect by a novel mechanism involving U1snRNP binding downstream of the 5' splice site.
Martínez-Pizarro A, Dembic M, Pérez B, Andresen BS, Desviat LR
PLoS genetics 2018 Apr;14(4):e1007360
PLoS genetics 2018 Apr;14(4):e1007360
SRSF1 suppresses selection of intron-distal 5' splice site of DOK7 intron 4 to generate functional full-length Dok-7 protein.
Ahsan KB, Masuda A, Rahman MA, Takeda JI, Nazim M, Ohkawara B, Ito M, Ohno K
Scientific reports 2017 Sep 5;7(1):10446
Scientific reports 2017 Sep 5;7(1):10446
Integrated Molecular Characterization of Uterine Carcinosarcoma.
Cherniack AD, Shen H, Walter V, Stewart C, Murray BA, Bowlby R, Hu X, Ling S, Soslow RA, Broaddus RR, Zuna RE, Robertson G, Laird PW, Kucherlapati R, Mills GB, Cancer Genome Atlas Research Network, Weinstein JN, Zhang J, Akbani R, Levine DA
Cancer cell 2017 Mar 13;31(3):411-423
Cancer cell 2017 Mar 13;31(3):411-423
SRSF1 promotes vascular smooth muscle cell proliferation through a Δ133p53/EGR1/KLF5 pathway.
Xie N, Chen M, Dai R, Zhang Y, Zhao H, Song Z, Zhang L, Li Z, Feng Y, Gao H, Wang L, Zhang T, Xiao RP, Wu J, Cao CM
Nature communications 2017 Aug 11;8:16016
Nature communications 2017 Aug 11;8:16016
Succession of splicing regulatory elements determines cryptic 5΄ss functionality.
Brillen AL, Schöneweis K, Walotka L, Hartmann L, Müller L, Ptok J, Kaisers W, Poschmann G, Stühler K, Buratti E, Theiss S, Schaal H
Nucleic acids research 2017 Apr 20;45(7):4202-4216
Nucleic acids research 2017 Apr 20;45(7):4202-4216
Rescue of Isolated GH Deficiency Type II (IGHD II) via Pharmacologic Modulation of GH-1 Splicing.
Miletta MC, Petkovic V, Eblé A, Flück CE, Mullis PE
Endocrinology 2016 Oct;157(10):3972-3982
Endocrinology 2016 Oct;157(10):3972-3982
Serine/Arginine-Rich Splicing Factor 3 and Heterogeneous Nuclear Ribonucleoprotein A1 Regulate Alternative RNA Splicing and Gene Expression of Human Papillomavirus 18 through Two Functionally Distinguishable cis Elements.
Ajiro M, Tang S, Doorbar J, Zheng ZM
Journal of virology 2016 Oct 15;90(20):9138-52
Journal of virology 2016 Oct 15;90(20):9138-52
The alternative splicing program of differentiated smooth muscle cells involves concerted non-productive splicing of post-transcriptional regulators.
Llorian M, Gooding C, Bellora N, Hallegger M, Buckroyd A, Wang X, Rajgor D, Kayikci M, Feltham J, Ule J, Eyras E, Smith CW
Nucleic acids research 2016 Oct 14;44(18):8933-8950
Nucleic acids research 2016 Oct 14;44(18):8933-8950
Human Papillomavirus E2 Regulates SRSF3 (SRp20) To Promote Capsid Protein Expression in Infected Differentiated Keratinocytes.
Klymenko T, Hernandez-Lopez H, MacDonald AI, Bodily JM, Graham SV
Journal of virology 2016 May 15;90(10):5047-58
Journal of virology 2016 May 15;90(10):5047-58
A genome landscape of SRSF3-regulated splicing events and gene expression in human osteosarcoma U2OS cells.
Ajiro M, Jia R, Yang Y, Zhu J, Zheng ZM
Nucleic acids research 2016 Feb 29;44(4):1854-70
Nucleic acids research 2016 Feb 29;44(4):1854-70
Human Papillomavirus 16 Oncoprotein Expression Is Controlled by the Cellular Splicing Factor SRSF2 (SC35).
McFarlane M, MacDonald AI, Stevenson A, Graham SV
Journal of virology 2015 May;89(10):5276-87
Journal of virology 2015 May;89(10):5276-87
Splice-shifting oligonucleotide (SSO) mediated blocking of an exonic splicing enhancer (ESE) created by the prevalent c.903+469T>C MTRR mutation corrects splicing and restores enzyme activity in patient cells.
Palhais B, Præstegaard VS, Sabaratnam R, Doktor TK, Lutz S, Burda P, Suormala T, Baumgartner M, Fowler B, Bruun GH, Andersen HS, Kožich V, Andresen BS
Nucleic acids research 2015 May 19;43(9):4627-39
Nucleic acids research 2015 May 19;43(9):4627-39
SRSF1 and hnRNP H antagonistically regulate splicing of COLQ exon 16 in a congenital myasthenic syndrome.
Rahman MA, Azuma Y, Nasrin F, Takeda J, Nazim M, Bin Ahsan K, Masuda A, Engel AG, Ohno K
Scientific reports 2015 Aug 18;5:13208
Scientific reports 2015 Aug 18;5:13208
Absence of an intron splicing silencer in porcine Smn1 intron 7 confers immunity to the exon skipping mutation in human SMN2.
Doktor TK, Schrøder LD, Andersen HS, Brøner S, Kitewska A, Sørensen CB, Andresen BS
PloS one 2014;9(6):e98841
PloS one 2014;9(6):e98841
Attenuation of the suppressive activity of cellular splicing factor SRSF3 by Kaposi sarcoma-associated herpesvirus ORF57 protein is required for RNA splicing.
Majerciak V, Lu M, Li X, Zheng ZM
RNA (New York, N.Y.) 2014 Nov;20(11):1747-58
RNA (New York, N.Y.) 2014 Nov;20(11):1747-58
Alanine repeats influence protein localization in splicing speckles and paraspeckles.
Chang SH, Chang WL, Lu CC, Tarn WY
Nucleic acids research 2014 Dec 16;42(22):13788-98
Nucleic acids research 2014 Dec 16;42(22):13788-98
Identification by high-throughput imaging of the histone methyltransferase EHMT2 as an epigenetic regulator of VEGFA alternative splicing.
Salton M, Voss TC, Misteli T
Nucleic acids research 2014 Dec 16;42(22):13662-73
Nucleic acids research 2014 Dec 16;42(22):13662-73
Identification of the adenovirus E4orf4 protein binding site on the B55α and Cdc55 regulatory subunits of PP2A: Implications for PP2A function, tumor cell killing and viral replication.
Mui MZ, Kucharski M, Miron MJ, Hur WS, Berghuis AM, Blanchette P, Branton PE
PLoS pathogens 2013;9(11):e1003742
PLoS pathogens 2013;9(11):e1003742
Eight nucleotide substitutions inhibit splicing to HPV-16 3'-splice site SA3358 and reduce the efficiency by which HPV-16 increases the life span of primary human keratinocytes.
Li X, Johansson C, Cardoso Palacios C, Mossberg A, Dhanjal S, Bergvall M, Schwartz S
PloS one 2013;8(9):e72776
PloS one 2013;8(9):e72776
Paraquat modulates alternative pre-mRNA splicing by modifying the intracellular distribution of SRPK2.
Vivarelli S, Lenzken SC, Ruepp MD, Ranzini F, Maffioletti A, Alvarez R, Mühlemann O, Barabino SM
PloS one 2013;8(4):e61980
PloS one 2013;8(4):e61980
A synonymous polymorphic variation in ACADM exon 11 affects splicing efficiency and may affect fatty acid oxidation.
Bruun GH, Doktor TK, Andresen BS
Molecular genetics and metabolism 2013 Sep-Oct;110(1-2):122-8
Molecular genetics and metabolism 2013 Sep-Oct;110(1-2):122-8
HnRNP A1 controls a splicing regulatory circuit promoting mesenchymal-to-epithelial transition.
Bonomi S, di Matteo A, Buratti E, Cabianca DS, Baralle FE, Ghigna C, Biamonti G
Nucleic acids research 2013 Oct;41(18):8665-79
Nucleic acids research 2013 Oct;41(18):8665-79
SR proteins collaborate with 7SK and promoter-associated nascent RNA to release paused polymerase.
Ji X, Zhou Y, Pandit S, Huang J, Li H, Lin CY, Xiao R, Burge CB, Fu XD
Cell 2013 May 9;153(4):855-68
Cell 2013 May 9;153(4):855-68
Psip1/Ledgf p52 binds methylated histone H3K36 and splicing factors and contributes to the regulation of alternative splicing.
Pradeepa MM, Sutherland HG, Ule J, Grimes GR, Bickmore WA
PLoS genetics 2012;8(5):e1002717
PLoS genetics 2012;8(5):e1002717
Abnormal expression of the pre-mRNA splicing regulators SRSF1, SRSF2, SRPK1 and SRPK2 in non small cell lung carcinoma.
Gout S, Brambilla E, Boudria A, Drissi R, Lantuejoul S, Gazzeri S, Eymin B
PloS one 2012;7(10):e46539
PloS one 2012;7(10):e46539
A retroelement modifies pre-mRNA splicing: the murine Glrb(spa) allele is a splicing signal polymorphism amplified by long interspersed nuclear element insertion.
Becker K, Braune M, Benderska N, Buratti E, Baralle F, Villmann C, Stamm S, Eulenburg V, Becker CM
The Journal of biological chemistry 2012 Sep 7;287(37):31185-94
The Journal of biological chemistry 2012 Sep 7;287(37):31185-94
Resveratrol, by modulating RNA processing factor levels, can influence the alternative splicing of pre-mRNAs.
Markus MA, Marques FZ, Morris BJ
PloS one 2011;6(12):e28926
PloS one 2011;6(12):e28926
Nucleocytoplasmic localization of p70 S6K1, but not of its isoforms p85 and p31, is regulated by TSC2/mTOR.
Rosner M, Hengstschläger M
Oncogene 2011 Nov 3;30(44):4509-22
Oncogene 2011 Nov 3;30(44):4509-22
A conserved splicing mechanism of the LMNA gene controls premature aging.
Lopez-Mejia IC, Vautrot V, De Toledo M, Behm-Ansmant I, Bourgeois CF, Navarro CL, Osorio FG, Freije JM, Stévenin J, De Sandre-Giovannoli A, Lopez-Otin C, Lévy N, Branlant C, Tazi J
Human molecular genetics 2011 Dec 1;20(23):4540-55
Human molecular genetics 2011 Dec 1;20(23):4540-55
Protein kinase a-dependent phosphorylation of serine 119 in the proto-oncogenic serine/arginine-rich splicing factor 1 modulates its activity as a splicing enhancer protein.
Aksaas AK, Eikvar S, Akusjärvi G, Skålhegg BS, Kvissel AK
Genes & cancer 2011 Aug;2(8):841-51
Genes & cancer 2011 Aug;2(8):841-51
Disturbed expression of splicing factors in renal cancer affects alternative splicing of apoptosis regulators, oncogenes, and tumor suppressors.
Piekielko-Witkowska A, Wiszomirska H, Wojcicka A, Poplawski P, Boguslawska J, Tanski Z, Nauman A
PloS one 2010 Oct 27;5(10):e13690
PloS one 2010 Oct 27;5(10):e13690
Coupled transcription-splicing regulation of mutually exclusive splicing events at the 5' exons of protein 4.1R gene.
Huang SC, Cho A, Norton S, Liu ES, Park J, Zhou A, Munagala ID, Ou AC, Yang G, Wickrema A, Tang TK, Benz EJ Jr
Blood 2009 Nov 5;114(19):4233-42
Blood 2009 Nov 5;114(19):4233-42
The splicing factor SF2/ASF binds to ARS homologs in a human rDNA replication origin.
He M, Shah D, Choung HY, Coffman FD
Cell cycle (Georgetown, Tex.) 2009 Aug 15;8(16):2631-42
Cell cycle (Georgetown, Tex.) 2009 Aug 15;8(16):2631-42
A novel role for PA28gamma-proteasome in nuclear speckle organization and SR protein trafficking.
Baldin V, Militello M, Thomas Y, Doucet C, Fic W, Boireau S, Jariel-Encontre I, Piechaczyk M, Bertrand E, Tazi J, Coux O
Molecular biology of the cell 2008 Apr;19(4):1706-16
Molecular biology of the cell 2008 Apr;19(4):1706-16
RNA splicing capability of live neuronal dendrites.
Glanzer J, Miyashiro KY, Sul JY, Barrett L, Belt B, Haydon P, Eberwine J
Proceedings of the National Academy of Sciences of the United States of America 2005 Nov 15;102(46):16859-64
Proceedings of the National Academy of Sciences of the United States of America 2005 Nov 15;102(46):16859-64
RNA folding affects the recruitment of SR proteins by mouse and human polypurinic enhancer elements in the fibronectin EDA exon.
Buratti E, Muro AF, Giombi M, Gherbassi D, Iaconcig A, Baralle FE
Molecular and cellular biology 2004 Feb;24(3):1387-400
Molecular and cellular biology 2004 Feb;24(3):1387-400
Alteration of cellular RNA splicing and polyadenylation machineries during productive human cytomegalovirus infection.
Adair R, Liebisch GW, Su Y, Colberg-Poley AM
The Journal of general virology 2004 Dec;85(Pt 12):3541-3553
The Journal of general virology 2004 Dec;85(Pt 12):3541-3553
Roles for SR proteins and hnRNP A1 in the regulation of c-src exon N1.
Rooke N, Markovtsov V, Cagavi E, Black DL
Molecular and cellular biology 2003 Mar;23(6):1874-84
Molecular and cellular biology 2003 Mar;23(6):1874-84
Roles for SR proteins and hnRNP A1 in the regulation of c-src exon N1.
Rooke N, Markovtsov V, Cagavi E, Black DL
Molecular and cellular biology 2003 Mar;23(6):1874-84
Molecular and cellular biology 2003 Mar;23(6):1874-84
No comments: Submit comment
Supportive validation
- Submitted by
- Invitrogen Antibodies (provider)
- Main image
- Experimental details
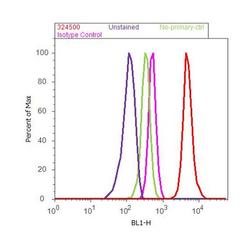
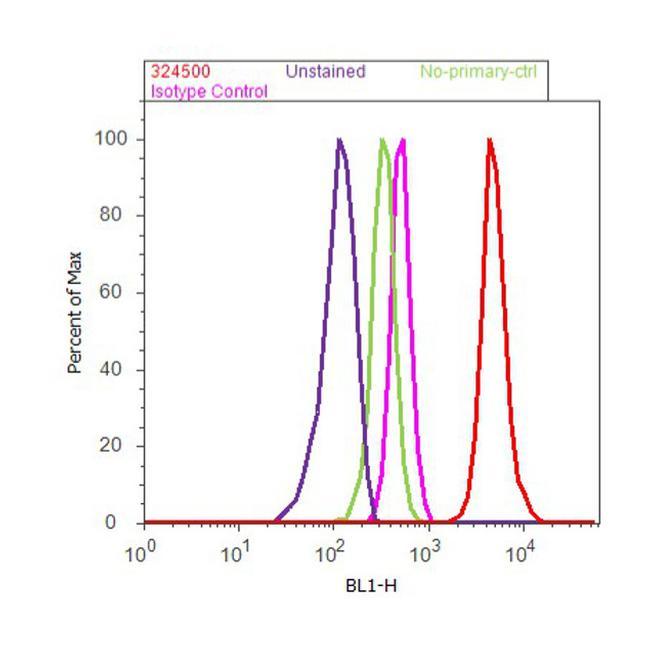
- Flow cytometry analysis of SF2 / ASF was done on MCF7 cells. Cells were fixed with 70% ethanol for 10 minutes, permeabilized with 0.25% Triton™ X-100 for 20 minutes, and blocked with 5% BSA for 30 minutes at room temperature. Cells were labeled with SF2 / ASF Mouse Monoclonal Antibody (Product # 32-4500, red histogram) or with mouse isotype control (pink histogram) at 3-5 µg/million cells in 2.5% BSA. After incubation at room temperature for 2 hours, the cells were labeled with Alexa Fluor® 488 Rabbit Anti-Mouse Secondary Antibody (Product # A11059) at a dilution of 1:400 for 30 minutes at room temperature. The representative 10,000 cells were acquired and analyzed for each sample using an Attune® Acoustic Focusing Cytometer. The purple histogram represents unstained control cells and the green histogram represents no-primary-antibody control..
Supportive validation
- Submitted by
- Invitrogen Antibodies (provider)
- Main image
- Experimental details
- NULL
- Submitted by
- Invitrogen Antibodies (provider)
- Main image
- Experimental details
- NULL
- Submitted by
- Invitrogen Antibodies (provider)
- Main image
- Experimental details
- NULL

- Submitted by
- Invitrogen Antibodies (provider)
- Main image
- Experimental details
- NULL
- Submitted by
- Invitrogen Antibodies (provider)
- Main image
- Experimental details
- NULL

- Submitted by
- Invitrogen Antibodies (provider)
- Main image

- Experimental details
- NULL
- Submitted by
- Invitrogen Antibodies (provider)
- Main image
- Experimental details
- NULL

- Submitted by
- Invitrogen Antibodies (provider)
- Main image
- Experimental details
- NULL
- Submitted by
- Invitrogen Antibodies (provider)
- Main image
- Experimental details
- NULL
- Submitted by
- Invitrogen Antibodies (provider)
- Main image
- Experimental details
- NULL
- Submitted by
- Invitrogen Antibodies (provider)
- Main image
- Experimental details
- NULL
- Submitted by
- Invitrogen Antibodies (provider)
- Main image
- Experimental details
- NULL
- Submitted by
- Invitrogen Antibodies (provider)
- Main image

- Experimental details
- NULL
- Submitted by
- Invitrogen Antibodies (provider)
- Main image
- Experimental details
- NULL
- Submitted by
- Invitrogen Antibodies (provider)
- Main image

- Experimental details
- NULL
- Submitted by
- Invitrogen Antibodies (provider)
- Main image

- Experimental details
- NULL
- Submitted by
- Invitrogen Antibodies (provider)
- Main image
- Experimental details
- NULL

- Submitted by
- Invitrogen Antibodies (provider)
- Main image
- Experimental details
- NULL
- Submitted by
- Invitrogen Antibodies (provider)
- Main image
- Experimental details
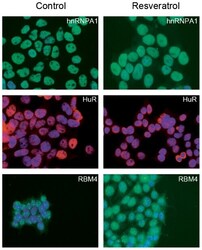
- Figure 4 Resveratrol does not influence the intracellular localization of splicing factors. Immunofluorescence results for HEK293 cells treated with 20 uM resveratrol for 18 h. Shown is immunofluorescent signal obtained for the specific splicing factor antibodies indicated. Left panel: untreated control cells. Right panel: resveratrol-treated cells. The nucleus was stained with DAPI. Shown are merged images of DAPI staining (blue) and splicing factor staining (red or green, depending on the secondary antibody used). Scale bar: 20 um.
- Submitted by
- Invitrogen Antibodies (provider)
- Main image
- Experimental details
- Figure 2 Genomic distribution of Psip1/p52 and H3K36me3. A) Mean log2 ChIP:input for Psip1/p52 and H3K36me3 in MEFs for an approximately 1.2Mb genomic window from mouse chromosome 5. n = 4 (3 biological and 1 technical replicate). B) Box plots showing the distribution of log2 ChIP:input for Psip1/p52 and H3K36me3 across exons and introns of expressed or non-expressed genes. Data are deposited in NCBI GEO (Accession no. GSM697402-GSM697411). C, D) Mean log2 ChIP:input for Psip1/p52 and H3K36me3 in MEFs at (C) c- Myc and (D) Xist loci. H3K4me3 is also shown for XIST. Filled boxes indicate the positions of exons. n = 4 (3 biological and 1 technical replicate) for H3K36me3 and Psip1. NCBI GEO accession number for array platform is GPL13276. n = 2 biological: replicates for H3K4me3.
- Submitted by
- Invitrogen Antibodies (provider)
- Main image
- Experimental details
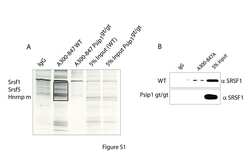
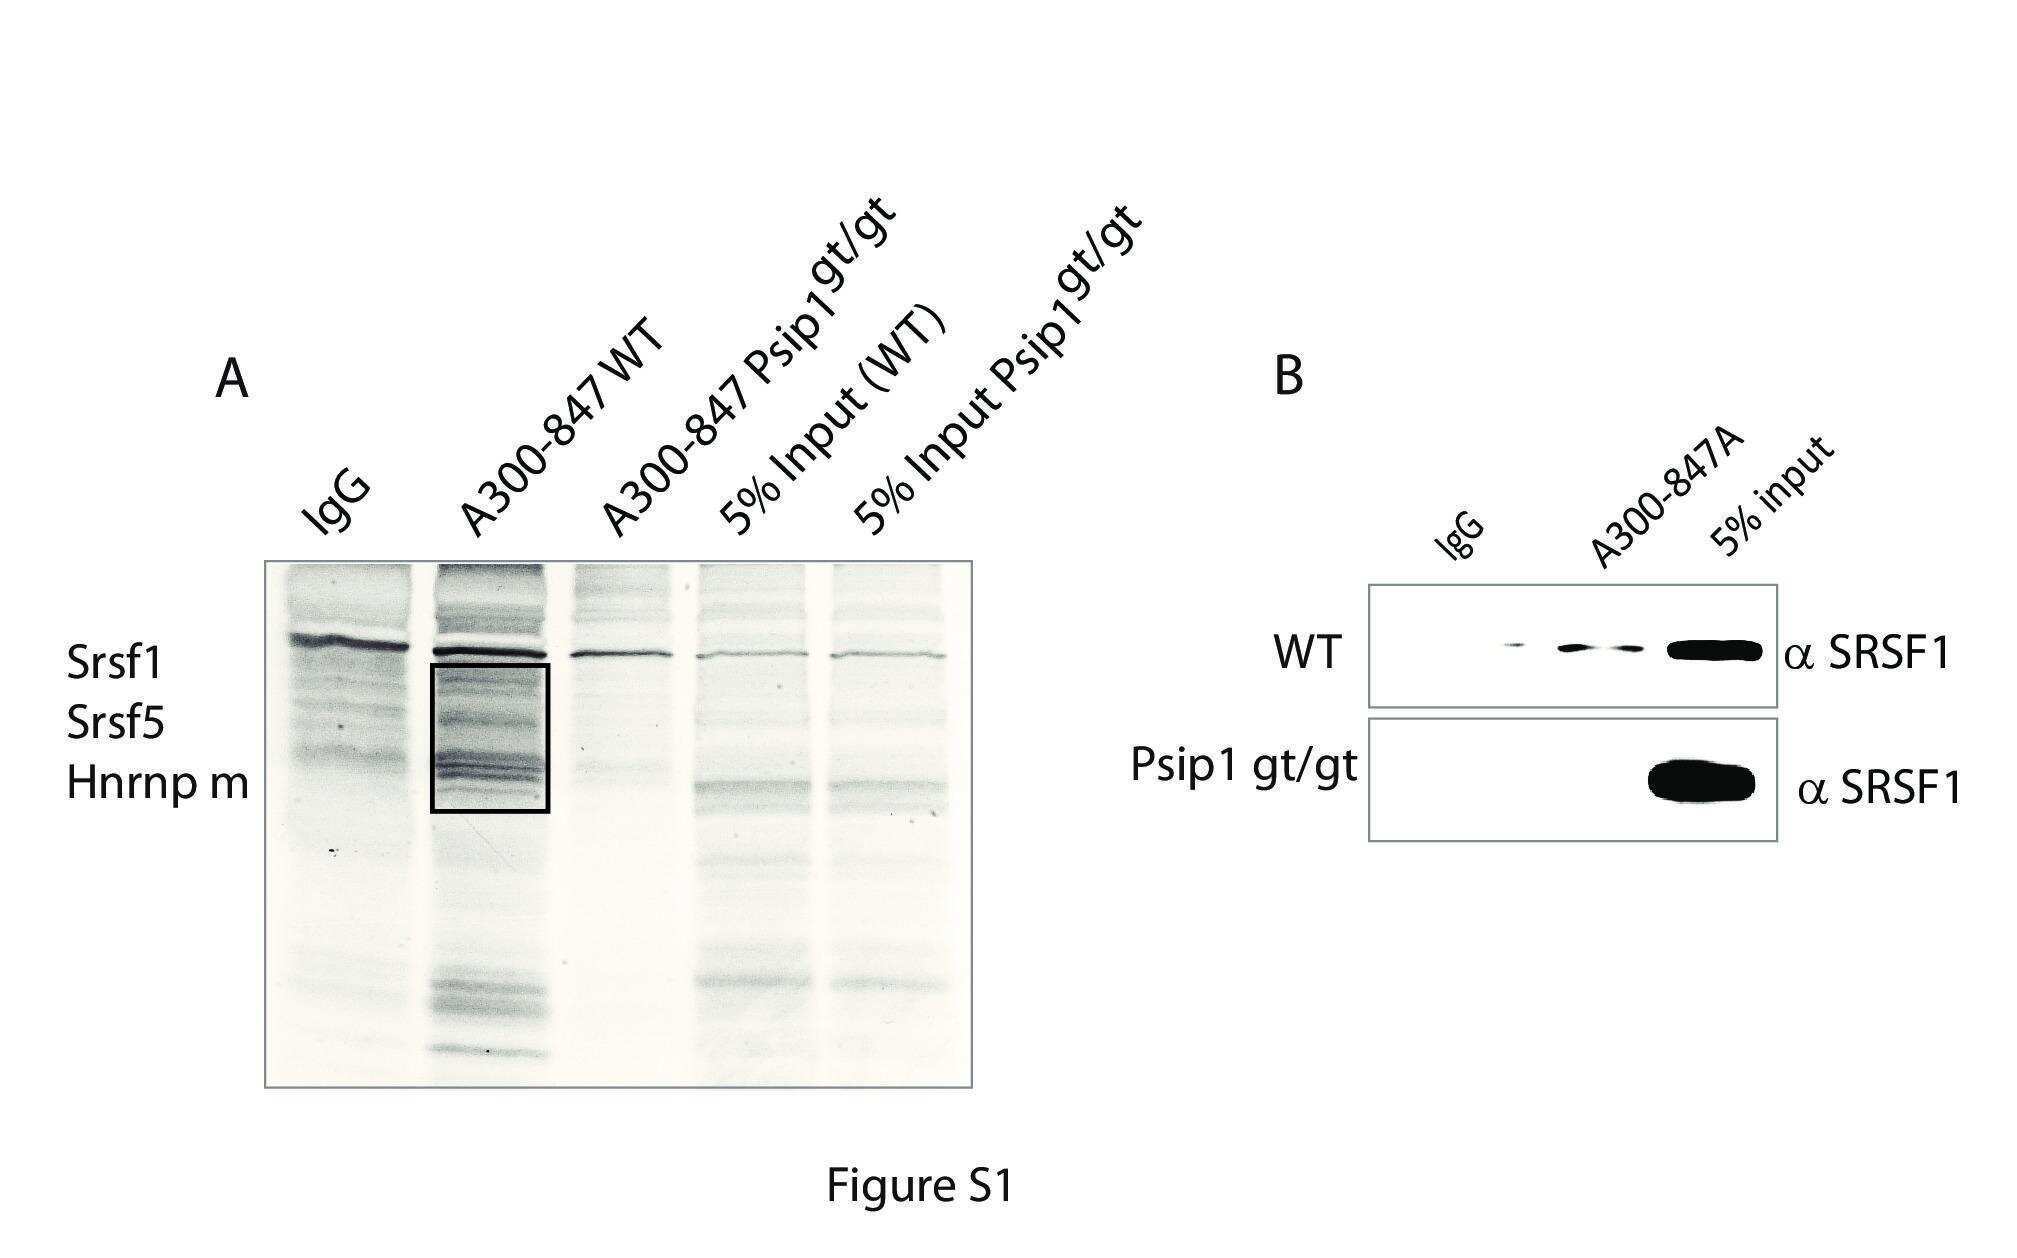
- Figure 3 Immunoprecipitation of Psip1/p52 and p75. A) Immunoblot of NIH 3T3 nuclear extract with antibodies; A300-848 which recognizes only the p75 isoform of Psip1, and A300-847 which detects both p52 and p75. B) IPs with IgG, A300-847 and A300-848 from NIH 3T3 nuclear extracts, immunoblotted with antibodies recognizing p75 (A300-848) or p52 (A300-847). Input is 5% total extract. C) Immunoblot of A300-847 IPs with alphaSRSF1. IP was also performed in the presence of RNase A. Input is 10% of total extract and IgG served as a control. D) In vitro pulldown of 293T cell expressed T7-SRSF1 using GST-p52 and Psip1-PWWP and immunoblotted with alphaT7. Input is 5% of T7-SRSF1 and GST alone is control. E) In vitro pulldown with GST-p52 of; T7-SRSF1 and mutants that mimic its hypo-(RG) and hyper-phosporylation (RD), T7-SRSF3 and GFP-SRSF2. Immunoblotting was with alphaT7 or alphaGFP. F) ChIP with alphaH3K36me3 from wild-type (wt) and Psip1 -/- MEFs immunoblotted with antibodies detecting Srsf1, Srsf2, Srsf3, PTB, Psip1 and H3K36me3. G) In vitro pulldown of HeLa core histones by T7-SRSF1 in the presence or absence of Psip1/p52 and immunoblotted with antibodies detecting pan H3, H3K36me3, H3K9me2 and H3K4me3.

- Submitted by
- Invitrogen Antibodies (provider)
- Main image
- Experimental details
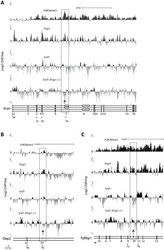
- Figure 6 ChIP for H3K36me3, Psip1, and Srsf1 in wt and Psip1 mutant MEFs. A) Mean log2 ChIP:input for H3K36me3, Psip1 and Srsf1 in wt MEFs across the Vcan (A), Diap2 (B) and Ppfibp1 (C) loci. Distribution of Srsf1 in chromatin from Psip1 -/- MEFs is also shown. Filled boxes indicate the positions of exons and the arrows indicate the position of alternatively spliced exons whose inclusion into spliced mRNAs is altered in Psip1 gt/gt cells. n = 2 biological replicates that also incorporate a technical (dye-swap) replicate. Array platform number is GPL14175 and the GEO accession numbers for ChIP data are; GSM782590 (Psip1), GSM782591 (H3K36me3), GSM782592 and GSM782593 (Srsf1 in wt), GSM782594 and GSM782595 (Srsf1 in Psip1 -/- ).

- Submitted by
- Invitrogen Antibodies (provider)
- Main image
- Experimental details
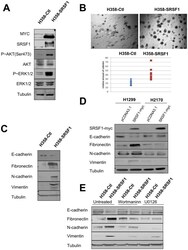
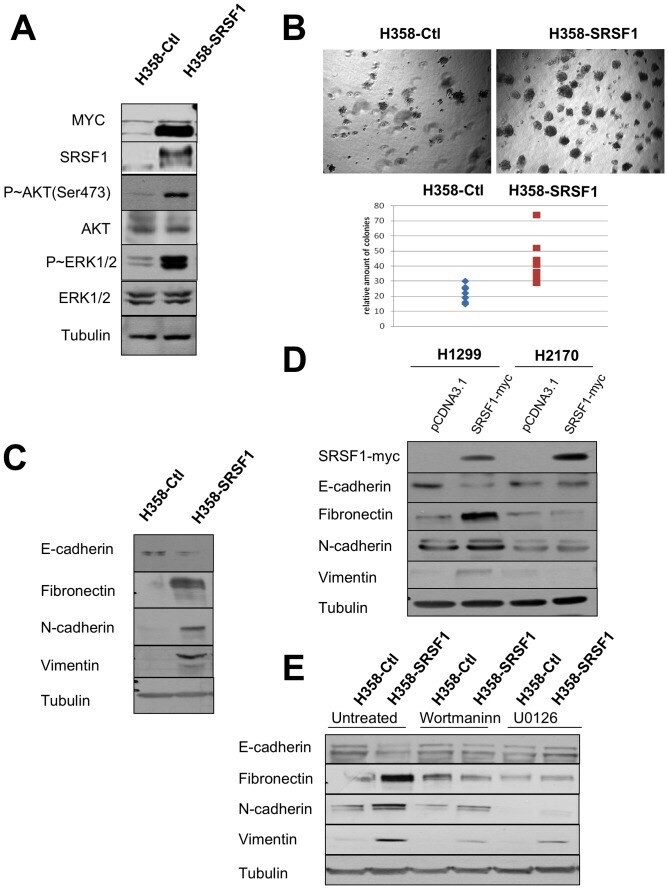
- Figure 7 SRSF1 overexpression confers a more aggressive phenotype. Western blot analyses (A, C, E) and soft agar assays (B) were performed in H358-Ctl and H358-SRSF1 cells that were cultured at the same passage. (A) Expression of SRSF1 and activation of AKT/ERK signaling pathways were analyzed by western blotting. Tubulin was used as a loading control. (B) Upper panels: representative images of colonies in soft agar. Magnification, x500. Lower panel: relative amounts of colonies in eight representative fields. Three independent experiments were performed in quadriplicate. (C) Western blot analysis of epithelial and mesenchymal markers. Tubulin was used as a loading control. (D) H1299 and H2170 cells were transfected either with control pcDNA3.1 or with myc-tagged SRSF1 plasmid. Transfected cells were selected during 6 days with G418 (800 ug/ml) and western blot analyses were performed using the indicated antibodies. Tubulin was used as a loading control. (E) H358-Ctl and H358-SRSF1 cells were cultured for 72 hours in the presence or absence of 500 nM wortmaninn or 10 uM U0126 as indicated. Expression of epithelial (E-cadherin) and mesenchymal (fibronectin, N-cadherin, vimentin) markers was analyzed by western blotting. Tubulin was used as a loading control.
- Submitted by
- Invitrogen Antibodies (provider)
- Main image
- Experimental details
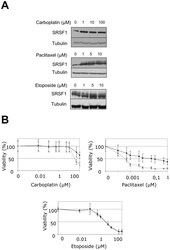
- Figure 8 SRSF1 overexpression increases resistance to carboplatin and paclitaxel. (A) H358 cells were treated for 24 hours with increasing amounts of etoposide, carboplatin or paclitaxel as indicated. SRSF1 protein level was analyzed by western blotting. Tubulin was used as a loading control. (B) 96-hours cell viability assays were performed in H358-Ctl cells (grey symbols) or H358-SRSF1 clones (black symbols) treated or not with increasing amounts of carboplatin, paclitaxel or etoposide. Results are expressed as the percentage of survival cells compared to untreated cells. Mean value of three independent experiments +- standard deviation performed in triplicate are presented.

- Submitted by
- Invitrogen Antibodies (provider)
- Main image
- Experimental details
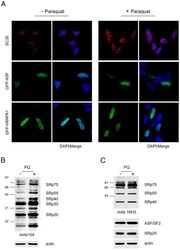
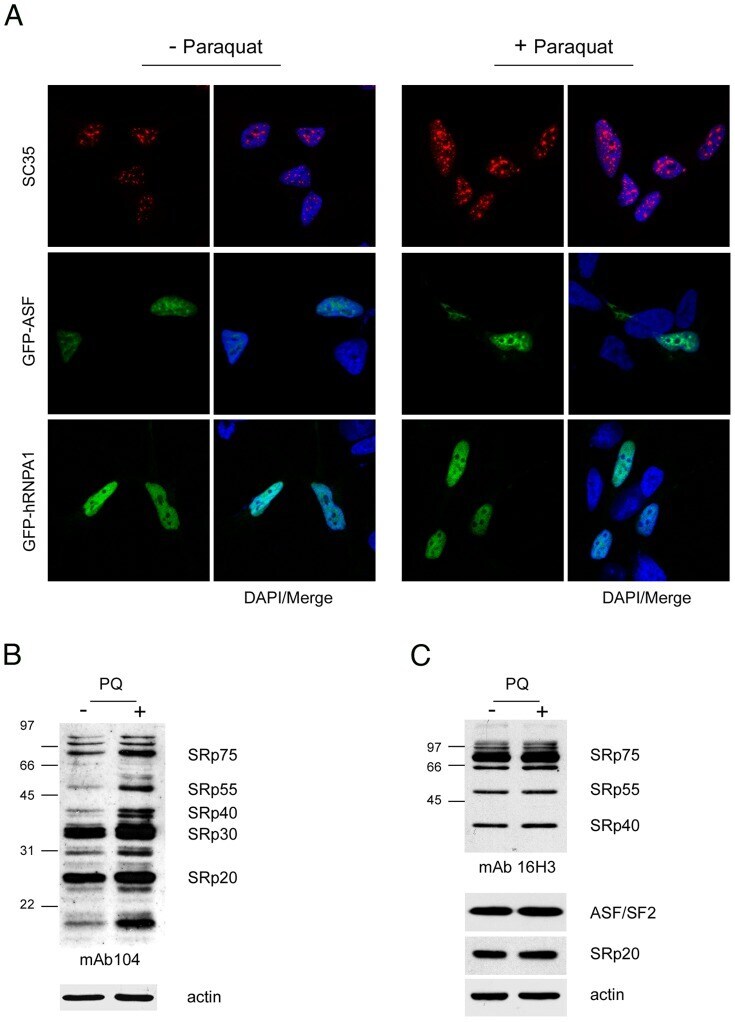
- Figure 1 Increased phosphorylation of SR proteins in PQ-treated cells. A. PQ induced relocalization of SR proteins in the nucleus of treated cells. SH-SY5Y cells treated with vehicle or with 0.75 mM PQ for 18 h were immunostained with an anti-SC35 antibody ( upper row ), transiently transfected with GFP-ASF/SF2 ( middle row ), or with GFP-hnRNPA1 ( lower row ). Nuclei were stained with DAPI. B. Increased phosphorylation of SR proteins in PQ-treated cells. Total extract of control or PQ-treated cells was probed with mAb104 to determine the phosphorylation state of classical SR proteins. C. The same extracts used for the Western blot shown in panel B were probed with the 16H3 monoclonal antibody that detects SR proteins regardless of their phosphorylation status, with anti ASF/SF2 and anti-SRp20 monoclonal antibodies. Actin was used as loading control.
- Submitted by
- Invitrogen Antibodies (provider)
- Main image
- Experimental details
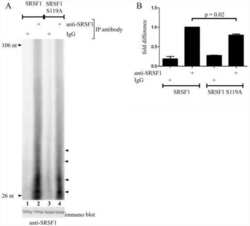
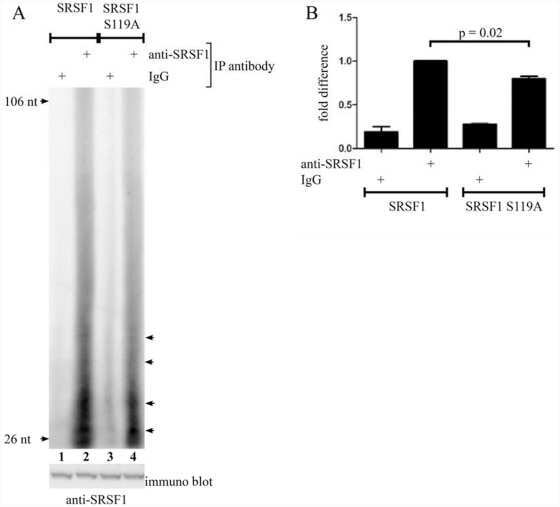
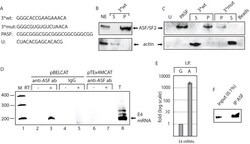
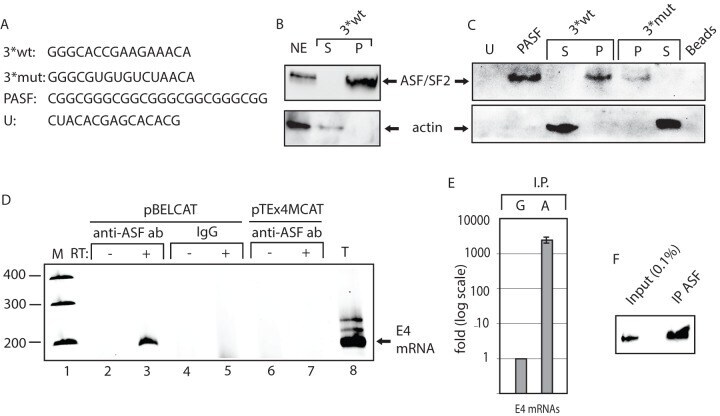
- Figure 5 ASF/SF2 binds to site III in the splicing enhancer at HPV-16 SA3358. ( A ) . Sequences of the HPV-16 wild type (3*wt) and mutant (3*mut) enhancer site III sequence, four copies of an optimal ASF/SF2 binding site (PASF) serving as positive control and an unrelated RNA sequence termed ""U"".The U sequence is adjacent to the ASF/SF2 site III in the HPV-16 genome. Biotinylated 2'-OMe-RNA forms of these sequences were used for RNA-protein pull-down experiments. ( B ) RNA-mediated pull down of ASF/SF2 from nuclear extracts protein usingbiotinylated, 2'-OMe-RNA sequences of wild type 3*wt RNA followed by Western blot analysis of RNA binding proteins in the pellet (P) or unbound proteins in the supernatant (S). ( C ) Western blot analysis of ASF/SF2 or actin after pull down of proteins using the various RNAs indicated in the figure. Pellet (P) represent the fraction of RNA bound proteins while unbound proteins are located in the supernatant (S). ( D ) RT-PCR on E4 mRNAs with primers 757s and E4A on cDNA synthesised from in vivo UV cross-linked, RNA-protein complexes immunoprecipitated with monospecific antibodies against ASF/SF2 (anti-ASF ab) or mouse IgG (IgG). Cells where either transfected with pBELCAT or the enhancer mutant pTEx4MCAT. RT-PCR was performed in the absence (-) or presence (+) of RT-enzyme for each sample. M, molecular weight markers; T, total cytoplasmic RNA. ( E ) Real time PCR of HPV-16 E4 mRNAs immunoprecipitated with mouse IgG (G) or anti-AFS/
- Submitted by
- Invitrogen Antibodies (provider)
- Main image
- Experimental details
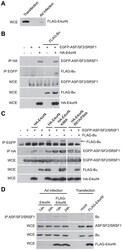
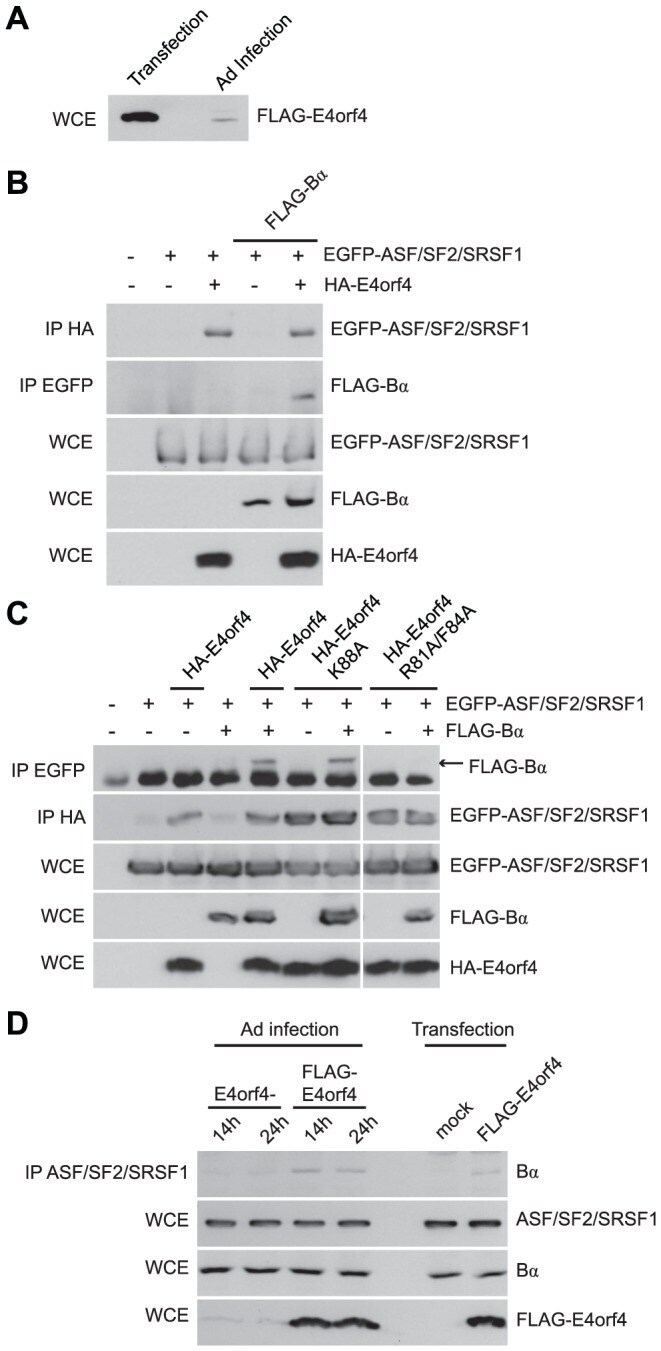
- Figure 8 E4orf4 targets ASF/SF2/SRSF1 to PP2A B55alpha . Role of E4orf4 in adenovirus infection. ( A ) SDS-PAGE analysis comparing the expression levels of FLAG-E4orf4 by plasmid DNA transfection (5 ug of protein extract loaded) and adenovirus infection at a multiplicity of infection (MOI) of 5 with Ad5 FLAG-E4orf4 virus of H1299 cells (100 ug of protein extract loaded). ( B ) Co-immunoprecipitation experiments where HA-E4orf4 was immunoprecipitated using anti-HA antibodies and western blots performed using anti-EGFP antibodies to detect interactions between HA-E4orf4 and EGFP-ASF/SF2/SRSF1. Additionally, EGFP-ASF/SF2/SRSF1 was immunoprecipitated using anti-EGFP antibodies and western blots performed using anti-FLAG antibodies to detect interactions between EGFP-ASF/SF2/SRSF1 and FLAG-B55alpha. Whole cell extracts (WCE) shown for EGFP-ASF/SF2/SRSF1, FLAG-B55alpha, and HA-E4orf4. ( C ) Similar co-immunoprecipitation experiments were performed as in (B) except with the addition of class II (HA-E4orf4 K88A) and class I (HA-E4orf4 R81A/F84A) E4orf4 mutants. ( D ) Co-immunoprecipitation experiments where ASF/SF2/SRSF1 was immunoprecipitated using anti-ASF antibodies and western blots performed using anti-B55alpha antibodies to detect interactions between ASF/SF2/SRSF1 and B55alpha during the course of infection (MOI = 20) with virus lacking E4orf4 (E4orf4-) and wild type Ad5 FLAG-E4orf4 (14 h and 24 h), as well as FLAG-E4orf4 transfection. All loadings for WCE were equal except fo
- Submitted by
- Invitrogen Antibodies (provider)
- Main image

- Experimental details
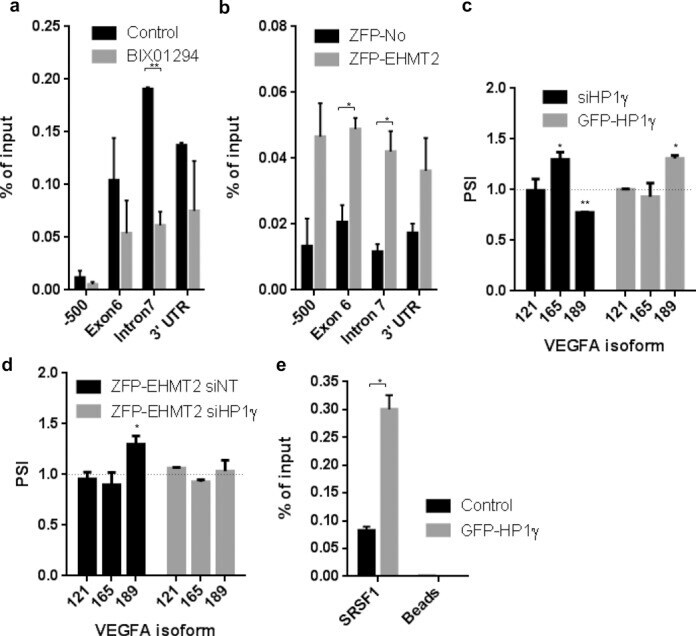
- Figure 4. An H3K9me/HP1gamma/SRSF1 adaptor system on VEGFA . ( a ) ChIP of HP1gamma along VEGFA in MCF7 cells treated with BIX01294 for 24 h. ( b ) ChIP of HP1gamma along VEGFA in HEK293 cells transfected with either ZFP-No (ZFP binding domain alone) or ZFP-EHMT2 for 24 h. ( c ) MCF7 cells were transfected with siNT or siHP1gamma for 72 h or HEK293 cells were transfected with either GFP-empty vector or GFP-HP1gamma for 24 h. mRNA levels were assessed using qPCR; VEGFA isoform values are normalized to total VEGFA mRNA; dashed line indicates siNT of GFP-empty vector values. ( d ) HEK293 cells were transfected with siNT or siHP1gamma for 48 h and then transfected with ZFP-No or ZFP-EHMT2 for 24 h. mRNA levels were assessed using qPCR; VEGFA isoform values are normalized to total VEGFA mRNA; dashed line indicates ZFP-No/siNT values or ZFP-No/siHP1gamma. ( e ) RNA-ChIP of SRSF1 to VEGFA mRNA in HEK293 cells transfected with either GFP-empty vector or GFP-HP1gamma for 24 h. (a, b, e) Values represent means +- SEM from three independent experiments. (c and d) Values represent averages of three independent experiments +-SD (* P < 0.05, ** P < 0.01, t -test).
- Submitted by
- Invitrogen Antibodies (provider)
- Main image
- Experimental details
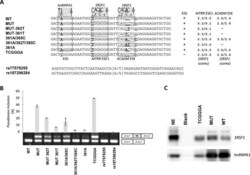
- Figure 2. The balanced interplay between an hnRNP A1 binding ESS and two SRSF1 binding ESEs dictate MTRR pseudoexon activation. ( A ) Schematic representation of the sequences from MTRR -minigenes used and the nucleotide changes introduced. A pictogram of hnRNP A1 position weight matrix ( 38 ) is shown above the putative ESS and the invariant position 2 of this motif is underscored. A pictogram of the SRSF1 position weight matrix ( 36 ) is shown above the previously described ESE1 ( 18 ) and the ACADM like ESE. Indicated positions 361, 362 and 365 are relative to the ACADM coding sequence. Nucleotide positions that were changed are underscored. ( B ) Splicing minigene assay. MTRR -minigenes were transiently transfected into HEK293. After RNA isolation the splicing products were analyzed by RT-PCR. The upper panel shows the average of pseudoexon inclusion from two measurements of each duplicate. Error bars represent the range. Quantification of PCR products was performed using a Fragment Analyzer instrument. The lower panel shows a sample agarose gel electrophoresis displaying pseudoexon inclusion levels in the different cell lines. The lower bands represent correctly spliced exons, whereas the upper bands represent MTRR pseudoexon inserted between minigene exons. Psi marks the pseudoexon. ( C ) Binding of hnRNPA1 and SRSF1 proteins. Biotinylated RNA oligonucleotides were used in a pull-down experiment with HeLa nuclear extract followed by SDS PAGE and western blot analysis us

- Submitted by
- Invitrogen Antibodies (provider)
- Main image
- Experimental details
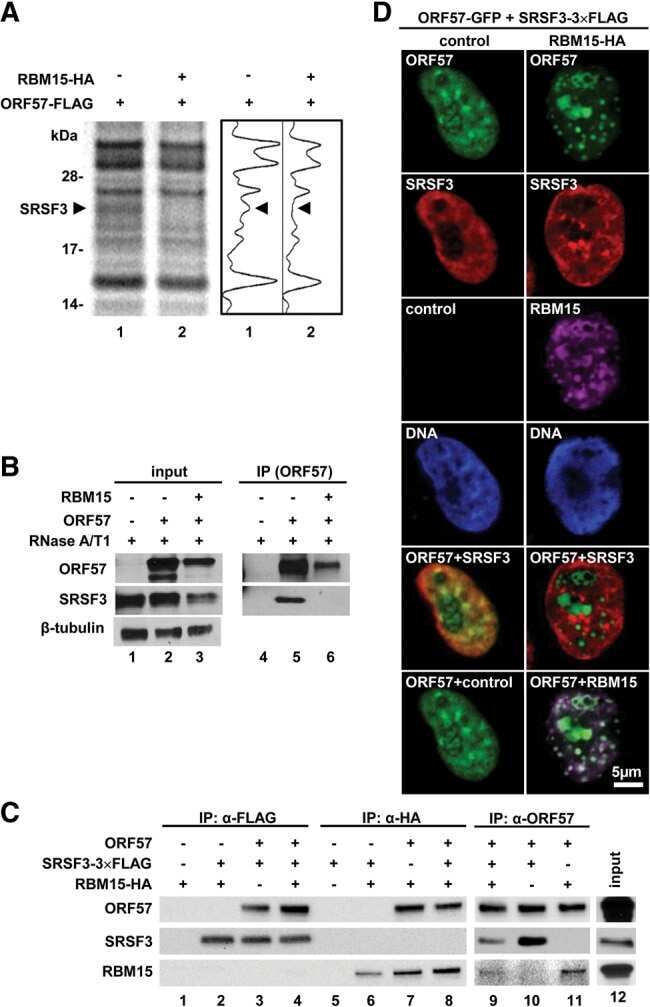
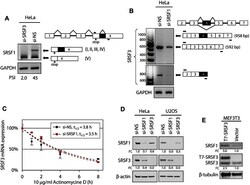
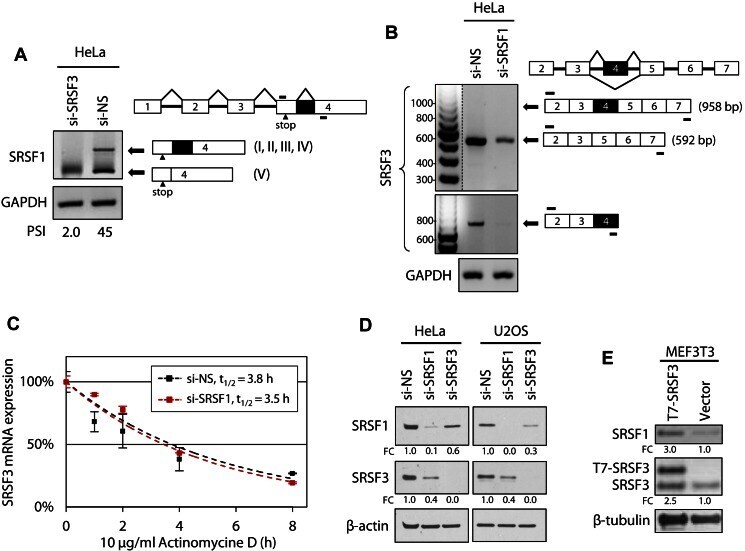
- Figure 7. SRSF3 and SRSF1 are mutually regulated in cells. ( A ) SRSF3 knockdown in HeLa cells activates the usage of a cryptic intron in the SRSF1 exon 4. HeLa cells were transfected with Dharmacon si-NS or si-SRSF3 as described in Figure 4 and total RNA from the cells was analyzed by RT-PCR for activation of a cryptic intron (dark box) in the SRSF1 3' UTR. ( B ) Knocking down SRSF1 expression in HeLa cells affects SRSF3 transcript level, but not inclusion or skipping of the SRSF3 exon 4. Knockdown of SRSF1 expression in HeLa cells was performed as described in Figure 4 . See other details in Figure 3 . ( C ) Knocking down SRSF1 expression in HeLa cells does not affect SRSF3 RNA stability in a pause-chase RNA decay assay. Following 10 mug/ml actinomycin D treatment for 0, 1, 2, 4 and 8 h, HeLa cells with Dharmacon si-NS or si-SRSF1 knockdown as described in Figure 4 were examined for the quantitative levels of the exon 4-skipped SRSF3 RNA and GAPDH RNA at each time point by quantitative RT-qPCR. After normalizing to GAPDH RNA, the exon 4-skipped SRSF3 RNA decay rate was calculated by setting the RNA levels at 0 h as 100% for both si-NS and si-SRSF1 groups. Exponential fitting curves over each time point are determined as y = e -0.185x , R 2 = 0.8739 for si-NS group and y = e -0.201x , R 2 = 0.9819 for si-SRSF1 group. Half-life (t 1/2 ) of the exon 4-skipped SRSF3 RNA was calculated as 3.8 h for si-NS transfected cells, and 3.5 h for si-SRSF1 transfected cells. ( D ) Exp
- Submitted by
- Invitrogen Antibodies (provider)
- Main image
- Experimental details
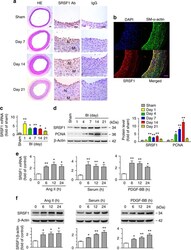
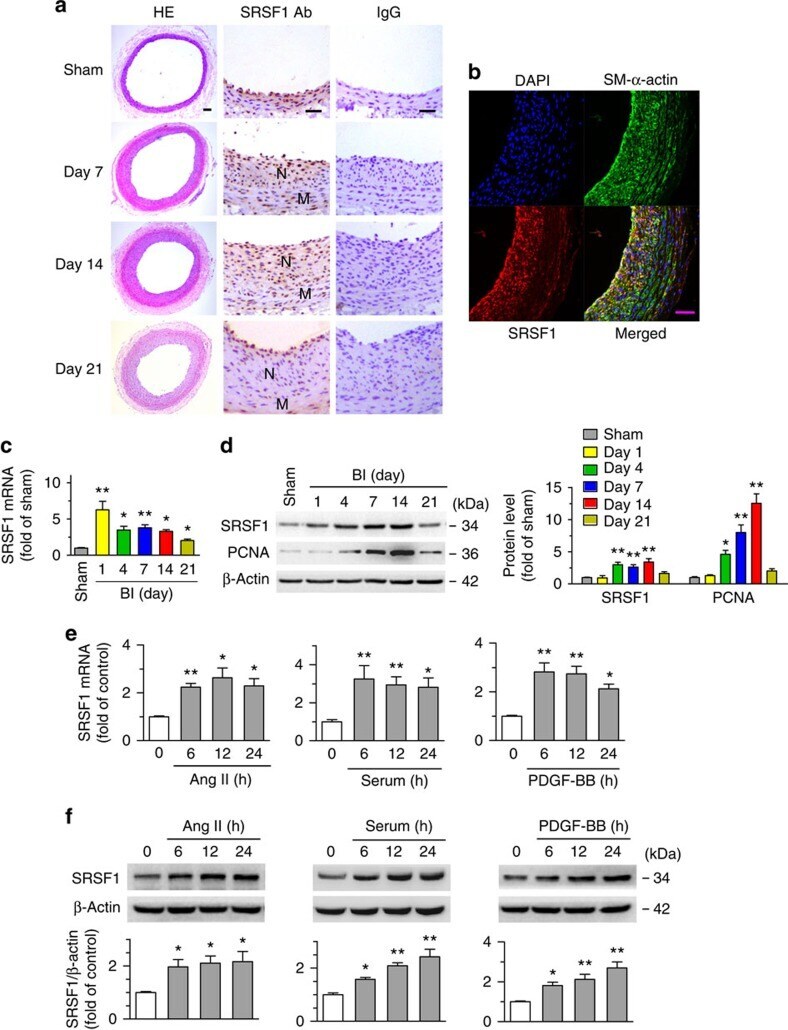
- Figure 1 Increased SRSF1 expression in proliferating VSMCs in vivo and in vitro . ( a ) Photomicrographs of haematoxylin/eosin-stained carotid arteries from sham-operated and balloon-injured rats. Immunohistochemical staining of vessels with specific anti-SRSF1 antibody revealed SRSF1 mainly in the neointima (N, neointima; M, media). Normal rabbit IgG served as a negative control. Scale bars, 50 mum. ( b ) Immunofluorescence double staining of injured carotid arteries with specific antibodies against SM-alpha-actin (green) or SRSF1 (red). Nuclei were stained with DAPI (blue), and yellow indicates their co-localization in the merged images. Scale bars, 50 mum. ( c ) Real-time PCR showing the mRNA levels of SRSF1 in carotid arteries at 1, 4, 7, 14 and 21 days after balloon injury; n =8 per group. ( d ) Representative western blots and averaged data showing SRSF1 and PCNA levels in rat carotid arteries at 1, 4, 7, 14 and 21 days after balloon injury; n =8 per group. ( e ) Real-time PCR data showing the mRNA levels of SRSF1 in HASMCs treated with Ang II (200 nM), serum (10% FBS) or PDGF-BB (10 mug l -1 ) at 6, 12 and 24 h; n =8 per group. ( f ) Representative western blots and averaged data showing SRSF1 levels in HASMCs treated as in e ; n =7 per group. * P
- Submitted by
- Invitrogen Antibodies (provider)
- Main image
- Experimental details
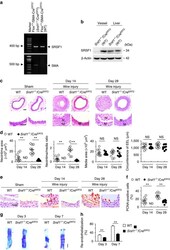
- Figure 2 SRSF1 deficiency in VSMCs inhibits neointima formation. ( a ) PCR showing genotyping of WT (Flox +/+ Cre - ) and Srsf1 -/- (Flox +/+ Cre + ) mice. Band in the upper image indicates the product from SRSF1 flox/flox , and lower image indicates product from SM22alpha-Cre. ( b ) Representative western blots showing SRSF1 levels in vessel from smooth muscle cell-specific Srsf1 knockout ( Srsf1 -/- ) mice. ( c , d ) Representative photomicrographs of haematoxylin and eosin staining (scale bars, 50 mum) ( c ) and averaged data ( d ) of the neointimal area, neointima/media ratio, media area and circumference of external elastic lamina (EEL) of carotid arteries from Srsf1 -/- and WT control mice 14 and 28 days after wire injury (N, neointima; M, media); n =9 per group. ( e , f ) Representative photomicrographs of immunohistochemical staining (scale bar, 25 mum) ( e ) and averaged data ( f ) showing the percentages of PCNA-positive cells in carotid arteries from Srsf1 -/- and WT control mice 14 and 28 days after wire injury. Arrows indicate PCNA-positive cells (dark brown); n =9 per group. ( g , h ) Representative pictures ( g ) and averaged data ( h ) of re-endothelialization. Re-endothelialization was quantified in Evans blue-stained carotid arteries at 3 and 7 days after vascular injury. Blue staining indicates endothelial denudation. Scale bar, 1 mm; n =9 per group. ** P

- Submitted by
- Invitrogen Antibodies (provider)
- Main image
- Experimental details
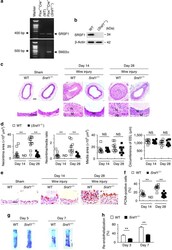
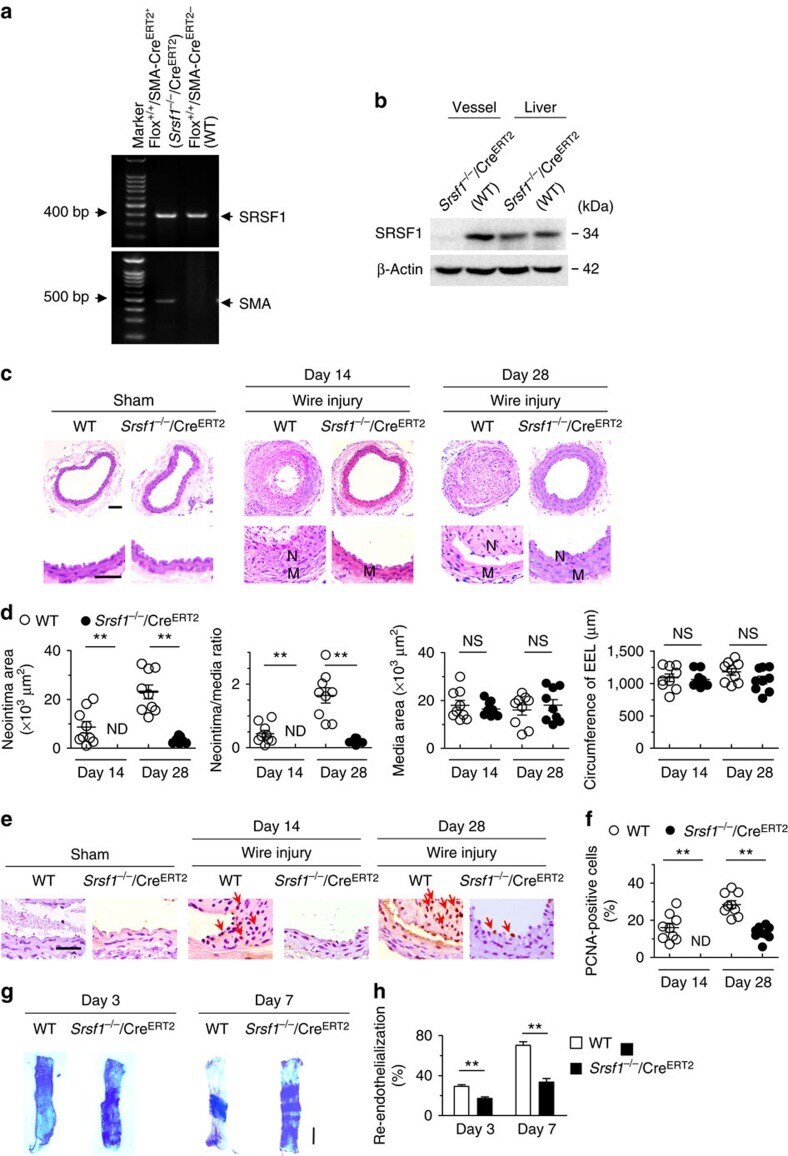
- Figure 3 Inducible SMC-specific SRSF1 deficiency inhibits neointima formation. ( a ) PCR showing genotyping of WT (Flox +/+ Cre ERT2- ) and Srsf1 -/- /Cre ERT2 (Flox +/+ Cre ERT2+ ) mice. Band in the upper image indicates the product from SRSF1 flox/flox , and lower image indicates product from SMA-Cre ERT2 . ( b ) Representative western blots showing SRSF1 levels in the vessel and liver from inducible smooth muscle cell-specific Srsf1 knockout ( Srsf1 -/- /Cre ERT2 ) mice. ( c , d ) Representative photomicrographs of haematoxylin and eosin staining (scale bars, 50 mum) ( c ) and averaged data ( d ) of the neointimal area, neointima/media ratio, media area and circumference of external elastic lamina (EEL) of carotid arteries from Srsf1 -/- /Cre ERT2 and WT control mice 14 and 28 days after wire injury (N, neointima; M, media); n =9 per group. ( e , f ) Representative photomicrographs of immunohistochemical staining (scale bar, 25 mum) ( e ) and averaged data ( f ) showing the percentages of PCNA-positive cells in carotid arteries from Srsf1 -/- /Cre ERT2 and WT control mice 14 and 28 days after wire injury. Arrows indicate PCNA-positive cells (dark brown); n =9 per group. ( g , h ) Representative pictures ( g ) and averaged data ( h ) of re-endothelialization. Re-endothelialization was quantified in Evans blue-stained carotid arteries at 3 and 7 days after vascular injury. Blue staining indicates endothelial denudation. Scale bar, 1 mm; n =9 per group. ** P
- Submitted by
- Invitrogen Antibodies (provider)
- Main image
- Experimental details
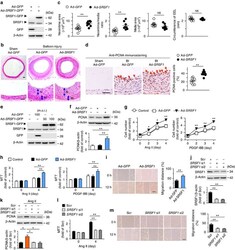
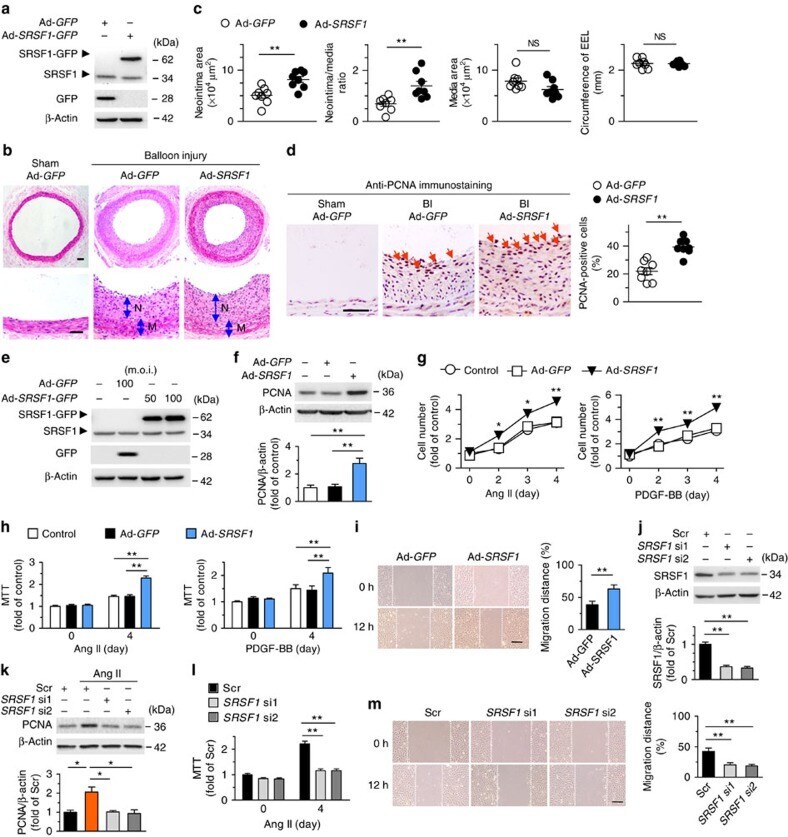
- Figure 4 SRSF1 enhances HASMC proliferation and neointima formation. ( a ) Western blots showing SRSF1 protein in rat carotid arteries 4 days after Ad- SRSF1 - GFP delivery; n =5. ( b , c ) Haematoxylin/eosin staining (scale bars, 50 mum) ( b ) and averaged data ( c ) of the neointimal area, neointima/media ratio, media area and circumference of external elastic lamina (EEL) of rat carotid arteries transfected with Ad -GFP or Ad- SRSF1 14 days postinjury (N, neointima; M, media); n =8 each. ( d ) PCNA staining (scale bar, 25 mum) (left) and the percentage of PCNA-positive cells (right) in rat carotid arteries infected with Ad- SRSF1 14 days postinjury. Arrows indicate PCNA-positive cells (dark brown); n =8 each. ( e ) SRSF1 expression in cultured HASMCs infected with Ad- GFP or Ad- SRSF1 (m.o.i. 50 and 100); n =5. ( f ) PCNA protein levels in HASMCs infected with Ad- GFP or Ad- SRSF1 ; n =5 each. ( g , h ) Cell counts ( g ) and MTT assays ( h ) of HASMCs infected with Ad- GFP or Ad- SRSF1 after Ang II or PDGF-BB stimulation for 4 days; n =12 each. ( i ) Representative images and migration distance from wound-healing assays in HASMCs infected with Ad- GFP or Ad- SRSF1 ; n =9 each. Scale bar, 200 mum. ( j ) SRSF1 expression in HASMCs infected with scrambled or SRSF1 siRNAs (si1 and si2); n =6 each. ( k ) PCNA levels in cultured HASMCs infected with scrambled or SRSF1 siRNAs after Ang II stimulation (24 h); n =5 each. ( l ) MTT assays of HASMCs infected with SRSF1 siRNAs after A
- Submitted by
- Invitrogen Antibodies (provider)
- Main image
- Experimental details
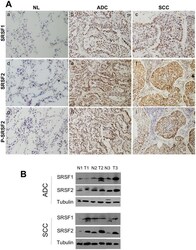
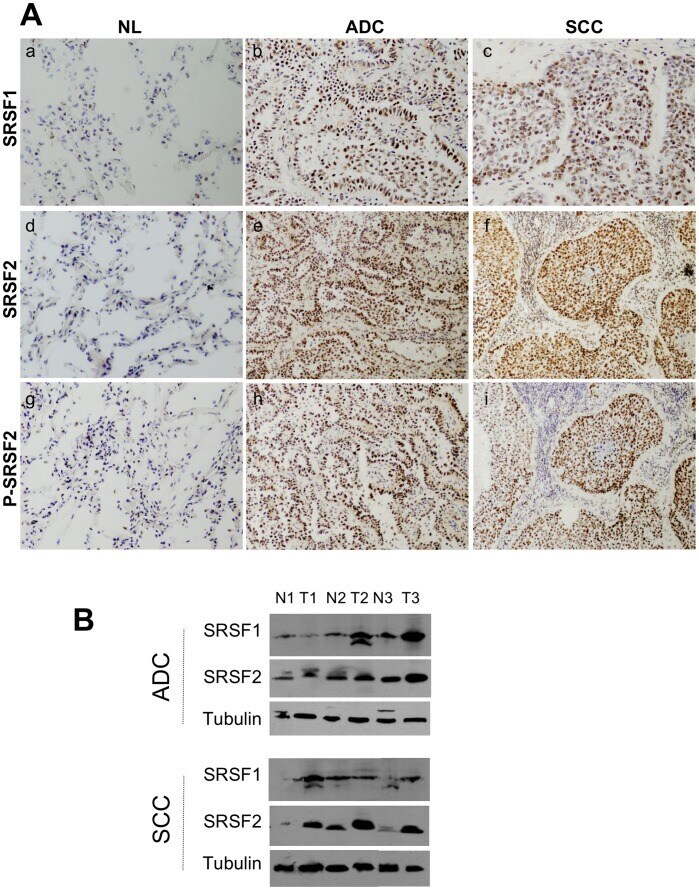
- Figure 1 Expression of SRSF1, SRSF2 and phosphorylated SRSF2 proteins in NSCLCs. A, Representative immunostaining from frozen section of normal lung parenchyma and lung cancer tissue with anti SRSF1 (a, b, c), anti SRSF2 (d,e,f) and anti phospho-SRSF2 (g, h, i) antibodies [(a, d, g) normal lung; (b, e, h) ADC; (c, f, i) SCC; immunoperoxidase and haematoxylin counterstaining]. B, Representative western blots demonstrating overexpression of SRSF1 and SRSF2 proteins in lung tumors compared with their matched normal lung tissues. (NL, normal lung; ADC, adenocarcinoma; SCC, squamous cell carcinoma).
- Submitted by
- Invitrogen Antibodies (provider)
- Main image
- Experimental details
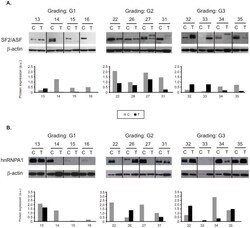
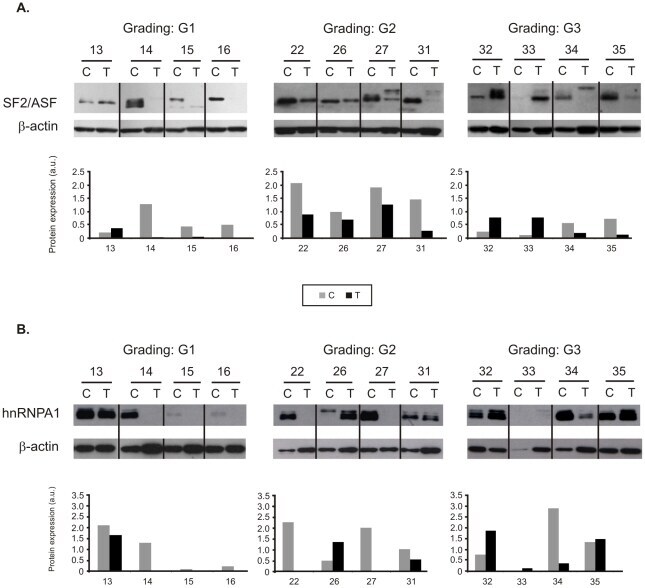
- Figure 4 Protein expression of splicing factors in twelve representative pairs of control (C) and tumor (T) samples. Tumor grades of differentiation are shown (G1, G2, G3). Western blots of SF2/ASF ( A ) and hnRNP A1 ( B ) were used for semiquantitative analysis of protein bands after normalization to beta-actin. Gray bars represent control samples. Black bars represent tumor samples.
- Submitted by
- Invitrogen Antibodies (provider)
- Main image

- Experimental details
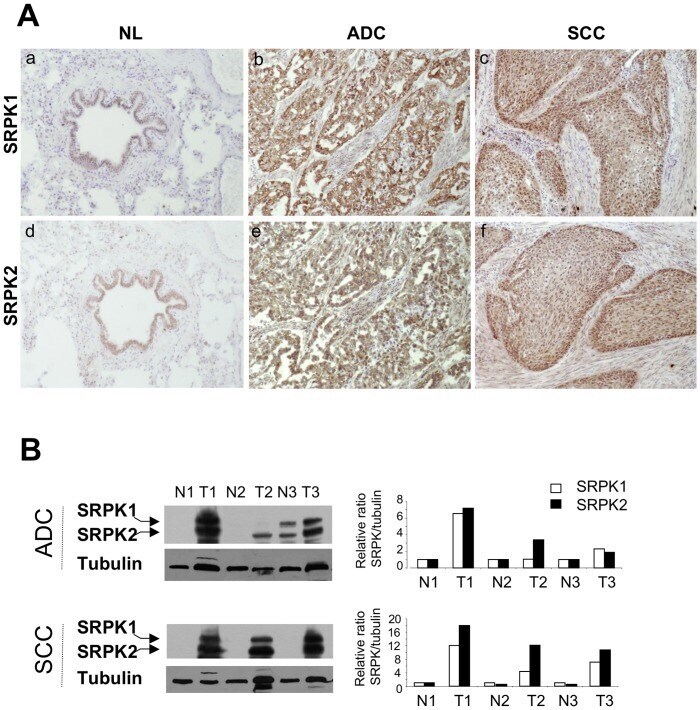
- Figure 5 Expression of SRPK1 and SRPK2 proteins in NSCLCs. A, Representative immunostaining from frozen section of normal lung parenchyma and lung cancer tissue with anti SRPK1 (a, b, c) and anti SRPK2 (d, e, f) antibodies [(a, d) normal lung; (b, e) ADC; (c, f) SCC; immunoperoxidase and haematoxylin counterstaining]. B, Left panels: Representative western blots illustrating overexpression of SRPK1 and SRPK2 in lung tumors compared with their matched normal lung tissues. (NL, normal lung; ADC, adenocarcinoma; SCC, squamous cell carcinoma). Right panels: Densitometric analysis of western blot experiment was performed using Image J software. Each signal was quantified and the SRPK1/2:tubulin ratio was calculated in each case. The value 1 was arbitrarily assigned to the ratio obtained in normal tissues and a relative ratio was calculated for each tumor sample according to its normal tissue pair.
- Submitted by
- Invitrogen Antibodies (provider)
- Main image
- Experimental details
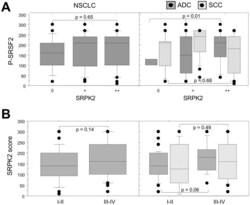
- Figure 6 Relationship between SRPK2 protein expression and phospho-SRSF2 status in NSCLC subtypes. A, Distribution of phospho-SRSF2 scores in tumors displaying normal (class 0), moderate (class +) or overexpression (class ++) of SRPK2, in all the tumors (left panels, NSCLC) and in histological subtypes (right panels, ADC and SCC). B, Distribution of SRPK2 scores according to the tumor stage, in all the tumors (left panels, NSCLC) and in histological subtypes (right panels, ADC and SCC). Statistical analysis was done using Mann-Whitney's U test.

- Submitted by
- Invitrogen Antibodies (provider)
- Main image
- Experimental details
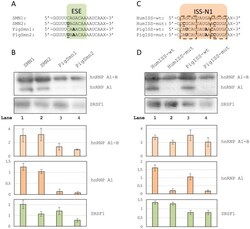
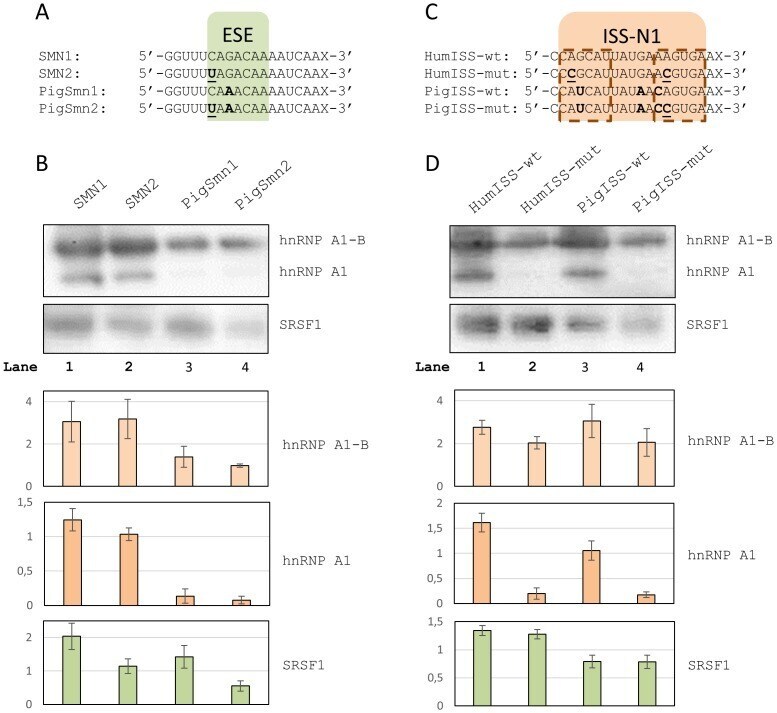
- Figure 4 RNA affinity pull-down experiments. A ) RNA oligos spanning the ESE in SMN1 exon 7. Bases in bold indicate positions where the pig and the human sequences differ. The +6C>T mutation is indicated in bold underline. X indicates biotin. B ) Western blots of protein pull-downs with oligos spanning the ESE. Two bands are seen for hnRNP A1, the upper band most likely being the alternative B splice isoform. Barplots indicate normalized band intensities for the indicated protein bands. Error bars indicate standard error of mean (n = 3). C ) RNA oligos spanning the ISS in SMN1 intron 7. Bases in bold indicate positions where the pig sequence differs from the human. Mutations introduced are indicated in bold underline. X indicates biotin. The hnRNP A1 binding sites within ISS-N1 have been indicated in dashed outline. D ) Western blots of protein pull-downs with oligos spanning the ISS. Barplots indicate normalized band intensities for the indicated protein bands. Error bars indicate standard error of mean (n = 3).
- Submitted by
- Invitrogen Antibodies (provider)
- Main image

- Experimental details
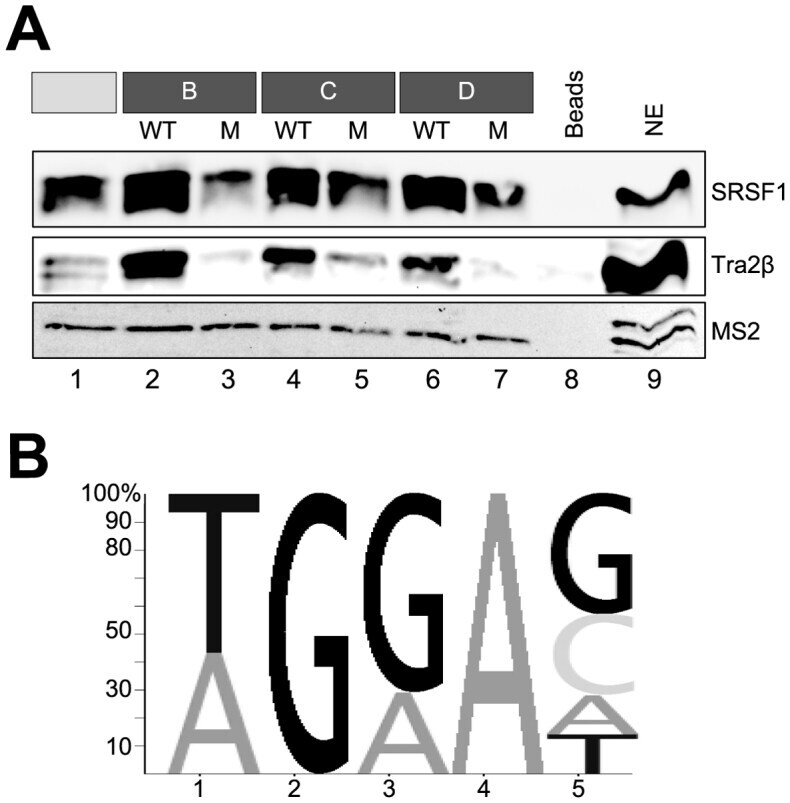
- Figure 6. Western blot of SRSF1 and Tra2beta binding to each fragment but not to the mutant variants. ( A ) RNAs including MS2 loops were immobilized using agarose beads, and analyzed for proteins binding by western blot. After the precipitated proteins have been resolved by SDS-PAGE (12%), specific antibodies directed against SRSF1 and Tra2beta were used. MS2 coat protein added to the nuclear extract served as a loading control. ( B ) Sequence logo generated from a sequence motif generated by manual alignment of fragments A, B, C and D. The size of the letters reflects the relative frequency of the nucleotides at the position in the alignment.
- Submitted by
- Invitrogen Antibodies (provider)
- Main image
- Experimental details
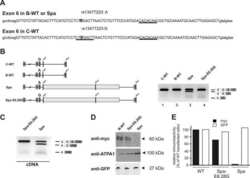
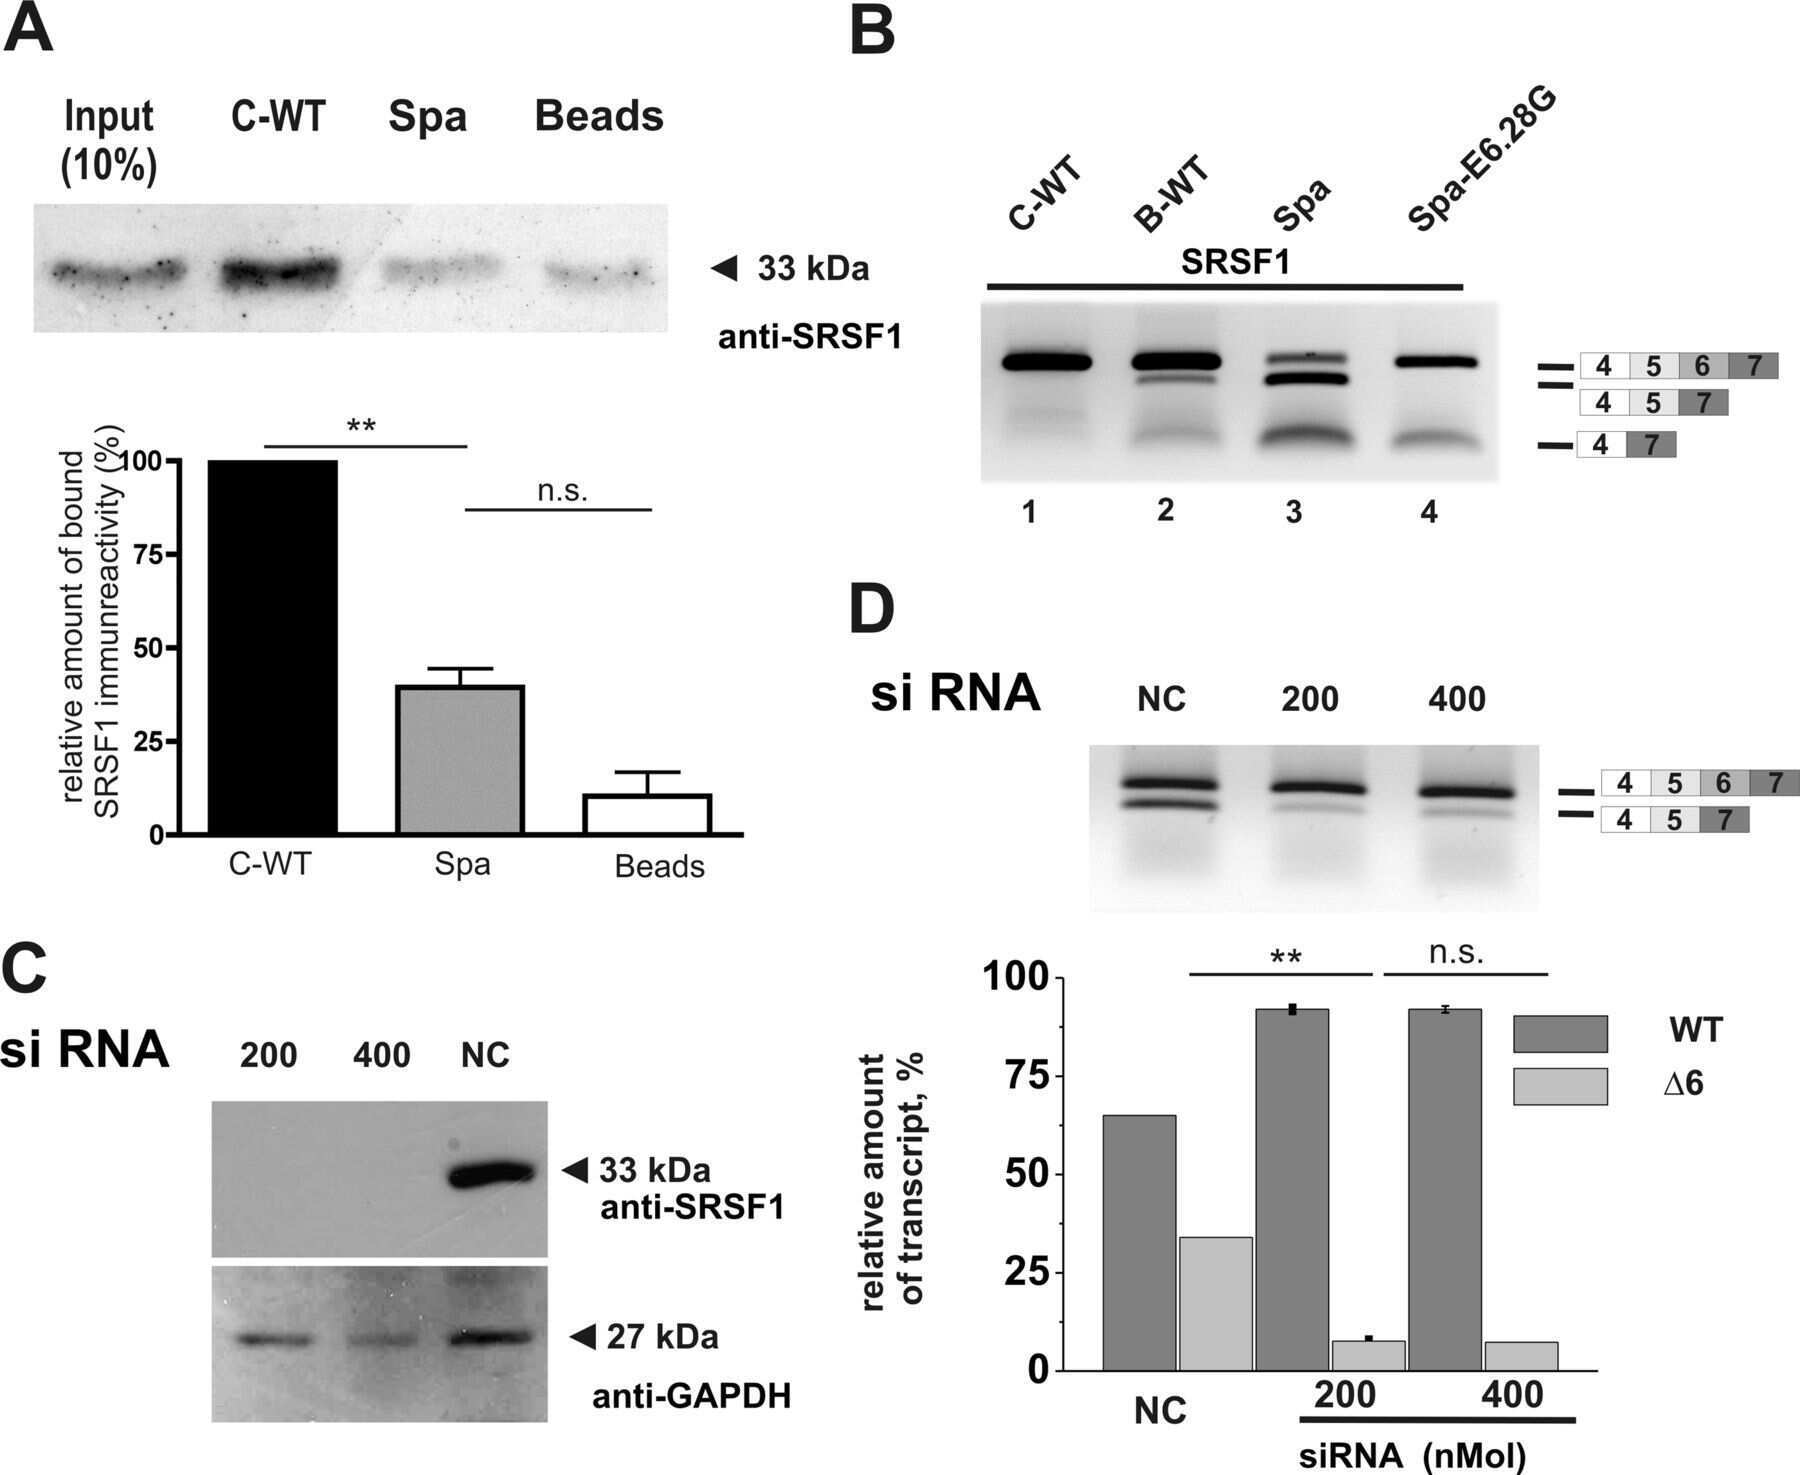
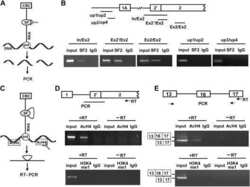
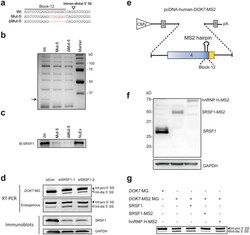
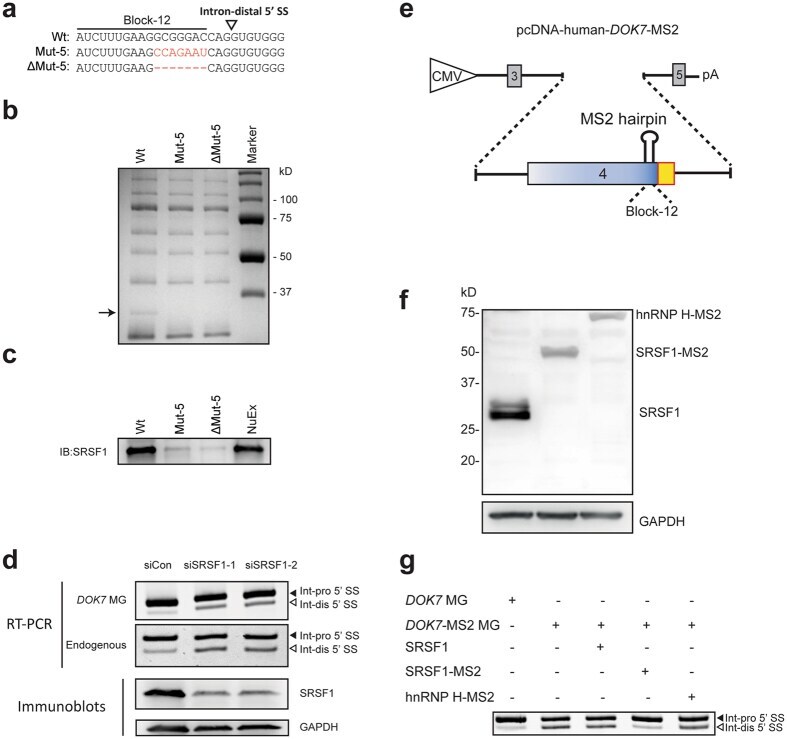
- Figure 4 SRSF1 binds to the identified cis -element and facilitates selection of the intron-proximal 5' SS of DOK7 intron 4. ( a ) RNA probes carrying wild-type (Wt), mutant (Mut-5), and partially deleted (DeltaMut-5) sequences. ( b ) Coomassie blue staining of RNA affinity-purified products using HeLa nuclear extract with the indicated biotinylated RNA probes. A single protein band at ~30 kDa (black arrow) is associated with Wt probe, but not with Mut-5 or DeltaMut-5 probe. Mass spectrometry analysis revealed that the identity of this protein is SRSF1. The other bands commonly observed in the Wt, Mut-5 and DeltaMut-5 RNA probes are repeatedly identified in our RNA affinity purification analyses 43 , 45 , 55 . Mass spectrometry analysis of these bands revealed that none of the identified proteins carry an RNA-recognition motif, suggesting that these bands are likely due to non-specific binding of proteins to the streptavidin-sepharose beads. NuEx, HeLa nuclear extract. ( c ) Immunoblotting of RNA affinity-purified proteins in panel (b) with anti-SRSF1 antibody. ( d ) Upper panels show RT-PCR of DOK7 minigene ( DOK7 MG) encoded by pcDNA-human- DOK7 and endogenous DOK7 transcripts in HeLa cells treated with two different siRNAs against SRSF1 (siSRSF1-1 and siSRSF1-2). Lower panels show immunoblotting with indicated antibodies after SRSF1 -knockdown with two different siRNAs in HeLa cells. ( e ) Schematic of pcDNA-human- DOK7 -MS2 minigene. Block-12 sequence is substituted with
- Submitted by
- Invitrogen Antibodies (provider)
- Main image
- Experimental details
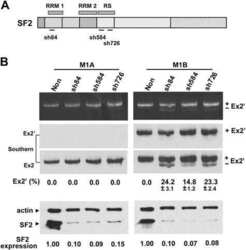
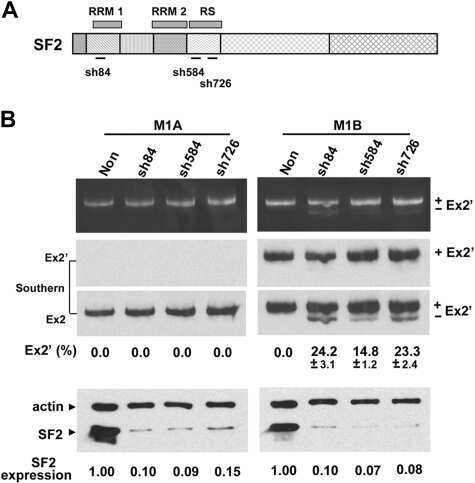
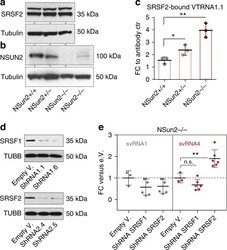
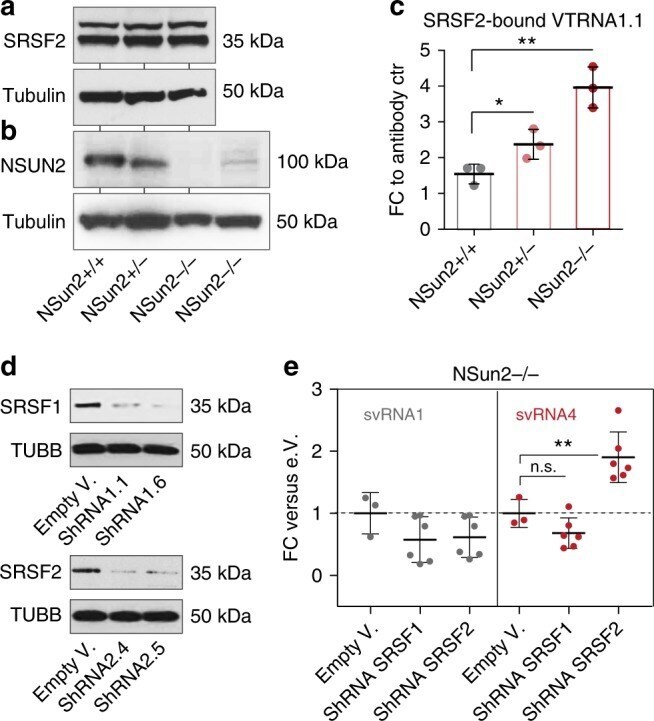
- Fig. 3 Methylation-guided VT-RNA1.1 processing is altered in the absence of SRSF2. a , b Western blot for endogenous SRSF2 ( a ) and NSUN2 ( b ) in NSUN2-expressing (+/+, +/-) and -lacking (-/-) human fibroblasts (from two patients). Tubulin served as a loading control. c qRT-PCR measuring SRSF2-bound VTRNA1.1 normalised to the control (ctr; Rabbit serum conjugated with Dynabeads) after recovering the pulled down RNA in the SRSF2 immunoprecipitation. d Western blot for SRSF1 and SRSF2 in NSUN2-/- human fibroblasts infected with shRNAs (1.1, 1.6, 2.4, 2.5). Tubulin served as a loading control. e Fold-change (FC) of svRNA1 and 4 abundances after knock-down of SRSF1 and 2, relative to NSUN2-/- cells infected with the empty vector (e.V.). Shown are the pooled values using the two shRNA constructs shown in ( d ). Error bars indicate s.d. ( n = 3-6 qRT-PCRs). ** p < 0.01 students t -test. Source data are provided as a Source Data file
- Submitted by
- Invitrogen Antibodies (provider)
- Main image
- Experimental details
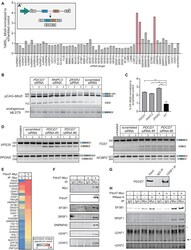
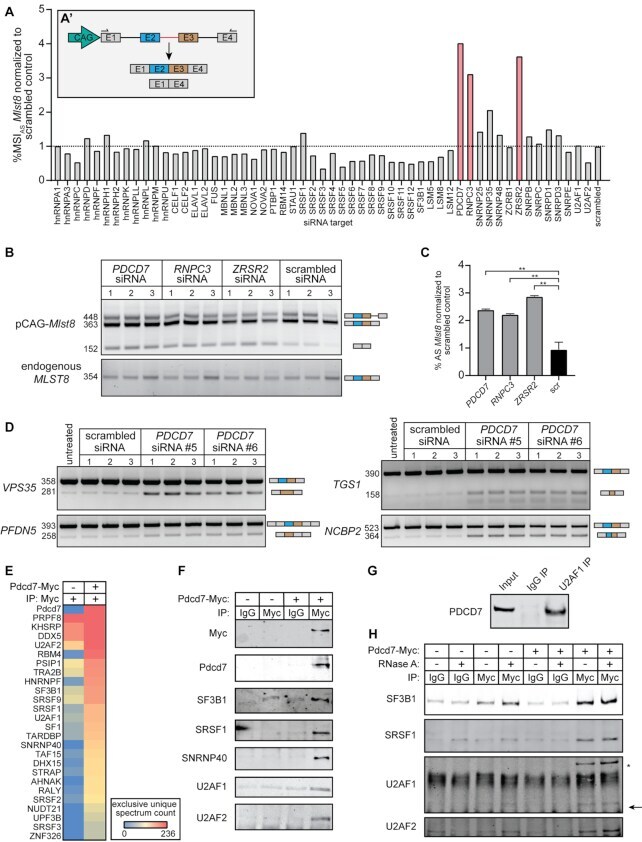
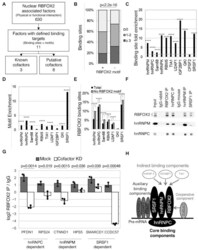
- Figure 3. U11-59K (PDCD7) mediates exon-definition interactions between the major and minor spliceosomes. (A) Bar graph showing the %MSI AS of the Mlst8 splicing reporter, in response to siRNA against splicing factors. Inset shows schematic of the Mlst8 splicing reporter and the resulting products. Agarose gel image of the Mlst8 splicing reporter RT-PCR products resulting from downregulation of minor spliceosome proteins (B) and quantification of the %MSI AS using ImageJ (C) . Significance was determined using one-way ANOVA, followed by the post-hoc Tukey test. (D) Agarose gel images of RT-PCR products resulting from AS around minor introns upon knockdown of PDCD7 in A549 cells. (E) Heatmap of the exclusive unique spectrum count of the Pdcd7-interacting proteins involved in splicing. (F) Immunoblot for major spliceosome proteins that immunoprecipitated with Pdcd7. (G) Immunoblot for PDCD7 after immunoprecipitation of endogenous U2AF1. (H) Immunoblot for major spliceosome proteins that immunoprecipitated with Pdcd7 with and without RNase A treatment. Arrow points at predicted molecular weight of U2AF1. Asterisk marks predicted molecular weight of U2AF2. * P < 0.05; ** P < 0.01. See also Supplementary Figures S4-S6 .
- Submitted by
- Invitrogen Antibodies (provider)
- Main image

- Experimental details
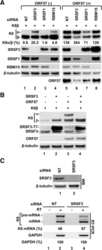
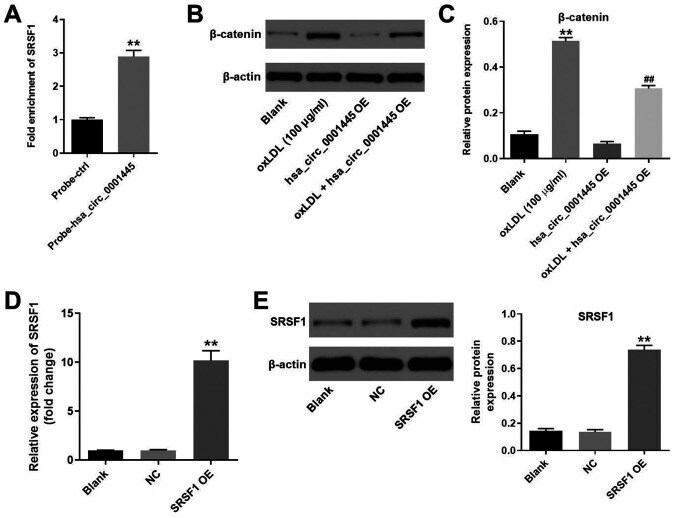
- Figure 4. hsa_circ_0001445 binds to SRSF1 and reverses oxLDL-induced activation of beta-catenin. (A) RNA pull-down assay was performed to investigate the association between hsa_circ_0001445 and SRSF1. (B) Protein levels of SRSF1 in HUVECs were tested by western blot analysis. (C) Relative expression levels were normalized to beta-actin. (D) HUVECs were transfected with pcDNA3.1 or pcDNA3.1-SRSF1. (E) Efficiency of cell transfection was tested by reverse transcription-quantitative PCR and western blot analysis. The relative expression levels were y normalized to beta-actin. **P
- Submitted by
- Invitrogen Antibodies (provider)
- Main image
- Experimental details
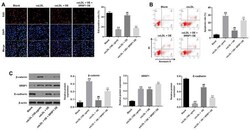
- Figure 5. hsa_circ_0001445 OE reverses oxLDL-induced inhibition of HUVEC growth via binding to SRSF1. (A) HUVECs were treated with oxLDL (100 ug/ml), hsa_circ_0001445 OE, oxLDL + hsa_circ_0001445 OE or oxLDL + hsa_circ_0001445 OE + SRSF1 OE. Then, the proliferation of HUVECs was tested by EdU staining. (B) Apoptosis of HUVECs was tested by flow cytometry. (C) Protein expression levels of beta-catenin, SRSF1 and E-cadherin in HUVECs were detected by western blot analysis. The relative expression levels were normalized to beta-actin. **P

- Submitted by
- Invitrogen Antibodies (provider)
- Main image
- Experimental details
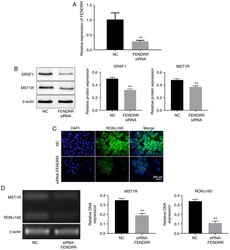
- Figure 3 Silencing of FENDRR suppresses the expression of MST1R and altered the distribution of RON Delta160 in Kato III cells. (A) Kato III cells were transfected with NC or FENDRR siRNA for 24 h. The efficiency of transfection was measured by reverse transcription-quantitative PCR. (B) The protein expression levels of MST1R and SRSF1 in Kato III cells were determined by western blot. The relative protein expression levels of MST1R and SRSF1 were quantified by normalizing to beta-actin. (C) The expression level of RON Delta160 in Kato III cells was determined by immunofluorescence staining. (D) Electrophoresis of MST1R, RON Delta160 and beta-actin polymerase chain reaction products on the agarose gel showed a unique band with expected sizes for each gene for Kato III cells. DNA expression was quantified by normalizing to beta-actin. FENDRR, FOXF1 adjacent non-coding developmental regulatory RNA; SRSF1, serine/arginine rich splicing factor 1; MST1R, macrophage stimulating 1 receptor; RON Delta160, recepteur d'origine nantais; NC, non-coding control; siRNA, short interfering RNA. ** P

- Submitted by
- Invitrogen Antibodies (provider)
- Main image
- Experimental details
- Figure 1. Identification of RBFOX2 binding cofactors. ( A ) Strategy for the identification of potential RBFOX2 cofactors. Proteins with predicted physical or functional association with RBFOX2 were identified from the literature (,,) and their overlap with RBFOX2 binding sites was examined. The number of known and newly identified (putative) cofactors are indicated at the bottom. ( B ) RBFOX2-interacting proteins differentially associate with RBFOX2-binding sites lacking canonical RBFOX2 motifs. The proportion of RBFOX2-binding sites containing (+, n = 31,344) or lacking (-, n = 42,360) RBFOX2-binding motifs that overlaps with the binding sites of zero, 1-2 or more than 2 interacting proteins is shown as bar graphs. The statistical significance of the difference between the binding sites containing or lacking an RBFOX2 binding motif was calculated using chi-squared test and the P -value indicated on top. ( C ) Binding of RBFOX2-interacting proteins is significantly enriched at RBFOX2-binding sites. The fold-enrichment of RBFOX2-interacting proteins in RBFOX2-binding sites was calculated in comparison with their distribution to the overlap with binding sites of non-splicing related RBPs and normalizing by the number of binding sites established for each RBP. The four asterisks indicate p< 2.2e-16 determined by chi-squared tests. ( D ) Identification of the binding motifs of RBFOX2-interacting proteins that are enriched in RBFOX2-binding sites. The fold-enrichment, of the bind

- Submitted by
- Invitrogen Antibodies (provider)
- Main image
- Experimental details
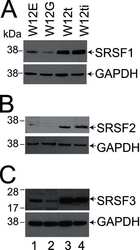
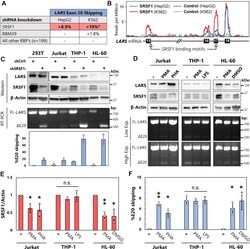
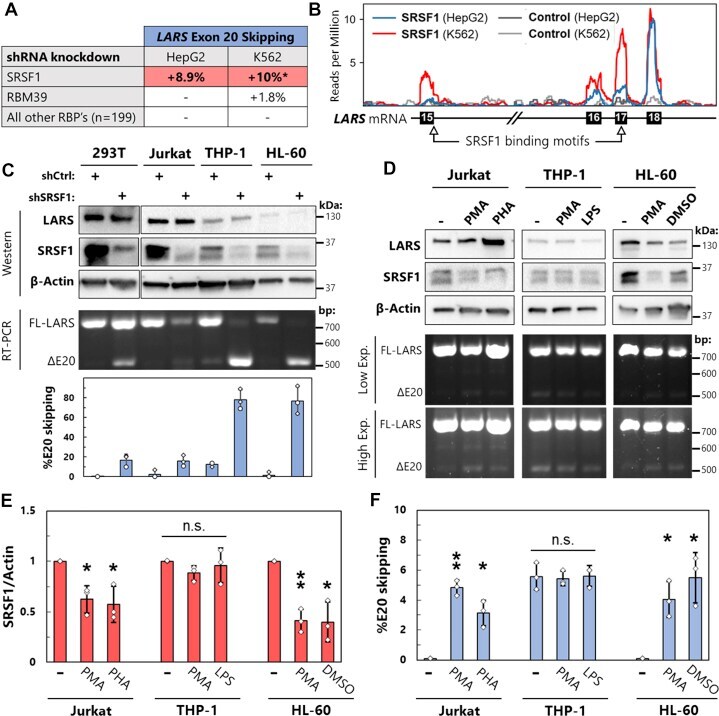
- Figure 4 SRSF1 regulates LSV3 expression in leukocytes. A , summary of data from ENCORE project, where shRNA knockdowns were performed on 201 RNA-binding proteins in HepG2 and K562 cells followed by RNAseq [26]. Alternative splicing events at LARS exon 20 were quantified using rMATS and are reported as changes in percent exon skipping. *Several additional alternative splicing events at LARS exon 20 not included in this % change. B , SRSF1 eCLIP binding data from ENCORE mapped onto LARS transcript. SRSF1 consensus binding motifs identified using ATtRACT database. C , HEK 293T epithelial cells, Jurkat T lymphocytes, THP-1 monocytes, and HL-60 promyeloblasts were treated with lentivirus containing either control or SRSF1-targeting shRNA followed by 2 days of puromycin selection. SRSF1 levels detected by Western blot, and LARS exon 20 splicing changes measured by RT-PCR. All quantifications are the result of three biological replicates. D , Jurkat cells were treated with phorbol 100 ng/ml phorbol 12-myristate 13-acetate (PMA) and 250 ng/ml ionomycin or 10 mug/ml of phytohemagglutinin (PHA) for 72 h, THP-1 cells with 100 ng/ml PMA for 72 h followed by 24 h with 100 ng/ml lipopolysaccharide (LPS), and HL-60 cells with 100 ng/ml PMA or 1.3% DMSO for 96 h. Agarose gel of RT-PCR products is shown at both low and high exposures (exp.). E and F , results from D as well as two independent biological replicates were quantified. SRSF1 protein level from western blots was normalized to beta
- Submitted by
- Invitrogen Antibodies (provider)
- Main image

- Experimental details
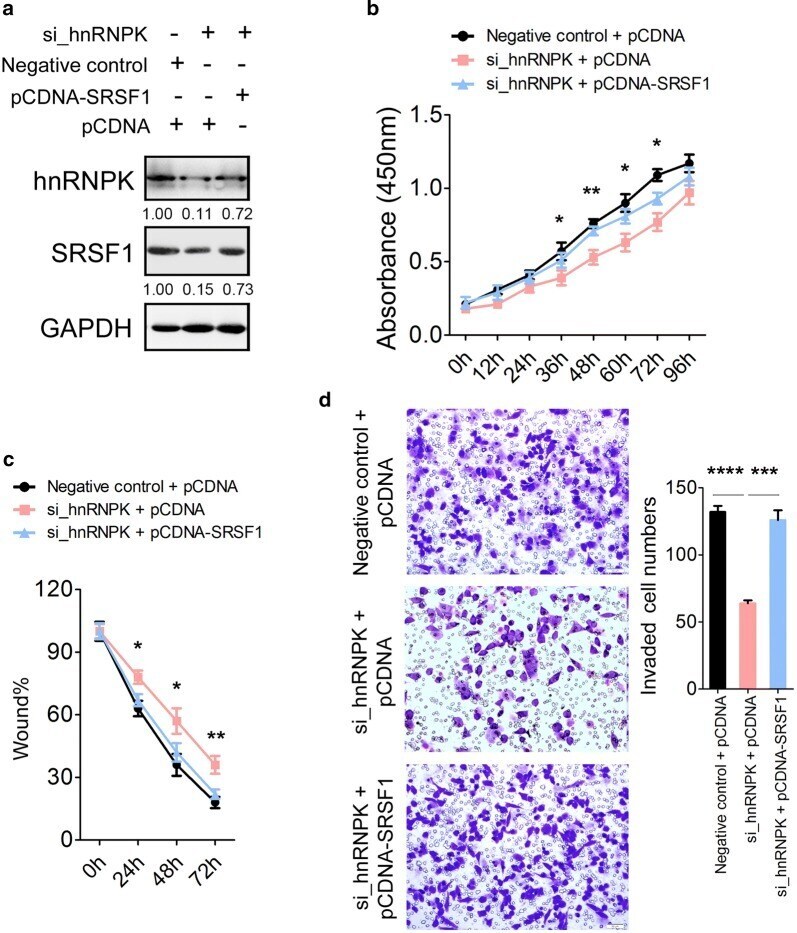
- Fig. 4 Rescue assays in MGC-803 cells. a Expression of hnRNPK and SRSF1 protein in MGC-803 cells after co-transfection with si_hnRNPK and pCDNA-SRSF1 by immunoblotting. b Cell proliferation assay of MGC-803 cells after transfected with si_hnRNPK and pCDNA-SRSF1 using CCK-8. c Wound healing assays of MGC-803 cells after transfected with si_hnRNPK and pCDNA-SRSF1. d Transwell analysis of MGC-803 cells after transfected with si_hnRNPK and pCDNA-SRSF1. The relative ratio of invasive cells per field is shown in the right. The data are presented as the mean +- SEM, and the error bars represent the standard deviation obtained from three independent experiments. * Represents si_hnRNPK + pCDNA compared with si_hnRNPK + pCDNA-SRSF1 in b and c . *p < 0.05; **p < 0.01; ***p < 0.001; ****p < 0.0001
- Submitted by
- Invitrogen Antibodies (provider)
- Main image
- Experimental details
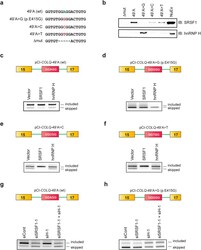
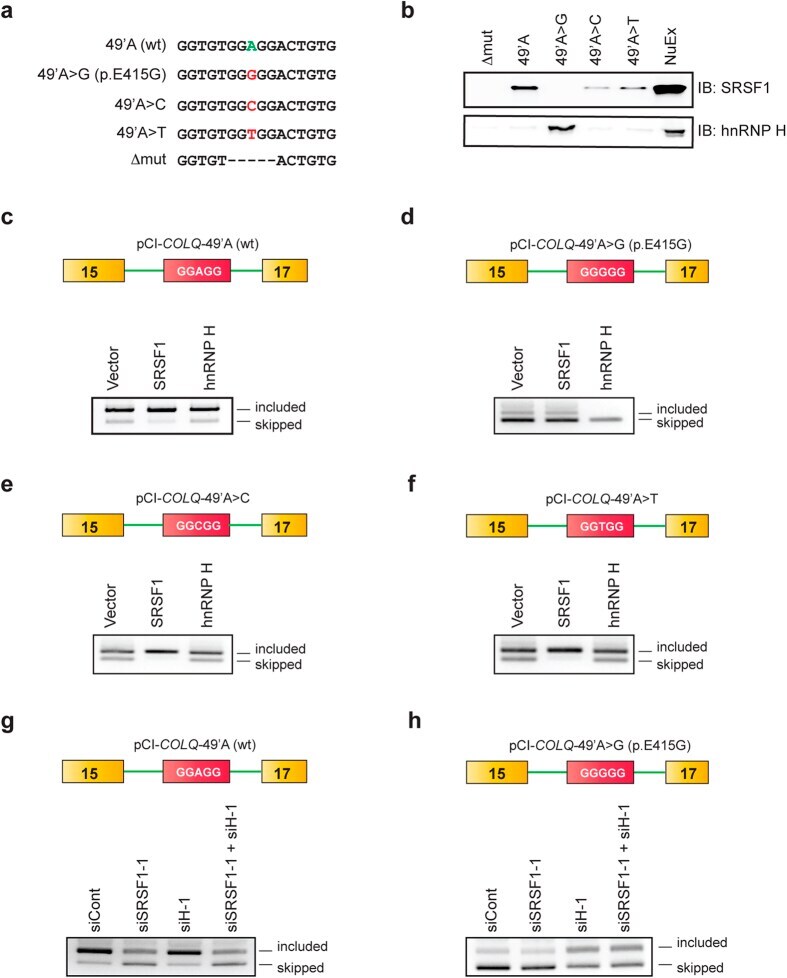
- Figure 4 Molecular basis of binding and functional regulation of SRSF1 and hnRNP H. ( a ) Sequences of RNA probes carrying wild-type nucleotide (A), the patient's mutation (G), and artificial mutations (C, T, and Deltamut) in COLQ exon 16. ( b ) Immunoblots (IB) of RNA affinity-purified proteins bound to each RNA probe. NuEX indicates 5% of the nuclear extract used in the assay. ( c - h ) RT-PCR of pCI- COLQ minigenes harboring the indicated motifs that are co-transfected with the indicated trans -factors ( c - f ) or siRNAs ( g , h ) in HeLa cells. Representative gel images of two independent experiments are shown.
- Submitted by
- Invitrogen Antibodies (provider)
- Main image
- Experimental details
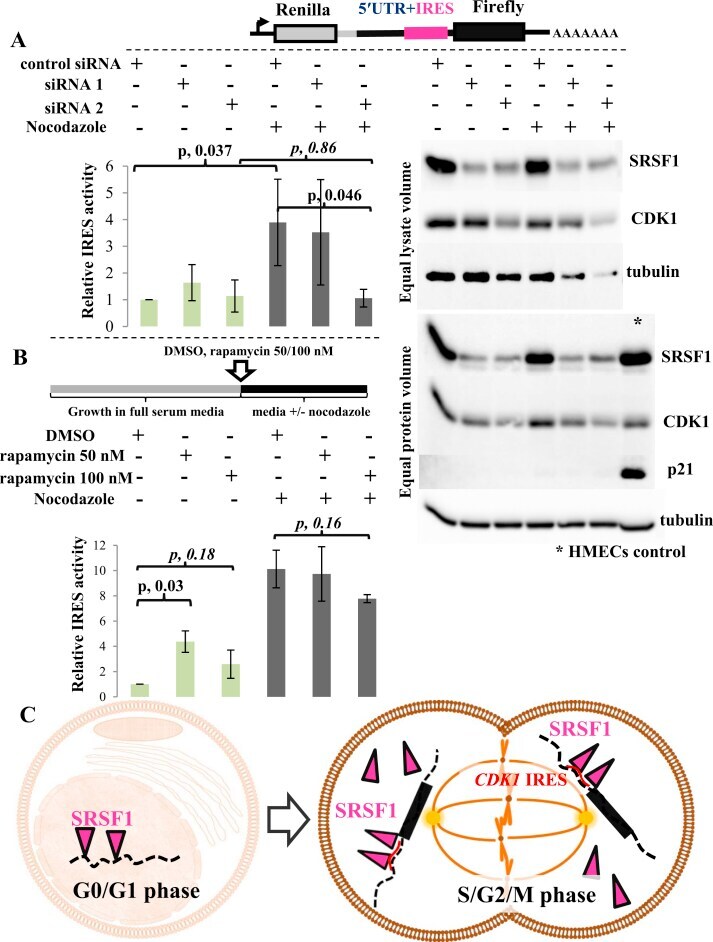
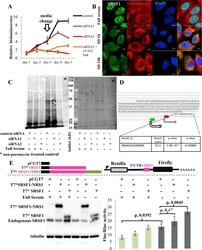
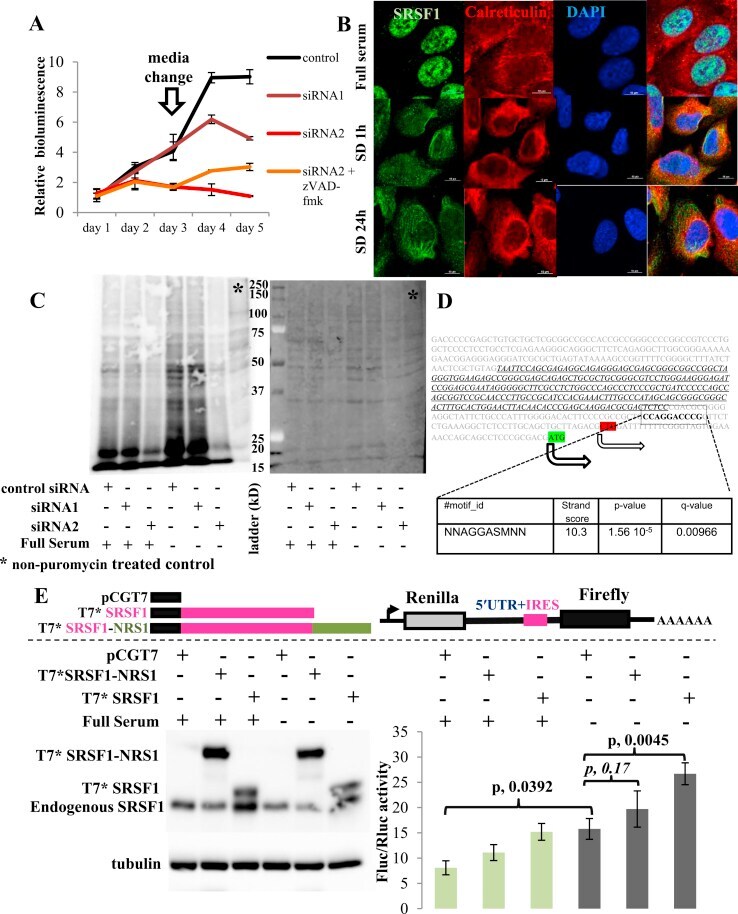
- Figure 5 The role of SRSF1 on translation in a representative ER(-) breast cancer cell line (SUM159PT). (A) Cell viability assay of SUM159PT cells. Downregulation of SRSF1 with siRNAs is associated with decreased viability of SUM159PT cells and apoptosis. Cell death is prevented with a pan-caspase inhibitor, zVAD-fmk (data presented as mean +- standard deviation, n = 3). (B) Immunofluorescent confocal microscopy of SRSF1 (green) and calreticulin (red, a component of the endoplasmic reticulum). Upon exposure to conditions of relative growth factor deprivation (serum-deprived conditions 1 h and 24 h; SD 1 h and SD 24 h, respectively), SRSF1 promptly translocates from the nucleus to the cytoplasm. Scale bars: 10 mum. (C) Puromycin incorporation assay (left panel) to capture global new protein synthesis. Ponceau S staining (right panel) serves as the control to confirm equal protein loading. Downregulation of SRSF1 is associated with downregulation of global new protein synthesis under both full-serum and serum-deprived (stress) conditions. (D) The MYC 5'UTR harbors an SRSF1-binding site (AGGASM) downstream and in proximity to its IRES (in italics and underlined). The 2 alternative translation initiation sites are illustrated. (E) Immunoblot for SRSF1 (left lower panel) and luciferase assay (right lower panel) of SUM159PT MYC IRES reporter cells. SUM159PT cells stably transfected with the MYC IRES bicistronic reporter vector (right upper panel) were transiently transfected with e
- Submitted by
- Invitrogen Antibodies (provider)
- Main image

- Experimental details
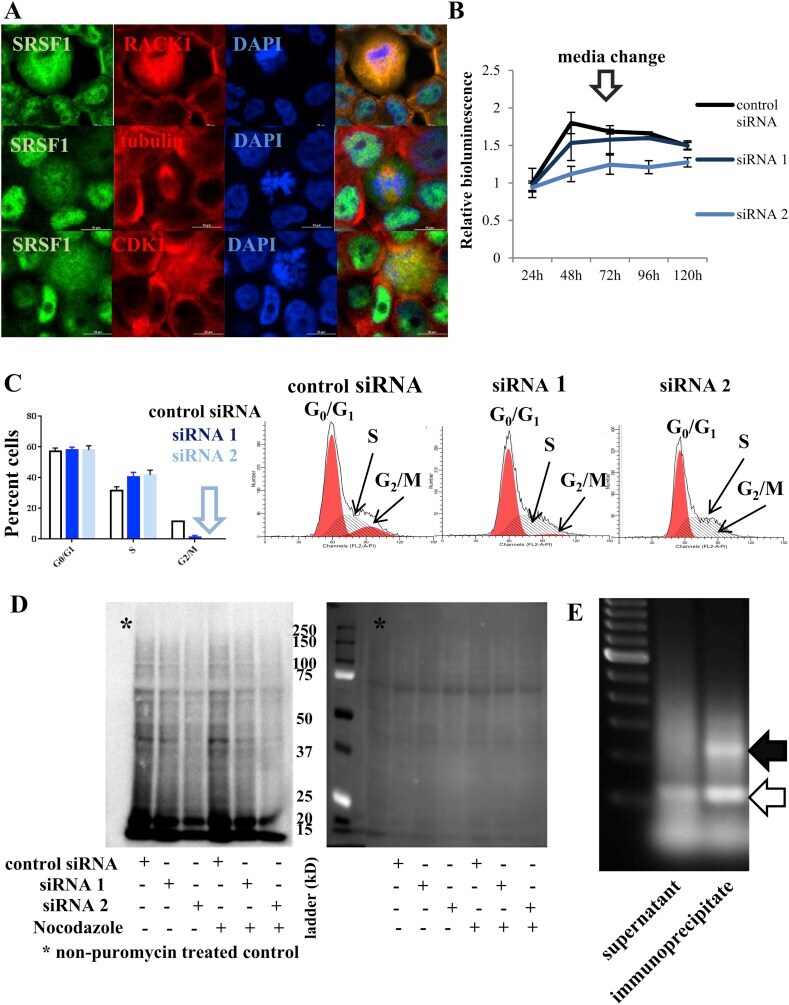
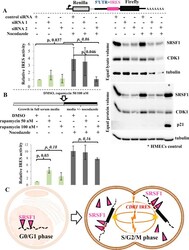
- Figure 7 The role of SRSF1 on translation in a representative ER(+) breast cancer cell line (T47D). (A) Immunofluorescence confocal microscopy of T47D cells. Images focused on dividing cells surrounded by nondividing cells. In T47D cells, SRSF1 is predominantly intranuclear. In dividing cells, however, SRSF1 localizes diffusely in the cytoplasm. SRSF1 colocalizes with RACK1 (a component of the IRES translation initiation complex, upper panel). Note the mitotic spindle (middle panel) and the diffusely localized CDK1 and SRSF1 in the dividing cells (lower panel). Scale bars: 10 mum. (B) Cell viability assay of T47D cells. siRNA-mediated downregulation of SRSF1 is associated with growth arrest in T47D cells (data presented as mean +- standard deviation, n = 3). (C) Cell cycle analysis by flow cytometry of T47D cells. siRNA mediated downregulation of SRSF1 in T47D cells is associated with an S-phase arrest (furthest left, data presented as mean +- standard deviation, n = 2). Note the nearly 0% cells in G2/M phase with siRNA2. A representative flow cytometry histogram is shown with each siRNA on the right. (D) Puromycin incorporation assay (left panel). Ponceau S staining (right panel) serves as control to confirm equal protein loading. Downregulation of SRSF1 is associated with a global downregulation in new protein synthesis especially when cells are synchronized to G2/M phase. (E) UV CLIP assay of the T47D CDK1 IRES reporter cells. The assay identifies the endogenous (empty arr
- Submitted by
- Invitrogen Antibodies (provider)
- Main image
- Experimental details
- Figure 8 During cell division, cytoplasmic SRSF1 operates as an ITAF for the CDK1 IRES. (A) Luciferase assay (left panel) and immunoblot for SRSF1, CDK1, and p21/CDKN1A (right panel) of T47D CDK1 IRES reporter cells. T47D cells were stably transfected with the CDK1 IRES bicistronic reporter vector (upper panel). Left panel. SRSF1 expression was downregulated with siRNAs and cells were asynchronous or synchronized with nocodozale (16 h) as indicated. siRNA mediated downregulation of SRSF1 was not associated with an apparent effect on the CDK1 IRES activity in an asynchronous T47D cell population. G2/M synchronization with nozodazole captures the cell cycle dependent upregulation of CDK1 IRES mediated translation. This upregulation is blocked by siRNA mediated downregulation of the SRSF1. IRES activity (ratio of Firefly:Renilla luciferase) is normalized to control siRNA-no nocodazole (asynchronous) condition. Data presented as mean +- standard deviation, n = 4; paired Student's t-test. Right panel. CDK1 protein levels change coordinately with SRSF1 especially when cells are synchronized to the G2/M phase. Two replicates of the same experiment are shown. Note the downregulation of tubulin with SRSF1 downregulation in the synchronized cells consistent with the fact that tubulin constitutes the main component of the mitotic spindle. The downregulation of SRSF1 does not impact p21 levels in T47D cells. (B) Luciferase assay of T47D CDK1 IRES reporter cells, asynchronous or synchroni