Explore
 Validate
 Learn
Learn Western blot
 Immunohistochemistry
 Flow cytometry
Antibody data
- Antibody Data
- Antigen structure
- References [1]
- Comments [0]
- Validations
- Immunohistochemistry [1]
- Other assay [2]
Submit
Validation data
Reference
Comment
Report error
- Product number
- MA1-086 - Provider product page

- Provider
- Invitrogen Antibodies
- Product name
- ATIC Monoclonal Antibody (F38 P7 H9)
- Antibody type
- Monoclonal
- Antigen
- Synthetic peptide
- Description
- MA1-086 detects the ATIC in human, rat, Xenopus, Drosophila, and mouse cells. MA1-086 has been successfully used in Western blot and immunohistochemistry (parrafin) procedures. By Western blot, this antibody detects a ~64.6 kDa protein. The MA1-086 immunogen is a synthetic peptide, conjugated to Ovalbumin, corresponding to residues A(583) H T N L R L F H H(592) of human ATIC..
- Reactivity
- Human, Mouse, Rat, Drosophila, Xenopus
- Host
- Mouse
- Isotype
- IgG
- Antibody clone number
- F38 P7 H9
- Vial size
- 100 μg
- Concentration
- 1 mg/mL
- Storage
- -20°C, Avoid Freeze/Thaw Cycles
Submitted references Cyclic Peptide Mimotopes for the Detection of Serum Anti-ATIC Autoantibody Biomarker in Hepato-Cellular Carcinoma.
Heo CK, Hwang HM, Lim WH, Lee HJ, Yoo JS, Lim KJ, Cho EW
International journal of molecular sciences 2020 Dec 19;21(24)
International journal of molecular sciences 2020 Dec 19;21(24)
No comments: Submit comment
Supportive validation
- Submitted by
- Invitrogen Antibodies (provider)
- Main image
- Experimental details
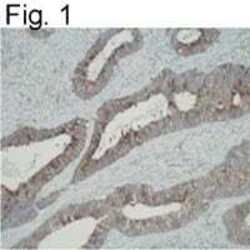
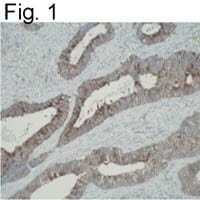
- Immunohistochemistry of ATIC expression in colon carcinoma using Product # MA1-086.
Supportive validation
- Submitted by
- Invitrogen Antibodies (provider)
- Main image

- Experimental details
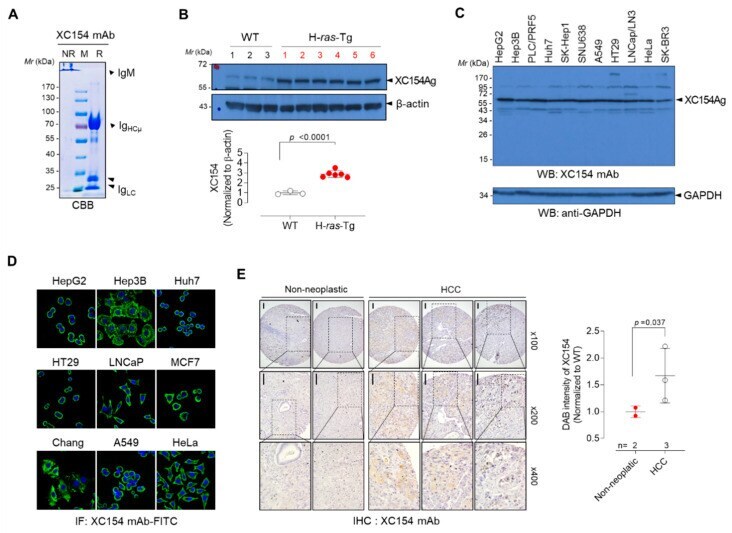
- Figure 1 Tumor-associated autoantibody XC154mAb was identified in human (HCC) model HBx-Tg mouse. ( A ) SDS-PAGE analysis of purified XC154 mAb. Purified XC154 mAb (10 mug) was treated with non-reducing (NR) or reducing (R) SDS-PAGE sample buffer and separated on 10% SDS-PAGE gel. Coomassie blue stained gel showed high molecular weight IgM and mu heavy chain with molecular weight of 72 kDa. M: molecular weight marker. ( B ) The expression of XC154 Ag in liver tissues of H- ras 12V-Tg mice. The liver tissue lysates (50 mug) of wild-type mice ( n = 3) or tumor-bearing H- ras 12V-Tg mice ( n = 6) were separated on 10% SDS-PAGE and Western Blots were probed with XC154 mAb. Band intensities were quantified by Image J software and the values were normalized to beta-actin. ( C ) Expression of XC154 antigen in various human tumor cell lines (cell lysates 40 mug) shown by Western blotting. GAPDH was served as an internal control. Arrows indicate the XC154 antigen. ( D ) Immunofluorescent staining of tumor cell lines with XC154 mAb (0.5 mug/mL) and FITC-labeled anti-mouse IgG. ( E ) Immunohistochemical staining of human liver tissues (non-neoplatic or HCC tissue) microarray with XC154 mAb (0.5 mug/mL). DAB intensities were quantified by Image J software and the relative values were plotted. Statistical significance was determined by two-tailed Student's t -test.
- Submitted by
- Invitrogen Antibodies (provider)
- Main image

- Experimental details
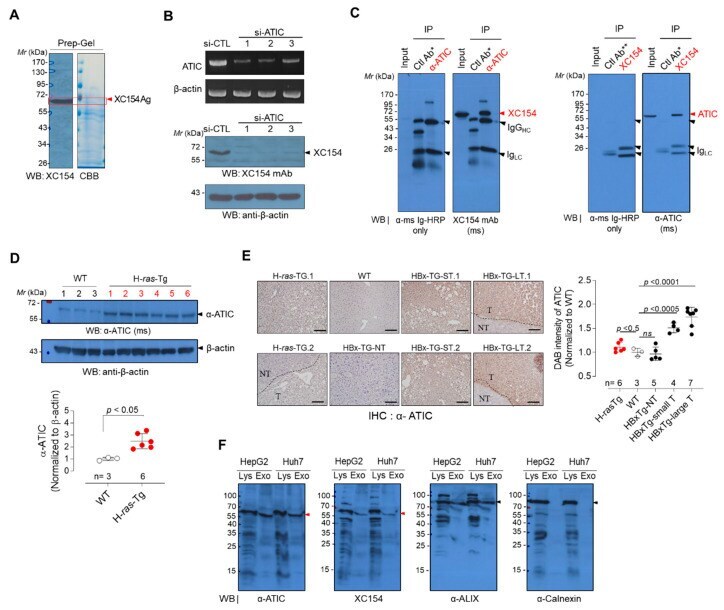
- Figure 2 The target antigen of XC154 mAb was oncogenic ATIC. ( A ) Preparative 10% SDS-PAGE to isolate XC154 antigen and in-gel digestion for the mass spectrometric protein identification. The protein band containing XC154 antigen, which was confirmed by Western blotting, was excised (indicated by the red arrow) and in-gel digested. Proteins identified by mass spectrometric analysis were listed in Table 1 . ( B ) The validation of XC154 antigen as ATIC. HepG2 cells were transfected with si-ATIC and their cell lysates were analyzed by Western blotting with XC154 mAb. beta-Actin was used as an internal control. ( C ) Immunoprecipitation analysis for the verification of XC154 antigen as ATIC. Red arrows indicate XC154 Ag or ATIC. ( D ) The expression of ATIC in liver tissues of H- ras12V -Tg mice. Blots were probed with commercial anti-ATIC antibody. ( E ) Immunohistochemical analysis of ATIC in liver tissues of HCC model mice. Liver tissues from wild type control mice (Non-Tg: WT) were also stained. NT: non-tumor, T: tumor region, H- ras12V -Tg ( n = 6), Non-Tg ( n = 3), HBx-Tg-nonT: HBx-transgenic mouse without tumor ( n = 5), HBx-Tg-ST: HBx-transgenic mouse with small tumor ( n = 4), HBx-Tg-LT: HBx-transgenic mouse with large tumor ( n = 7). Representative images were shown (All staining images were shown in Supplementary Figure S2 ). ( F ) ATIC in exosomes purified from hepatoma cell cultured media (HepG2 and Huh7 cells; 35 mug) analyzed by Western blotting. A well-known exo