Explore
 Validate
 Learn
LearnPA5-31650
antibody from Invitrogen Antibodies
Targeting: ZC3HAV1
ARTD13, FLB6421, FLJ13288, MGC48898, PARP13, ZAP, ZC3H2, ZC3HDC2
 Western blot
 Immunocytochemistry
 Immunoprecipitation
Antibody data
- Antibody Data
- Antigen structure
- References [5]
- Comments [0]
- Validations
- Immunocytochemistry [4]
- Immunohistochemistry [2]
- Other assay [17]
Submit
Validation data
Reference
Comment
Report error
- Product number
- PA5-31650 - Provider product page

- Provider
- Invitrogen Antibodies
- Product name
- ZC3HAV1 Polyclonal Antibody
- Antibody type
- Polyclonal
- Antigen
- Recombinant full-length protein
- Description
- Recommended positive controls: 293T, A431, HeLa, HepG2. Store product as a concentrated solution. Centrifuge briefly prior to opening the vial.
- Reactivity
- Human
- Host
- Rabbit
- Isotype
- IgG
- Vial size
- 100 μL
- Concentration
- 1.35 mg/mL
- Storage
- Store at 4°C short term. For long term storage, store at -20°C, avoiding freeze/thaw cycles.
Submitted references N(6)-methyladenosine-binding protein YTHDF1 suppresses EBV replication and promotes EBV RNA decay.
Human cytomegalovirus evades ZAP detection by suppressing CpG dinucleotides in the major immediate early 1 gene.
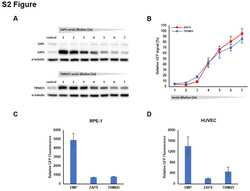
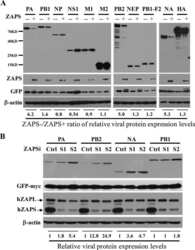
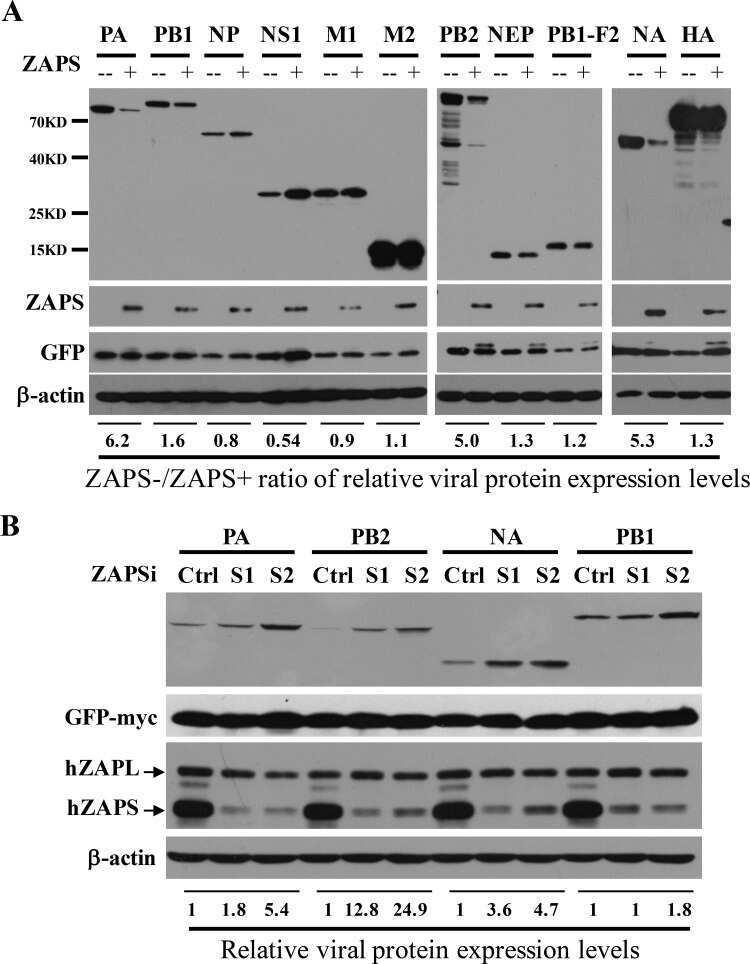
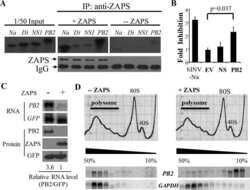
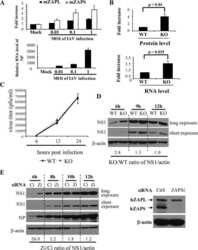
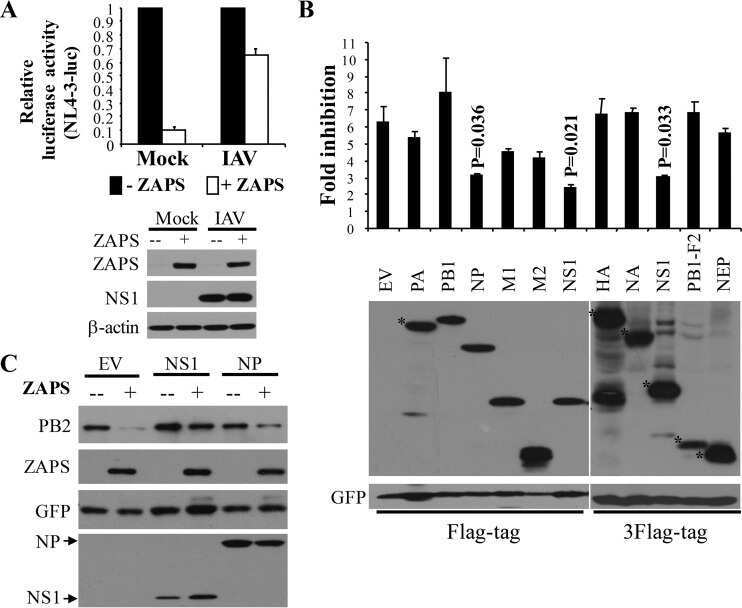
The Short Form of the Zinc Finger Antiviral Protein Inhibits Influenza A Virus Protein Expression and Is Antagonized by the Virus-Encoded NS1.
Interferon alpha antagonizes the anti-hepatoma activity of the oncolytic virus M1 by stimulating anti-viral immunity.
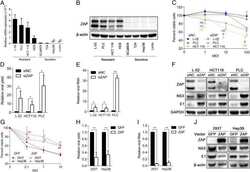
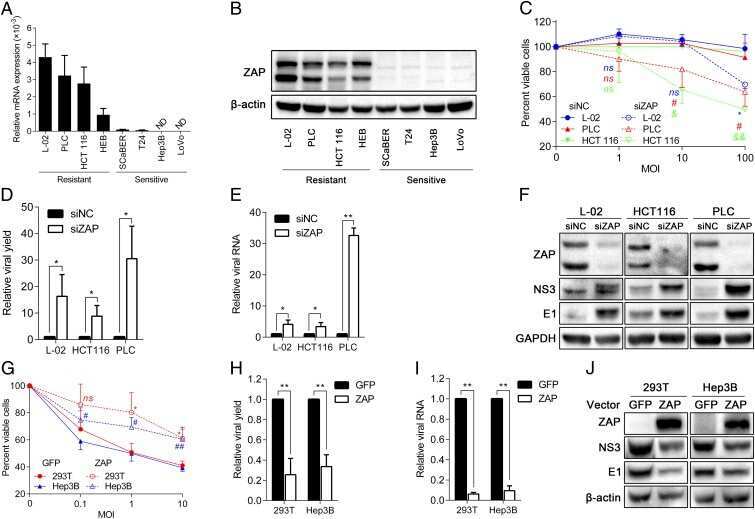
Identification and characterization of alphavirus M1 as a selective oncolytic virus targeting ZAP-defective human cancers.
Xia TL, Li X, Wang X, Zhu YJ, Zhang H, Cheng W, Chen ML, Ye Y, Li Y, Zhang A, Dai DL, Zhu QY, Yuan L, Zheng J, Huang H, Chen SQ, Xiao ZW, Wang HB, Roy G, Zhong Q, Lin D, Zeng YX, Wang J, Zhao B, Gewurz BE, Chen J, Zuo Z, Zeng MS
EMBO reports 2021 Apr 7;22(4):e50128
EMBO reports 2021 Apr 7;22(4):e50128
Human cytomegalovirus evades ZAP detection by suppressing CpG dinucleotides in the major immediate early 1 gene.
Lin YT, Chiweshe S, McCormick D, Raper A, Wickenhagen A, DeFillipis V, Gaunt E, Simmonds P, Wilson SJ, Grey F
PLoS pathogens 2020 Sep;16(9):e1008844
PLoS pathogens 2020 Sep;16(9):e1008844
The Short Form of the Zinc Finger Antiviral Protein Inhibits Influenza A Virus Protein Expression and Is Antagonized by the Virus-Encoded NS1.
Tang Q, Wang X, Gao G
Journal of virology 2017 Jan 15;91(2)
Journal of virology 2017 Jan 15;91(2)
Interferon alpha antagonizes the anti-hepatoma activity of the oncolytic virus M1 by stimulating anti-viral immunity.
Ying L, Cheng H, Xiong XW, Yuan L, Peng ZH, Wen ZW, Ka LJ, Xiao X, Jing C, Qian TY, Liang GZ, Mei YG, Bo ZW, Liang P
Oncotarget 2017 Apr 11;8(15):24694-24705
Oncotarget 2017 Apr 11;8(15):24694-24705
Identification and characterization of alphavirus M1 as a selective oncolytic virus targeting ZAP-defective human cancers.
Lin Y, Zhang H, Liang J, Li K, Zhu W, Fu L, Wang F, Zheng X, Shi H, Wu S, Xiao X, Chen L, Tang L, Yan M, Yang X, Tan Y, Qiu P, Huang Y, Yin W, Su X, Hu H, Hu J, Yan G
Proceedings of the National Academy of Sciences of the United States of America 2014 Oct 21;111(42):E4504-12
Proceedings of the National Academy of Sciences of the United States of America 2014 Oct 21;111(42):E4504-12
No comments: Submit comment
Supportive validation
- Submitted by
- Invitrogen Antibodies (provider)
- Main image

- Experimental details
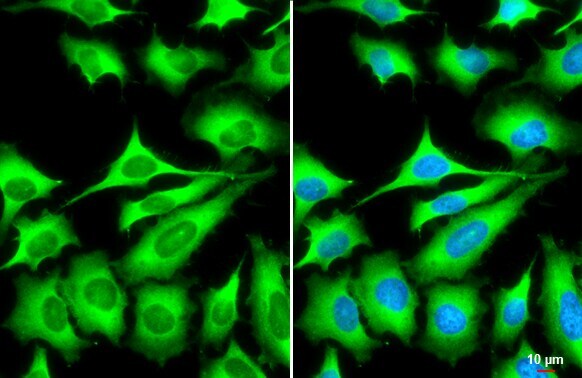
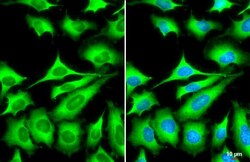
- Immunocytochemistry-Immunofluorescence analysis of ZC3HAV1 was performed in HeLa cells fixed in 4% paraformaldehyde at RT for 15 min. Green: ZC3HAV1 Polyclonal Antibody (Product # PA5-31650) diluted at 1:1000. Blue: Hoechst 33342 staining. Scale bar = 10 µm.

- Submitted by
- Invitrogen Antibodies (provider)
- Main image

- Experimental details
- ZC3HAV1 Polyclonal Antibody detects ZC3HAV1 protein at cytoplasm by immunofluorescent analysis. Sample: HeLa cells were fixed in 4% paraformaldehyde at RT for 15 min. Green: ZC3HAV1 stained by ZC3HAV1 Polyclonal Antibody (Product # PA5-31650) diluted at 1:1,000. Blue: Fluoroshield with DAPI . Scale bar= 10 µm.
- Submitted by
- Invitrogen Antibodies (provider)
- Main image
- Experimental details
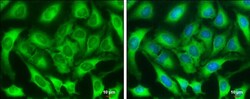
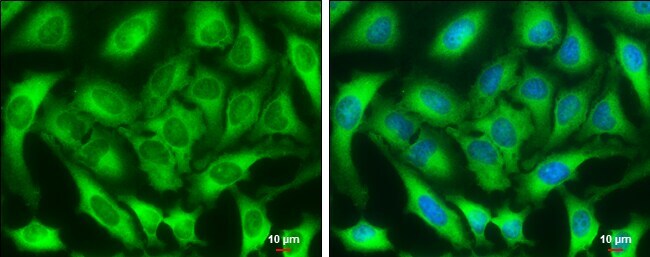
- Immunocytochemistry-Immunofluorescence analysis of ZC3HAV1 was performed in HeLa cells fixed in 4% paraformaldehyde at RT for 15 min. Green: ZC3HAV1 Polyclonal Antibody (Product # PA5-31650) diluted at 1:1000. Blue: Hoechst 33342 staining. Scale bar = 10 µm.
- Submitted by
- Invitrogen Antibodies (provider)
- Main image
- Experimental details
- ZC3HAV1 Polyclonal Antibody detects ZC3HAV1 protein at cytoplasm by immunofluorescent analysis. Sample: HeLa cells were fixed in 4% paraformaldehyde at RT for 15 min. Green: ZC3HAV1 stained by ZC3HAV1 Polyclonal Antibody (Product # PA5-31650) diluted at 1:1,000. Blue: Fluoroshield with DAPI . Scale bar= 10 µm.

Supportive validation
- Submitted by
- Invitrogen Antibodies (provider)
- Main image
- Experimental details
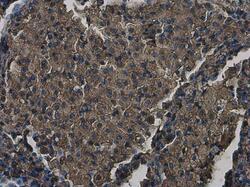
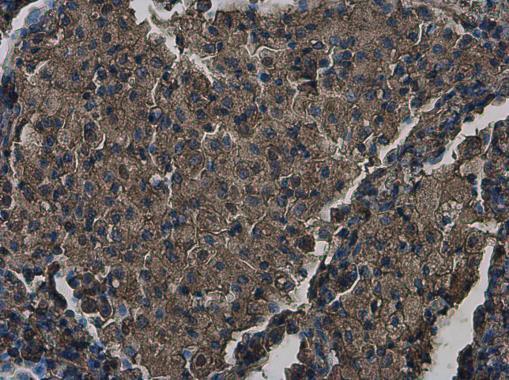
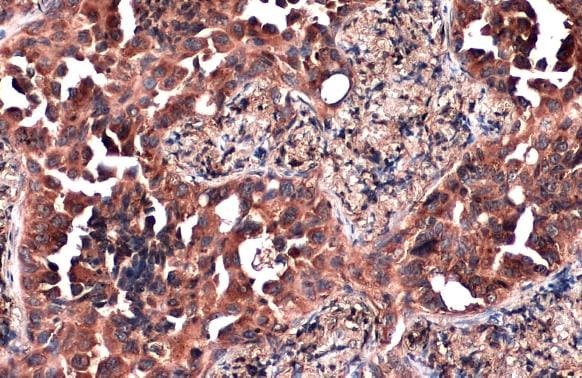
- Immunohistochemistry (Paraffin) analysis of ZC3HAV1 was performed in paraffin-embedded human lung cancer tissue using ZC3HAV1 Polyclonal Antibody (Product # PA5-31650) at a dilution of 1:500.
- Submitted by
- Invitrogen Antibodies (provider)
- Main image

- Experimental details
- ZC3HAV1 Polyclonal Antibody detects ZC3HAV1 protein at cytoplasm by immunohistochemical analysis. Sample: Paraffin-embedded human lung cancer. ZC3HAV1 stained by ZC3HAV1 Polyclonal Antibody (Product # PA5-31650) diluted at 1:500. Antigen Retrieval: Citrate buffer, pH 6.0, 15 min.
Supportive validation
- Submitted by
- Invitrogen Antibodies (provider)
- Main image
- Experimental details
- NULL
- Submitted by
- Invitrogen Antibodies (provider)
- Main image
- Experimental details
- NULL
- Submitted by
- Invitrogen Antibodies (provider)
- Main image
- Experimental details
- NULL
- Submitted by
- Invitrogen Antibodies (provider)
- Main image
- Experimental details
- NULL
- Submitted by
- Invitrogen Antibodies (provider)
- Main image
- Experimental details
- NULL
- Submitted by
- Invitrogen Antibodies (provider)
- Main image
- Experimental details
- NULL

- Submitted by
- Invitrogen Antibodies (provider)
- Main image
- Experimental details
- NULL

- Submitted by
- Invitrogen Antibodies (provider)
- Main image

- Experimental details
- NULL
- Submitted by
- Invitrogen Antibodies (provider)
- Main image

- Experimental details
- NULL

- Submitted by
- Invitrogen Antibodies (provider)
- Main image
- Experimental details
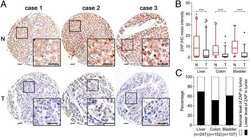
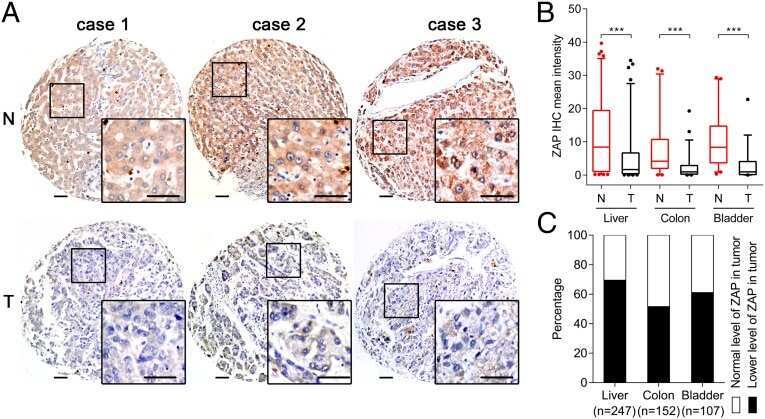
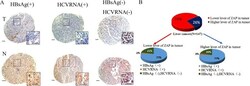
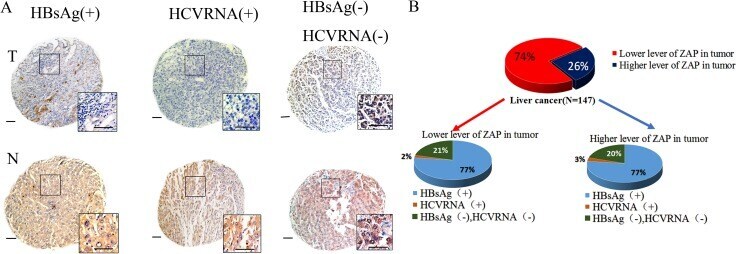
- Figure 6 Clinical investigation on patients with negative ZAP and positive HBV/HCV ( A ) Representative cores of ZAP immunostaining in TMA. Higher magnification shown inthe box. (Scale bars: 50 mum.) N, nonneoplastic; T, tumor. ( B ) Statistical analysis of the expression of ZAP of tumor and serum HBsAg and HCVRNA of patients.
- Submitted by
- Invitrogen Antibodies (provider)
- Main image
- Experimental details
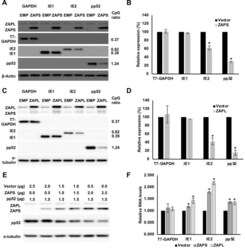
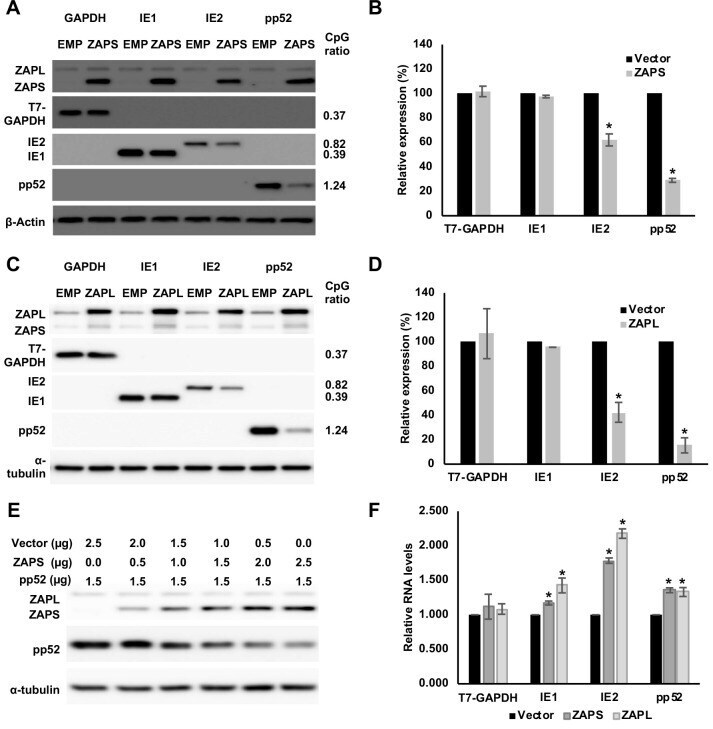
- Fig 4 ZAP targets HCMV genes with high CpG dinucleotide frequencies. (A) 293T cells were co-transfected with plasmids expressing ZAPS (A), ZAPL (C) or a control empty vector (EMP) with plasmids expressing HCMV genes with varied CpG dinucleotide frequencies (IE1, IE2 and pp52). A plasmid expressing T7-tagged GAPDH was included as a control with low CpG sequence content. CpG frequencies are indicated beside each gel. Expression levels of HCMV genes and T7-GAPDH were determined by western blot analysis. Expression levels for proteins co-expressed with ZAPS (B) and ZAPL (D) were quantified using Image J software and normalized to the empty construct control samples (N = 2). (E) 293T cells were transfected with plasmids expressing ZAPS and pp52 at concentrations shown. Total concentration of transfected DNA was normalized using empty vector. Western blot analysis shows pp52 expression levels versus ZAP expression levels. (F) Total RNA was harvested from the same samples used for western blot analysis in (A) and (C) with transcript levels determined by RT-qPCR. N = 2, * p-value < 0.05 based on Student's t-test.
- Submitted by
- Invitrogen Antibodies (provider)
- Main image

- Experimental details
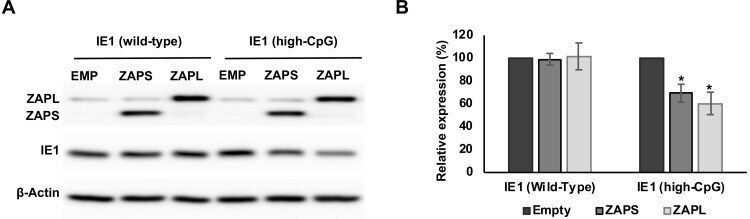
- Fig 5 Increasing CpG content in IE1 results in inhibition by ZAP. The CpG content of IE1 was artificially increased by introducing synonymous mutations into exon 4 of the gene and cloned into an expression vector. 293T cells were co-transfected with plasmids expressing ZAPS or ZAPL or an empty control vector (EMP) and total protein harvested. (A) Western blot analysis shows levels of IE1 WT versus IE1 high CpG following expression of ZAPS or ZAPL. (B) Expression levels for proteins co-expressed with ZAPS and ZAPL were quantified using Image J software and normalized to the empty construct control samples. N = 3, * p-value < 0.05 based on Student's t-test.
- Submitted by
- Invitrogen Antibodies (provider)
- Main image
- Experimental details
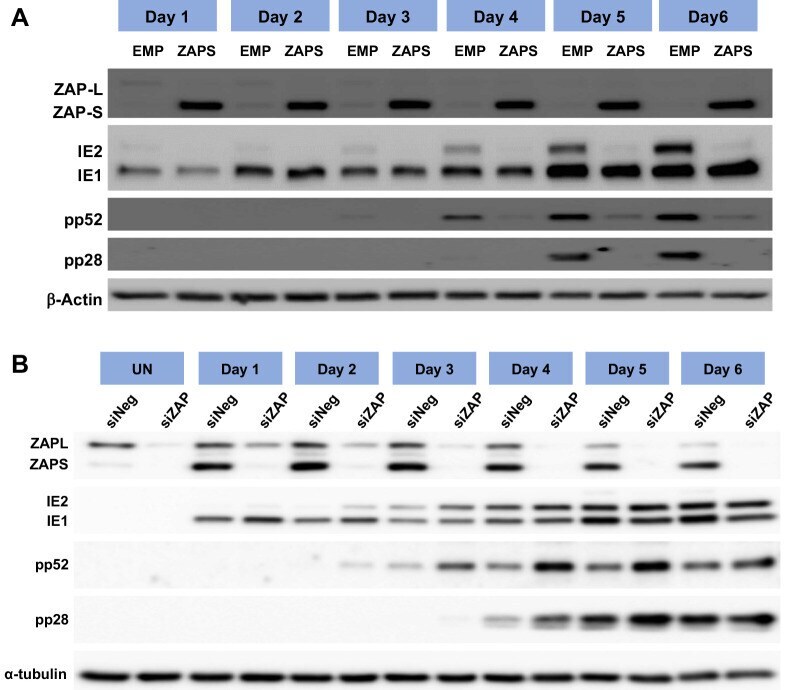
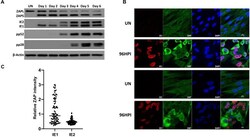
- Fig 6 IE1 expression is not affected by ZAP overexpression. (A) Wild type (WT) fibroblast cells were transduced with ZAPS or empty vector control lentiviruses (EMP) and infected with TB40E-GFP 48 hours post transduction. Total protein lysates were harvested every 24 hours and the expression levels of the viral proteins of each major kinetic class of HCMV were determined by western blot analysis. The result demonstrates that ZAPS overexpression leads to significant reduction of IE2 expression and downstream early and late viral proteins, whereas IE1 expression remains unaffected. (B) Fibroblast cells were transfected with a negative control siRNA (siNeg) or an siRNA against ZAP (siZAP) and infected two days post transduction. Total protein was harvested at the indicated time points and analysed by western blot analysis for viral protein expression.
- Submitted by
- Invitrogen Antibodies (provider)
- Main image
- Experimental details
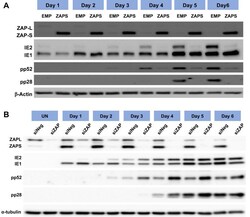
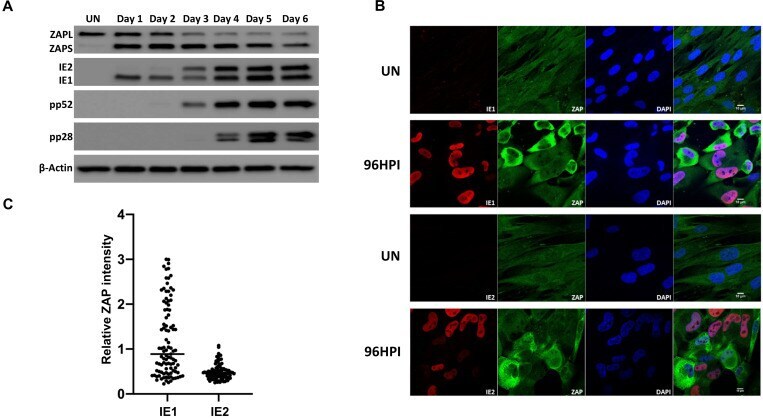
- Fig 7 ZAP expression is reduced in IE2 positive cells. (A) Wild type fibroblast cells were infected with TB40E-GFP at an MOI of 3. Total protein lysates were harvested every 24 hours and the expression levels of ZAP and the viral proteins of each major kinetic class of HCMV were determined by western blot analysis. It demonstrates that ZAPS expression was robustly induced 24 hours post infection and remained higher than in uninfected cells throughout the course of the infection. (B) Wild type fibroblast cells were infected with HCMV 96 hours post infection, cells were fixed and stained with ZAP along with either IE1 or IE2. ZAP expression levels in IE1 or IE2 expressing cells were determined by confocal microscopy. Nuclei are stained with DAPI. (C) ZAP expression levels in 100 IE1-expressing cells and 100 IE2-expressing cells at 96 HPI were quantified and normalized to ZAP expression levels in uninfected cells from the confocal images using ZEN blue software.
- Submitted by
- Invitrogen Antibodies (provider)
- Main image
- Experimental details
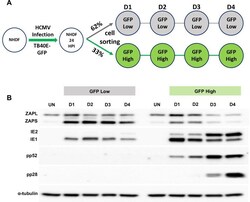
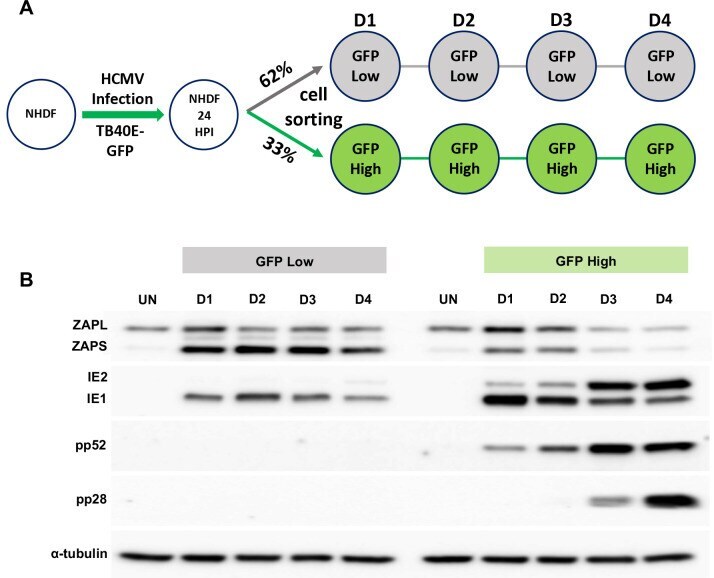
- Fig 8 High ZAP expression correlates with failure in HCMV acute replication. (A) Diagram of cell sorting following TB40E-GFP infection. 24 hours post infection, fibroblast cells were sorted into low and high GFP expressing populations, and then re-seeded. Total protein lysates were harvested at the indicated time points. (B) Western blot analysis shows that the low GFP expressing population correlated with high levels of ZAPS expression and a failure in progression of virus replication, although IE1 expression can still be detected. In contrast, the high GFP expressing population correlated with low ZAPS expression and high levels of viral protein production, consistent with successful virus replication.
- Submitted by
- Invitrogen Antibodies (provider)
- Main image

- Experimental details
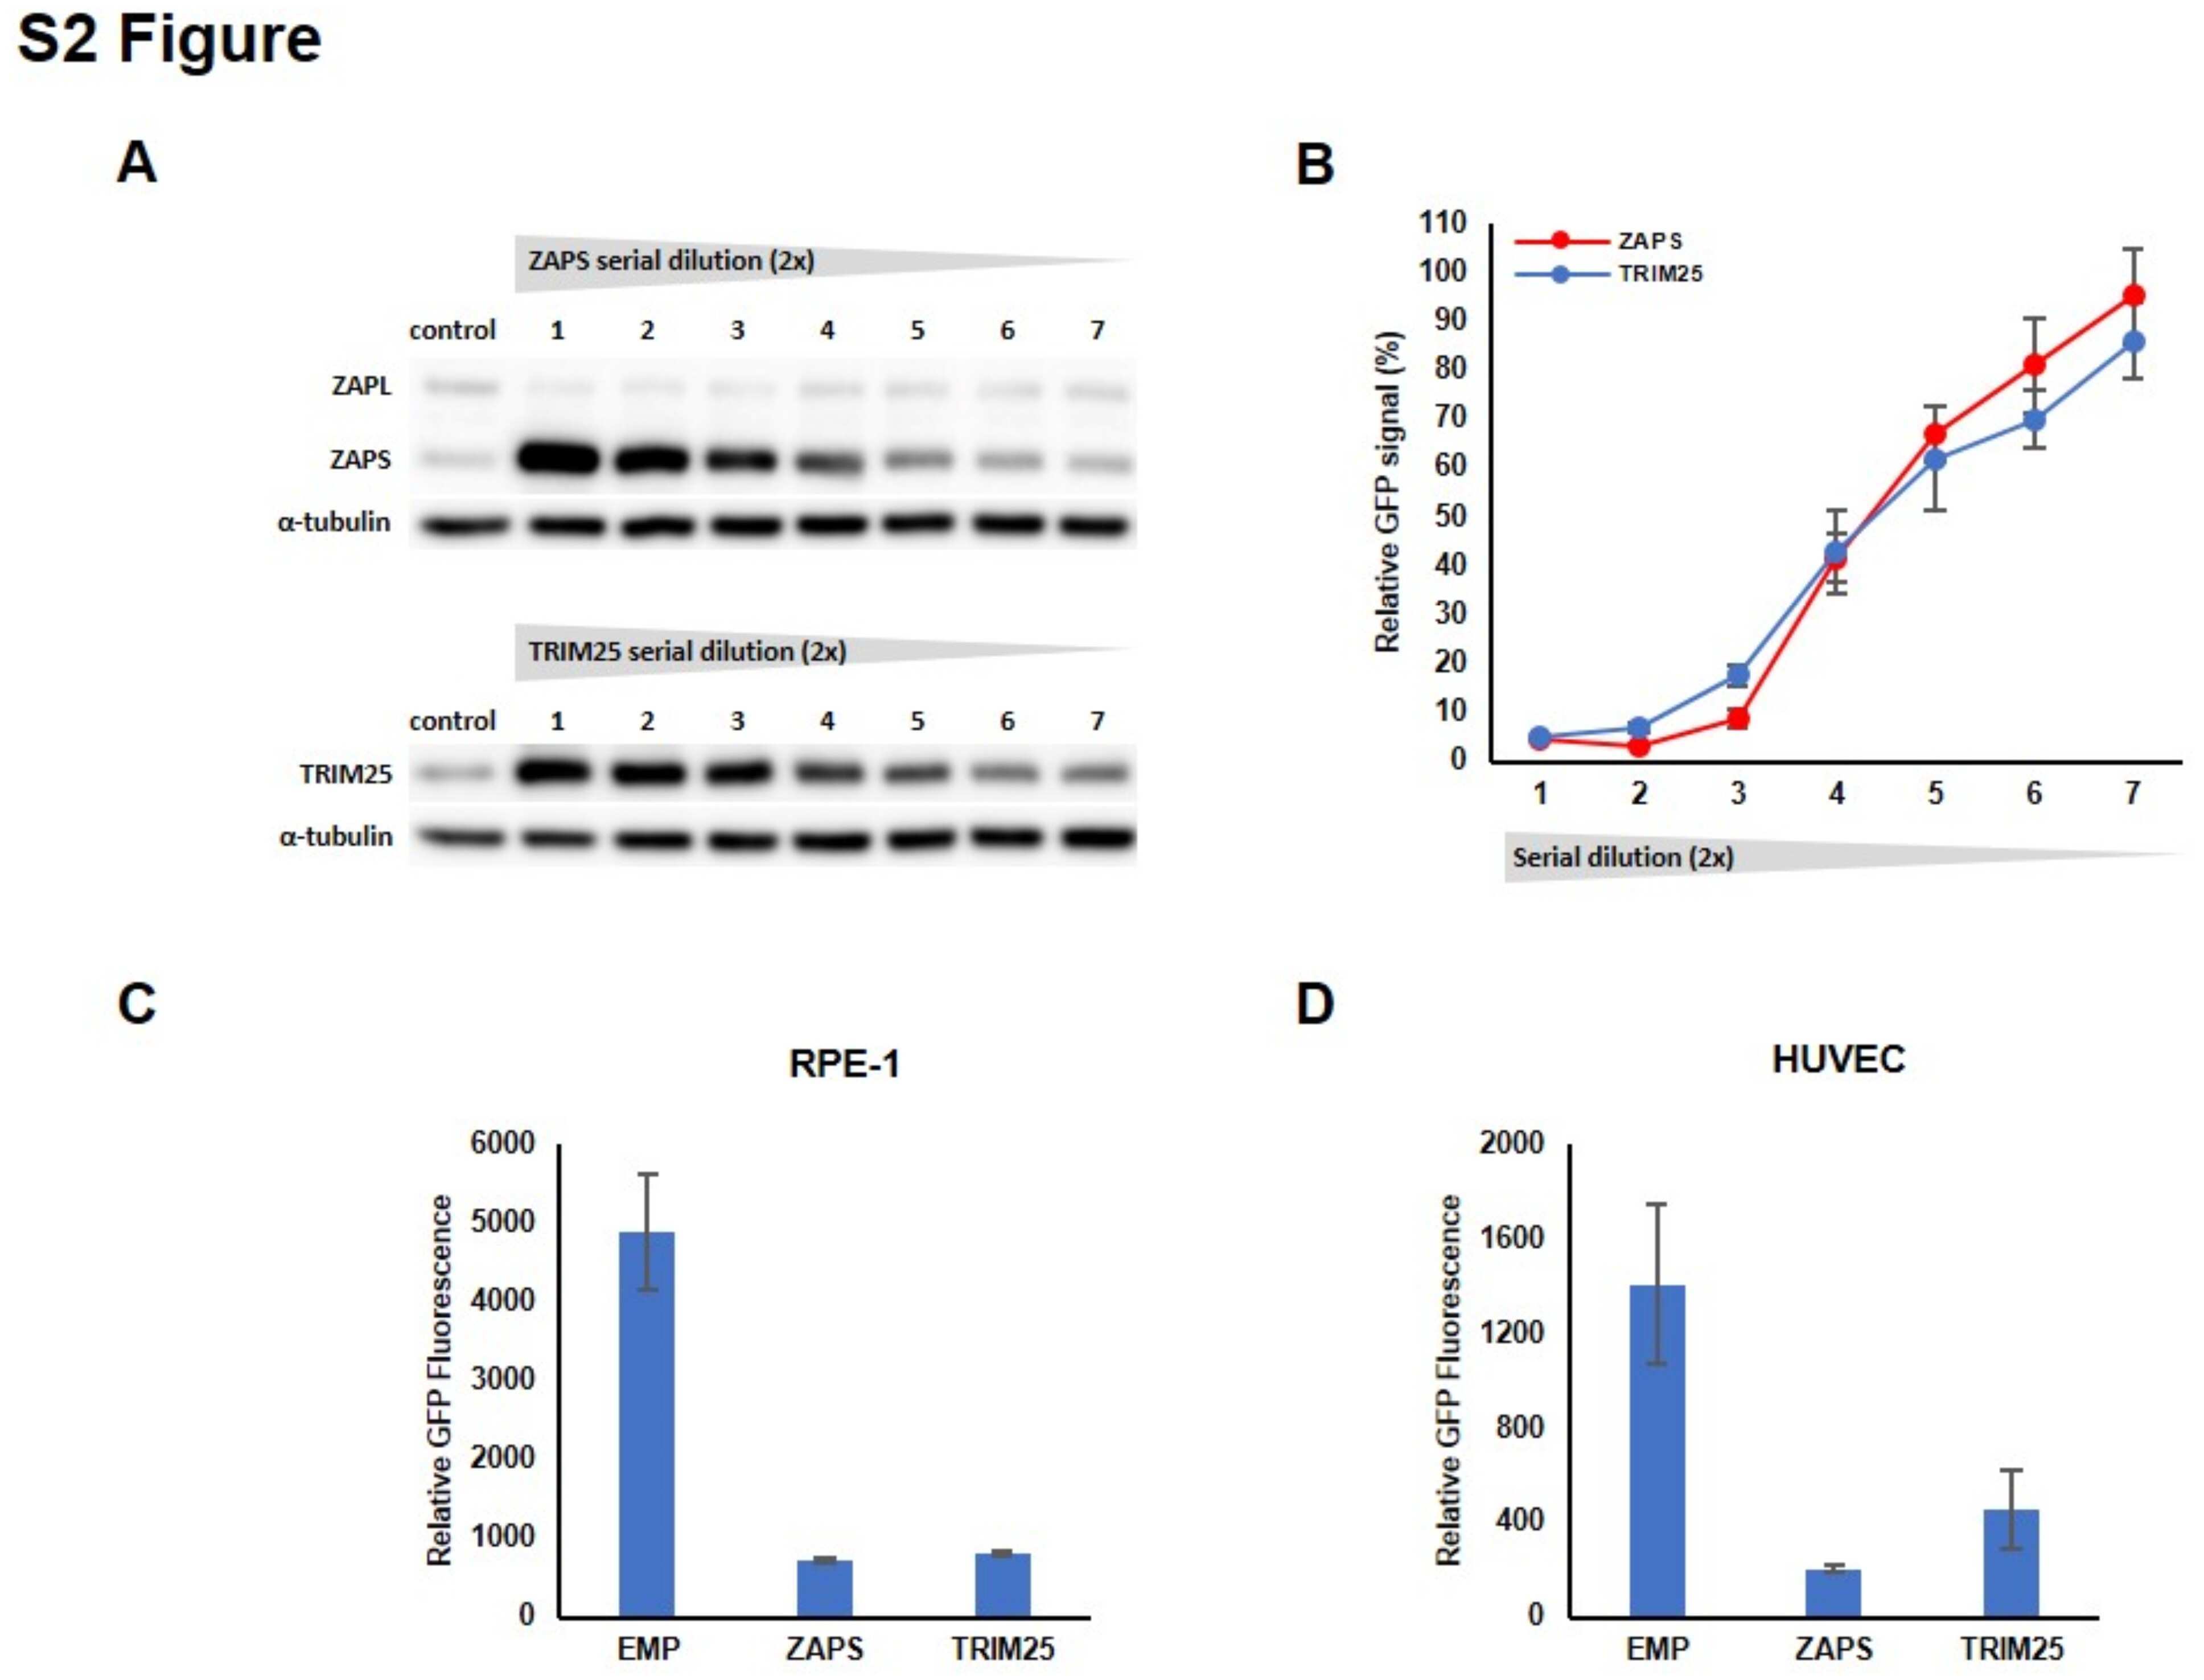
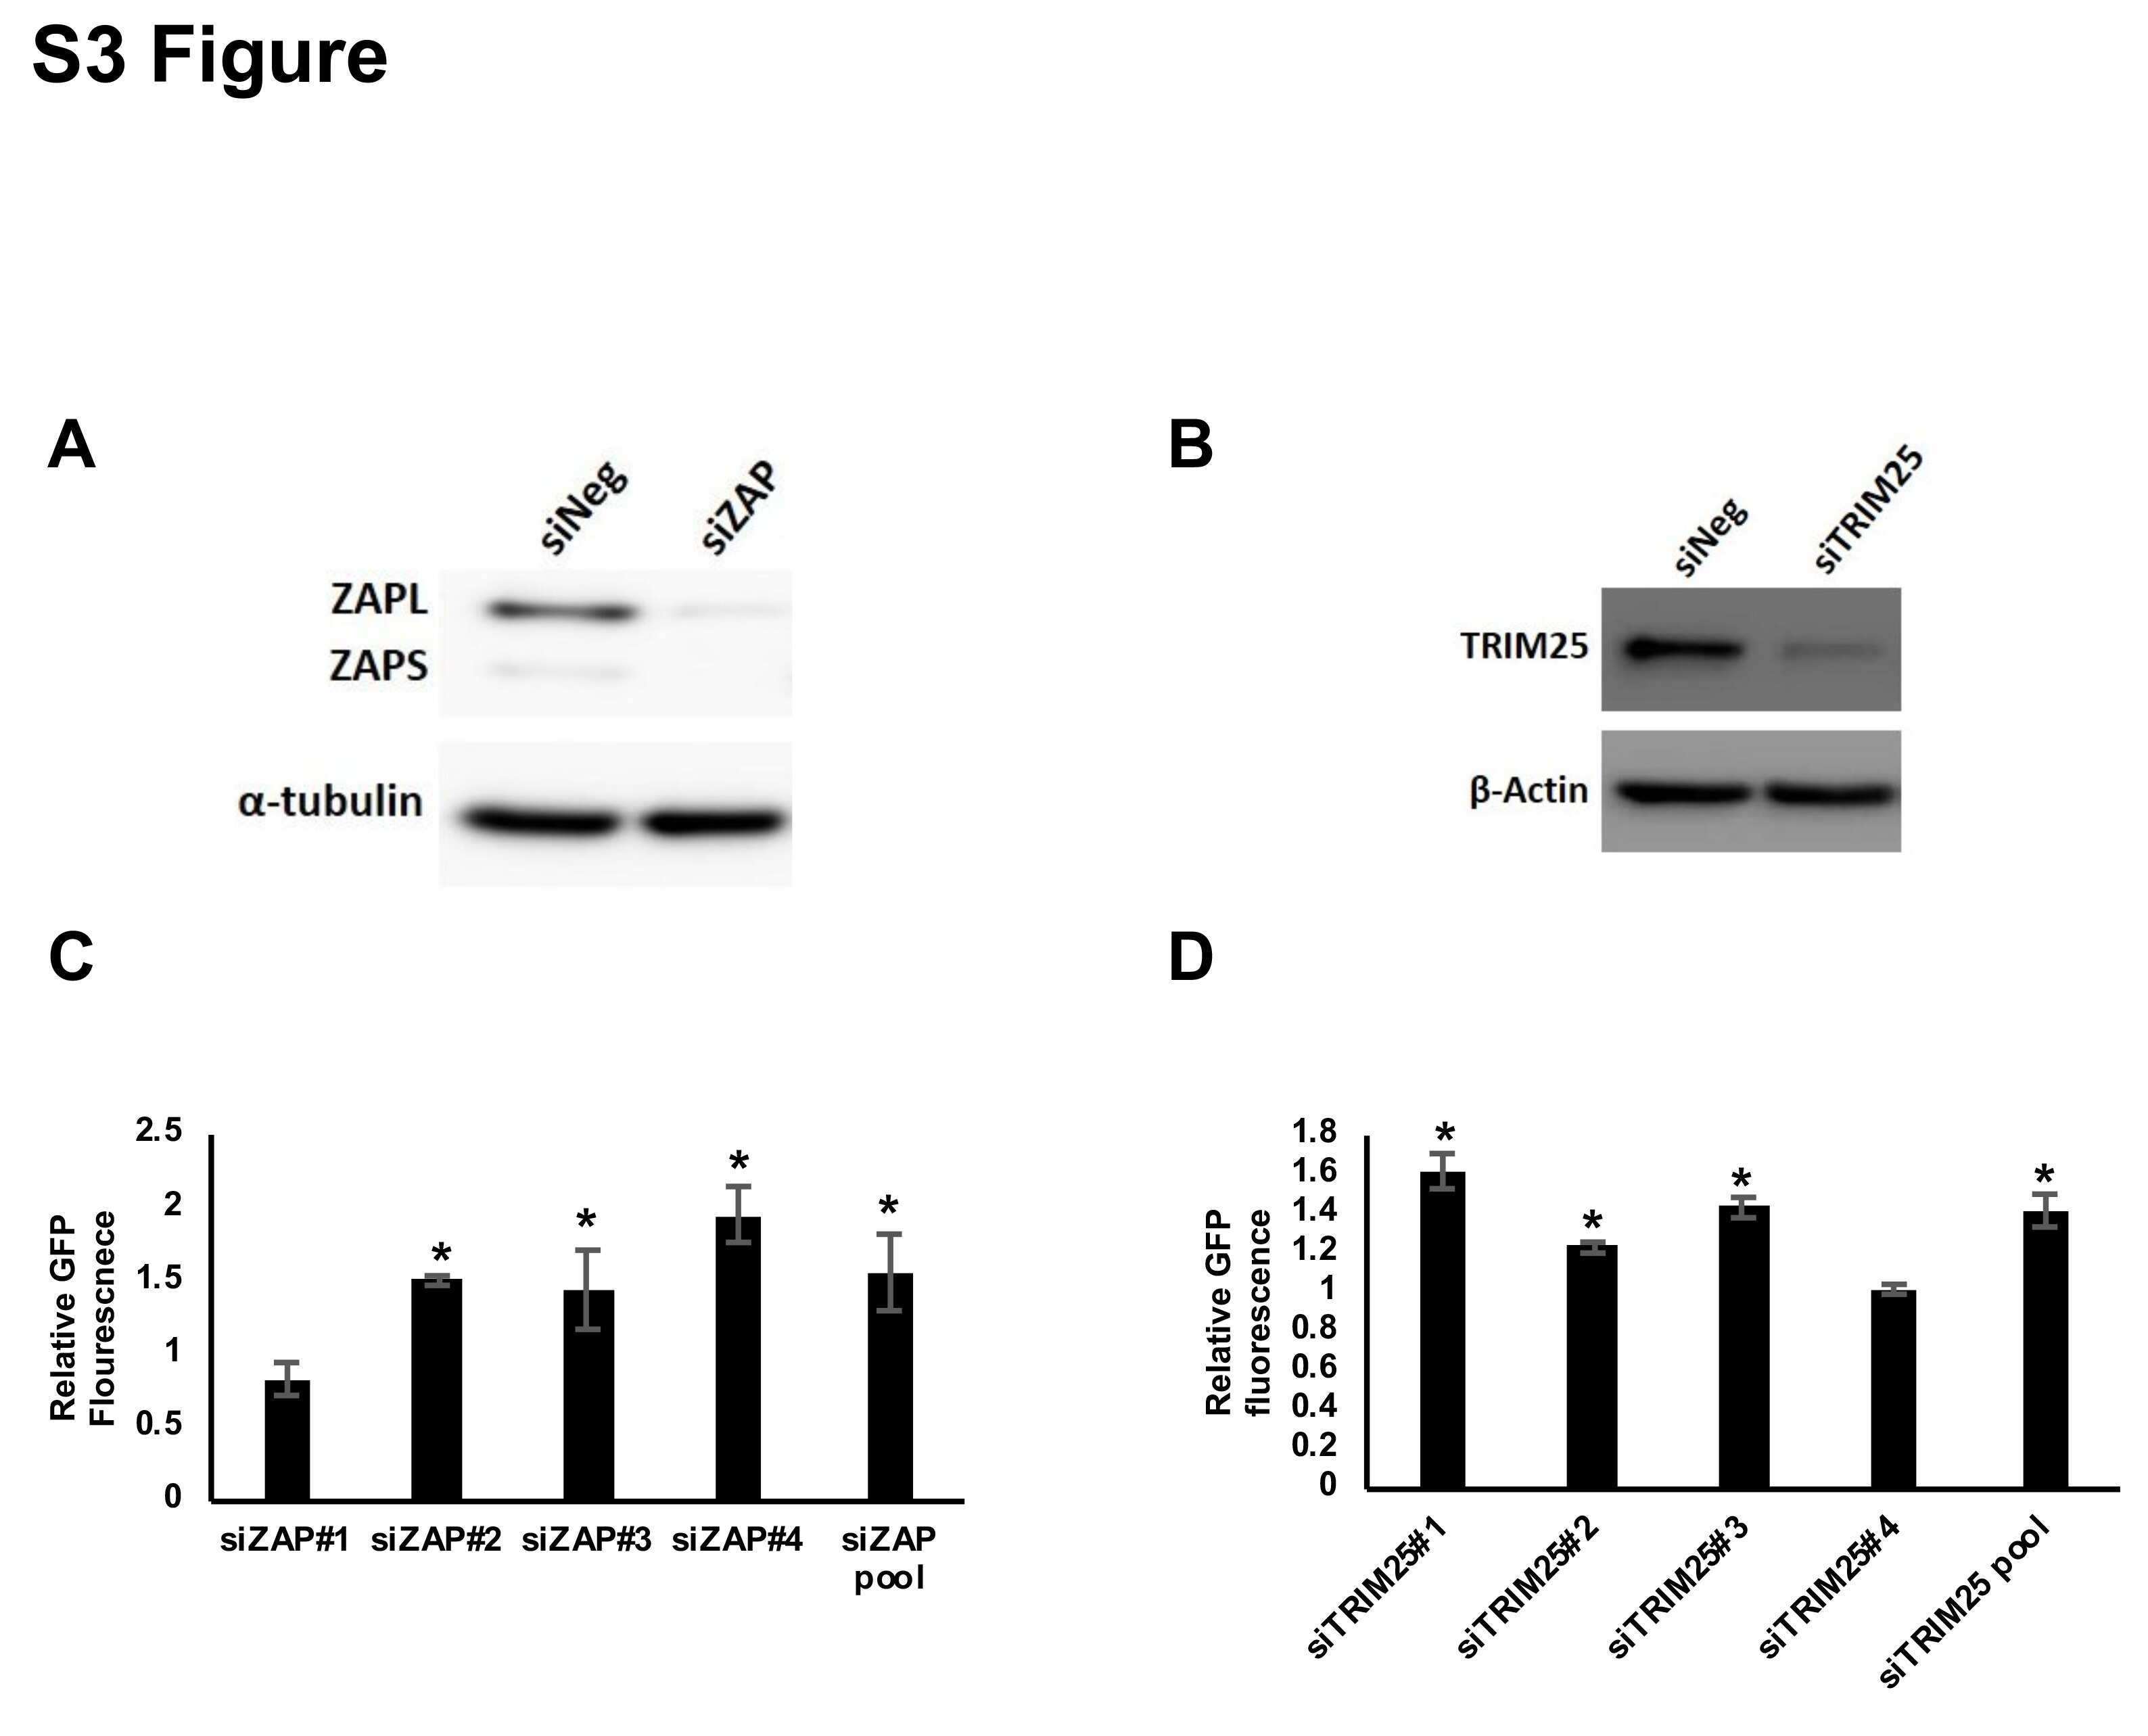
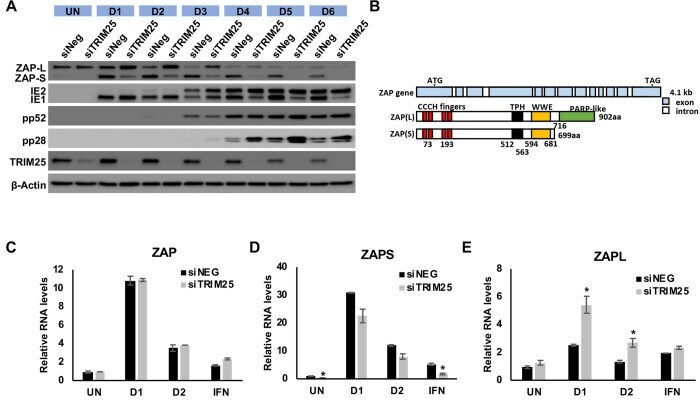
- Fig 9 TRIM25 regulates differential splicing of ZAP. (A) Wildtype fibroblast cells were transfected with TRIM25 siRNA or negative control siRNA (siNEG) and infected with TB40/E-GFP 48 hours post transfection (MOI of 3). Total protein lysates were harvested every 24 hours and expression levels of ZAPS and ZAPL and viral proteins were determined by western blot analysis. The result demonstrates that knockdown of TRIM25 leads to substantial reductions in ZAPS expression and corresponding increase in ZAPL expression. (B) Diagram of the genomic structure of human ZAP gene showing the two major isoforms, ZAPS and ZAPL. Wildtype fibroblast cells were transfected with TRIM25 siRNA or negative control siRNA (siNEG) and infected with TB40E-GFP at an MOI of 3, uninfected or treated with IFN-a. Total RNA was harvested from infected samples one (D1) and two (D2) days post infection with mock and IFN treated cells harvested one day post treatment. Primers to a ZAP shared exon (C) or specific primers to ZAPS (D) and ZAPL (E) were used to determined transcript levels by quantitative RT-qPCR analysis. Levels were normalised to GAPDH and compared to RNA levels from cells transfected with the control siRNA. N = 2, * p-value < 0.05 based on Student's t-test.
- Submitted by
- Invitrogen Antibodies (provider)
- Main image
- Experimental details
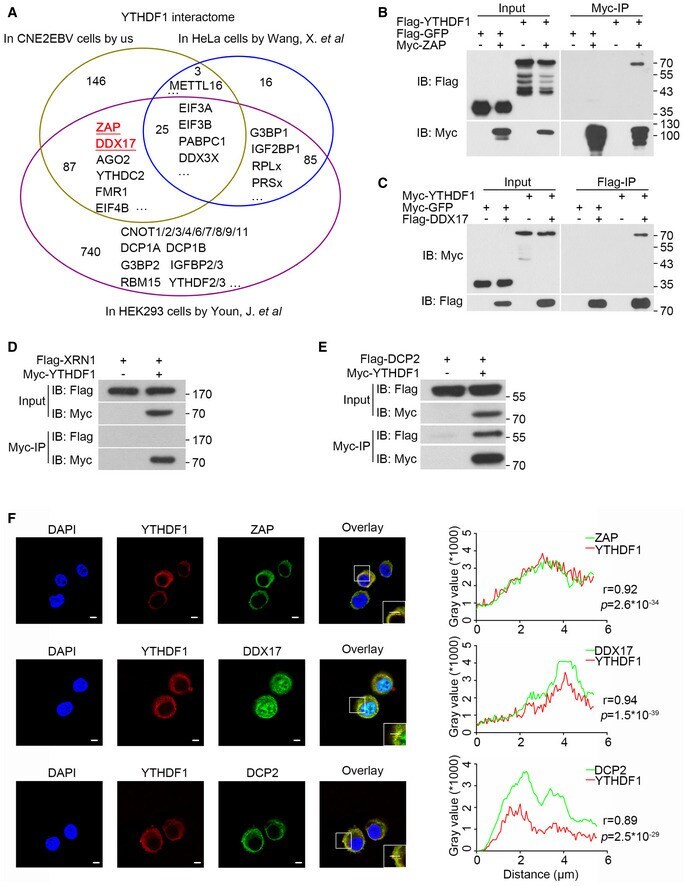
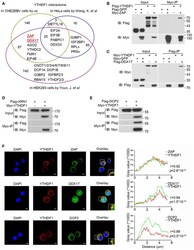
- Figure EV4 YTHDF1 interacts with ZAP, DDX17, and DCP2 A Venn diagram of YTHDF1 interaction partners in CNE2EBV, HeLa, and HEK293 cells. B, C The interactions between YTHDF1 and ZAP (B) or DDX17 (C) were detected by co-IP assays in 293T cells. The results were detected using the indicated antibodies. D YTHDF1 did not interact with XRN1 according to the co-IP assay in 293T cells. E The interaction of YTHDF1 with DCP2 detected by co-IP assays in 293T cells. F Co-localization of the endogenous YTHDF1 with ZAP, DDX17, and DCP2 in HK1 cells detected by immunofluorescence. YTHDF1 was stained with the mouse monoclonal YTHDF1 antibody and an Alexa Fluor 594-conjugated secondary antibody. ZAP, DDX17, and DCP2 were stained with the target-specific rabbit primary antibodies and an Alexa Fluor 488-conjugated secondary antibody. The nuclei were counterstained with DAPI (blue). The merged signal of YTHDF1 and ZAP, DDX17, or DCP2 is shown in yellow. Representative of three independent experiments are shown. Scale bars: 5 mum. The right panel shows the results of co-localization analysis in the selected region analyzed under a confocal laser scanning microscope. r : correlation coefficients. The P -values were calculated using Pearson's correlation test. Source data are available online for this figure.