Explore
 Validate
 Learn
Learn Western blot
 ELISA
ELISA Immunocytochemistry
Antibody data
- Antibody Data
- Antigen structure
- References [9]
- Comments [0]
- Validations
- Immunocytochemistry [2]
- Immunohistochemistry [1]
- Other assay [9]
Submit
Validation data
Reference
Comment
Report error
- Product number
- 37-1800 - Provider product page

- Provider
- Invitrogen Antibodies
- Product name
- EphB4 Monoclonal Antibody (3D7G8)
- Antibody type
- Monoclonal
- Antigen
- Recombinant full-length protein
- Description
- 37-1800 has been successfully used in Western Blot, immunohistochemical, immunofluorescence, ELISA and immunoprecipitation assays. By western blot this antibody detects a ~125kDa protein representing EPHB4 in MCF7, HT-29 and U2OS lysate.
- Reactivity
- Human
- Host
- Mouse
- Isotype
- IgG
- Antibody clone number
- 3D7G8
- Vial size
- 100 μg
- Concentration
- 0.5 mg/mL
- Storage
- -20°C
Submitted references Evaluation of EphB4 as Target for Image-Guided Surgery of Breast Cancer.
Human blood vessel organoids as a model of diabetic vasculopathy.
Ephrin‑B2 inhibits cell proliferation and motility in vitro and predicts longer metastasis‑free survival in breast cancer.
Evaluation of EphA2 and EphB4 as Targets for Image-Guided Colorectal Cancer Surgery.
YES oncogenic activity is specified by its SH4 domain and regulates RAS/MAPK signaling in colon carcinoma cells.
Erythropoietin Stimulates Tumor Growth via EphB4.
Gene expression profiling identifies EPHB4 as a potential predictive biomarker in colorectal cancer patients treated with bevacizumab.
EPHB4 and survival of colorectal cancer patients.
EphB receptor-binding peptides identified by phage display enable design of an antagonist with ephrin-like affinity.
de Muijnck C, van Gorkom Y, van Duijvenvoorde M, Eghtesadi M, Dekker-Ensink G, Bhairosingh SS, Affinito A, Kuppen PJK, Vahrmeijer AL, Sier CFM
Pharmaceuticals (Basel, Switzerland) 2020 Jul 30;13(8)
Pharmaceuticals (Basel, Switzerland) 2020 Jul 30;13(8)
Human blood vessel organoids as a model of diabetic vasculopathy.
Wimmer RA, Leopoldi A, Aichinger M, Wick N, Hantusch B, Novatchkova M, Taubenschmid J, Hämmerle M, Esk C, Bagley JA, Lindenhofer D, Chen G, Boehm M, Agu CA, Yang F, Fu B, Zuber J, Knoblich JA, Kerjaschki D, Penninger JM
Nature 2019 Jan;565(7740):505-510
Nature 2019 Jan;565(7740):505-510
Ephrin‑B2 inhibits cell proliferation and motility in vitro and predicts longer metastasis‑free survival in breast cancer.
Magic Z, Sandström J, Perez-Tenorio G
International journal of oncology 2019 Dec;55(6):1275-1286
International journal of oncology 2019 Dec;55(6):1275-1286
Evaluation of EphA2 and EphB4 as Targets for Image-Guided Colorectal Cancer Surgery.
Stammes MA, Prevoo HA, Ter Horst MC, Groot SA, Van de Velde CJ, Chan AB, de Geus-Oei LF, Kuppen PJ, Vahrmeijer AL, Pasquale EB, Sier CF
International journal of molecular sciences 2017 Feb 3;18(2)
International journal of molecular sciences 2017 Feb 3;18(2)
YES oncogenic activity is specified by its SH4 domain and regulates RAS/MAPK signaling in colon carcinoma cells.
Dubois F, Leroy C, Simon V, Benistant C, Roche S
American journal of cancer research 2015;5(6):1972-87
American journal of cancer research 2015;5(6):1972-87
Erythropoietin Stimulates Tumor Growth via EphB4.
Pradeep S, Huang J, Mora EM, Nick AM, Cho MS, Wu SY, Noh K, Pecot CV, Rupaimoole R, Stein MA, Brock S, Wen Y, Xiong C, Gharpure K, Hansen JM, Nagaraja AS, Previs RA, Vivas-Mejia P, Han HD, Hu W, Mangala LS, Zand B, Stagg LJ, Ladbury JE, Ozpolat B, Alpay SN, Nishimura M, Stone RL, Matsuo K, Armaiz-Peña GN, Dalton HJ, Danes C, Goodman B, Rodriguez-Aguayo C, Kruger C, Schneider A, Haghpeykar S, Jaladurgam P, Hung MC, Coleman RL, Liu J, Li C, Urbauer D, Lopez-Berestein G, Jackson DB, Sood AK
Cancer cell 2015 Nov 9;28(5):610-622
Cancer cell 2015 Nov 9;28(5):610-622
Gene expression profiling identifies EPHB4 as a potential predictive biomarker in colorectal cancer patients treated with bevacizumab.
Guijarro-Muñoz I, Sánchez A, Martínez-Martínez E, García JM, Salas C, Provencio M, Alvarez-Vallina L, Sanz L
Medical oncology (Northwood, London, England) 2013;30(2):572
Medical oncology (Northwood, London, England) 2013;30(2):572
EPHB4 and survival of colorectal cancer patients.
Davalos V, Dopeso H, Castaño J, Wilson AJ, Vilardell F, Romero-Gimenez J, Espín E, Armengol M, Capella G, Mariadason JM, Aaltonen LA, Schwartz S Jr, Arango D
Cancer research 2006 Sep 15;66(18):8943-8
Cancer research 2006 Sep 15;66(18):8943-8
EphB receptor-binding peptides identified by phage display enable design of an antagonist with ephrin-like affinity.
Koolpe M, Burgess R, Dail M, Pasquale EB
The Journal of biological chemistry 2005 Apr 29;280(17):17301-11
The Journal of biological chemistry 2005 Apr 29;280(17):17301-11
No comments: Submit comment
Supportive validation
- Submitted by
- Invitrogen Antibodies (provider)
- Main image
- Experimental details
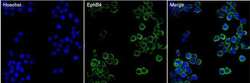
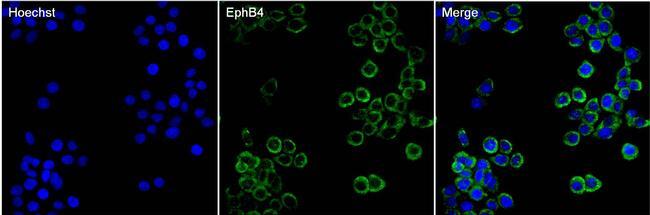
- Immunofluorescent analysis of EphB4 (green) in HT29 cells. The cells were fixed with 4% paraformaldehyde in PBS for 15 minutes at room temperature and blocked with 3% BSA for 30 minutes at room temperature. Cells were stained with a EphB4 mouse monoclonal antibody (Product # 37-1800) at a concentration of 5 µg/mL in blocking buffer for 1 hour at room temperature, and then incubated with a Goat anti-Mouse IgG (H+L) Secondary Antibody, Alexa Fluor Plus 488 conjugate (Product # A32731) at a dilution of 1:500 for at least 30 minutes at a room temperature in the dark (green). Nuclei (blue) were stained with Hoechst 33342 (Product # 62249). Images were taken on a Thermo Scientific ToxInsight Instrument at 20X magnification.
- Submitted by
- Invitrogen Antibodies (provider)
- Main image
- Experimental details
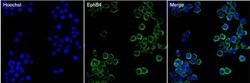
- Immunofluorescent analysis of EphB4 (green) in HT29 cells. The cells were fixed with 4% paraformaldehyde in PBS for 15 minutes at room temperature and blocked with 3% BSA for 30 minutes at room temperature. Cells were stained with a EphB4 mouse monoclonal antibody (Product # 37-1800) at a concentration of 5 µg/mL in blocking buffer for 1 hour at room temperature, and then incubated with a Goat anti-Mouse IgG (H+L) Secondary Antibody, Alexa Fluor Plus 488 conjugate (Product # A32731) at a dilution of 1:500 for at least 30 minutes at a room temperature in the dark (green). Nuclei (blue) were stained with Hoechst 33342 (Product # 62249). Images were taken on a Thermo Scientific ToxInsight Instrument at 20X magnification.
Supportive validation
- Submitted by
- Invitrogen Antibodies (provider)
- Main image
- Experimental details
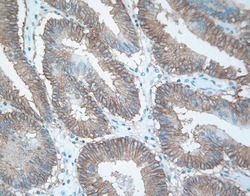
- Immunohistochemical staining of human colon carcinoma tissue using EphB4 Receptor Monoclonal Antibody, Mouse (clone 3D7G8) (clone 3D7G8) (Product # 37-1800).
Supportive validation
- Submitted by
- Invitrogen Antibodies (provider)
- Main image
- Experimental details
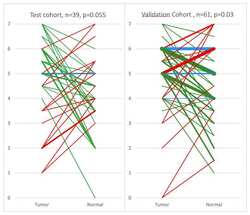
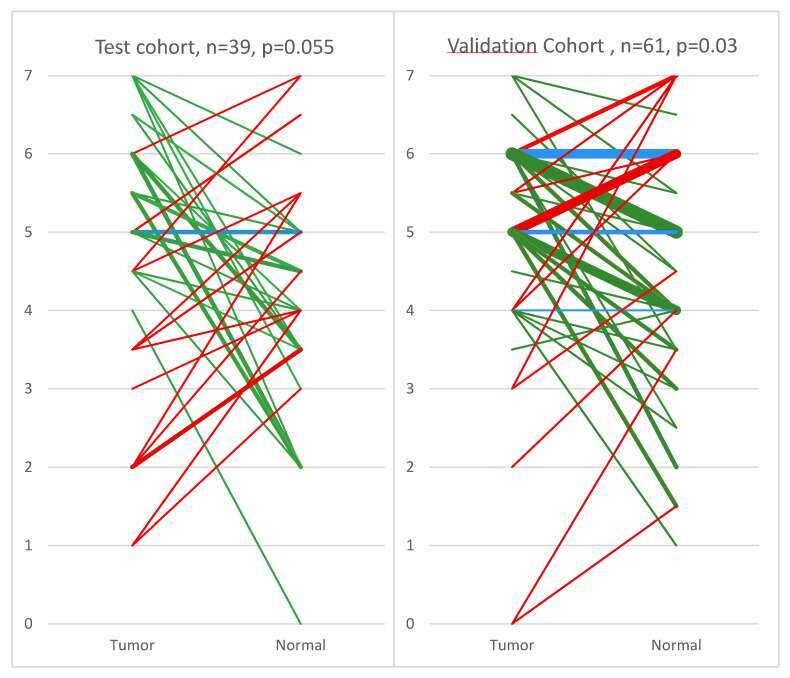
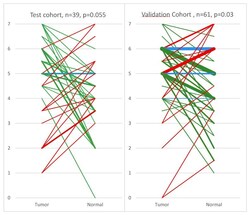
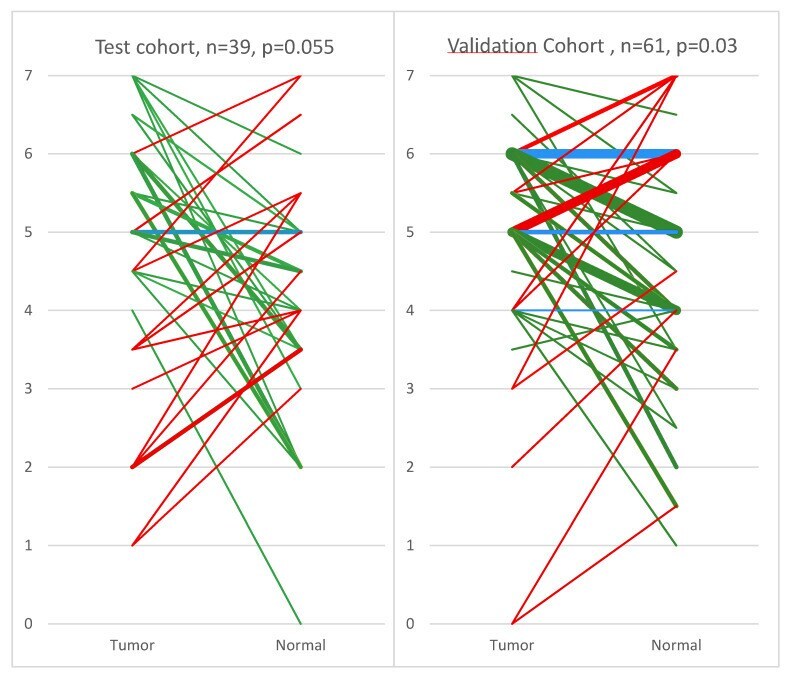
- Figure 2 Scoring diagram of breast cancer and adjacent normal tissue pairs of the test cohort ( A ) and validation cohort ( B ) stained for EphB4. Green = Tumor is higher score than normal; Red = Normal tissue is higher score than tumor; Blue = Tumor and normal tissue share the same score. The thickness of the line is proportional to the number of sets with identical scores. The numbers 0-7 on the y -axis represent the IHC staining scoring values. The thickest line (in panel B, green line 6 to 5) represents 7 pairs and the thinnest line (in both panels) represents 1 pair.
- Submitted by
- Invitrogen Antibodies (provider)
- Main image
- Experimental details
- NULL

- Submitted by
- Invitrogen Antibodies (provider)
- Main image
- Experimental details
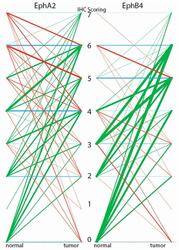
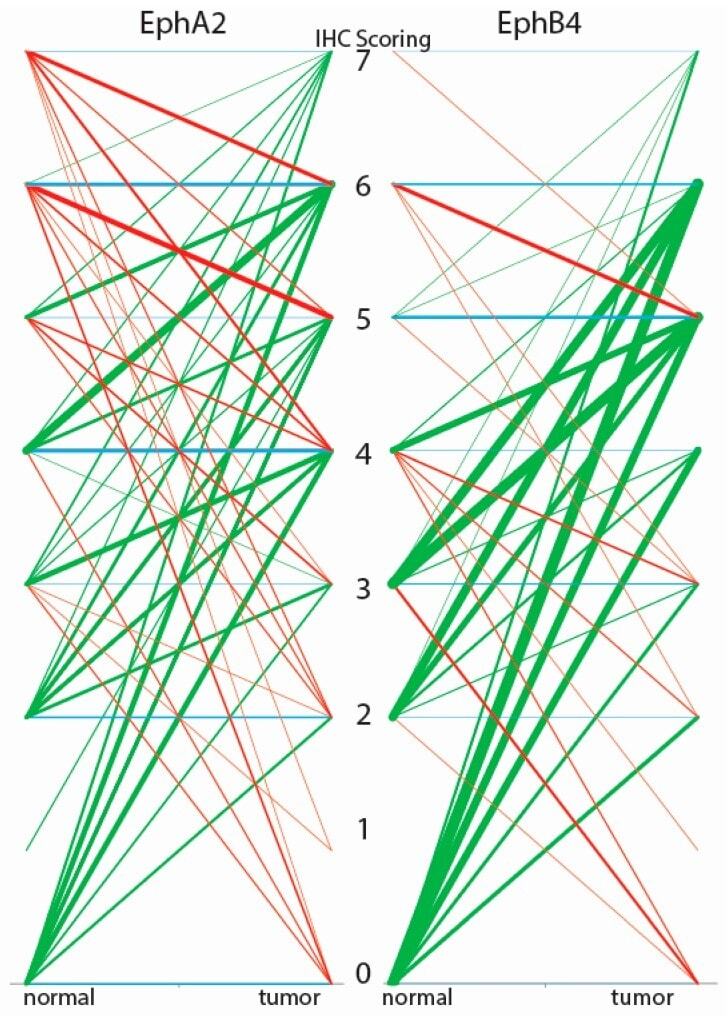
- Figure 2 N/T scorings diagram for the tissue microarray (TMA) stained for EphA2 and EphB4. Green = higher score in tumor than normal tissue; Red = higher score in normal tissue than tumor tissue; Blue = no difference in score between normal and tumor tissue. The thickness of the line represents the number of patients, the thicker the line the more patients. The numbers 0-7 represent the IHC scoring values.
- Submitted by
- Invitrogen Antibodies (provider)
- Main image
- Experimental details
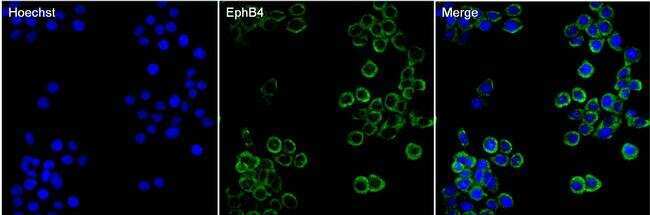
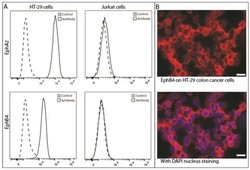
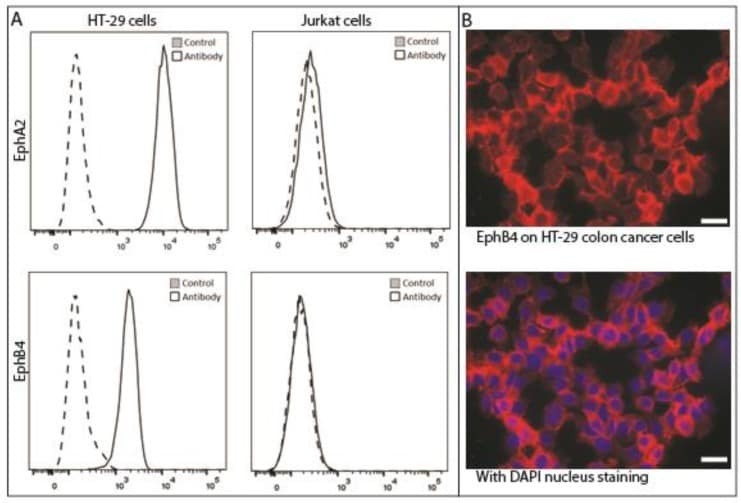
- Figure 3 Presence of EphA2 and EphB4 on colon cancer cells. ( A ) Flow cytometry of HT-29 shows abundant presence of both EphA2 and EphB4 compared with negative Jurkat cells; ( B ) Immunofluorescence of EphB4 indicates a membranous staining on HT-29 colon cancer cells grown in monolayer. X-axes indicate fluorescence intensity, the scale bar represents 20 micrometers.
- Submitted by
- Invitrogen Antibodies (provider)
- Main image
- Experimental details
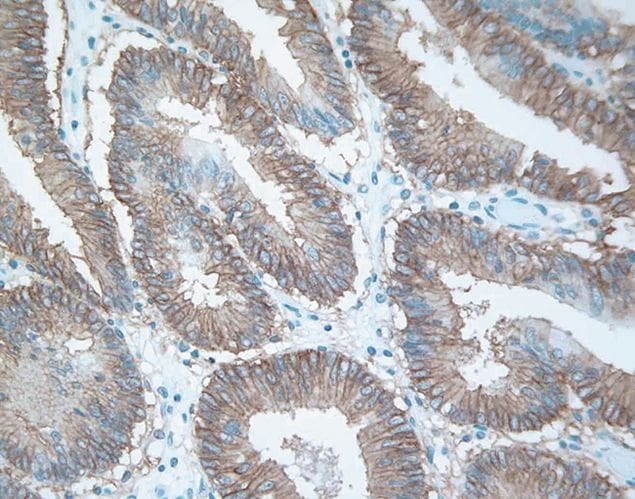
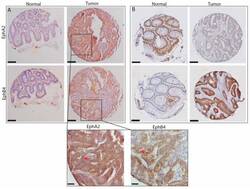
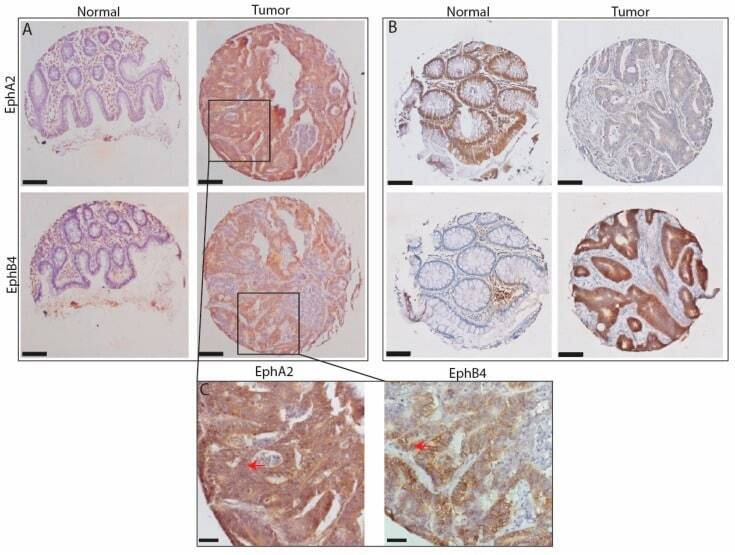
- Figure 1 Two examples of staining patterns for EphA2 and EphB4 in sets of tumor and normal tissue from patients with colon cancer. ( A ) shows the most generally found pattern, with low expression of both proteins in normal tissue and abundant expression in tumor tissue; ( B ) shows an aberrant expression pattern (as indicated in Figure 2 ), with extremely high EphA2 expression in normal tissue and absence of staining in the corresponding tumor tissue. The scale bars represent 150 micrometers; ( C ) shows 40x enlargements of the sections indicated in A. Red arrows indicate membranous staining. The scale bar represents 30 micrometer.
- Submitted by
- Invitrogen Antibodies (provider)
- Main image
- Experimental details
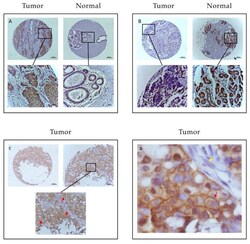
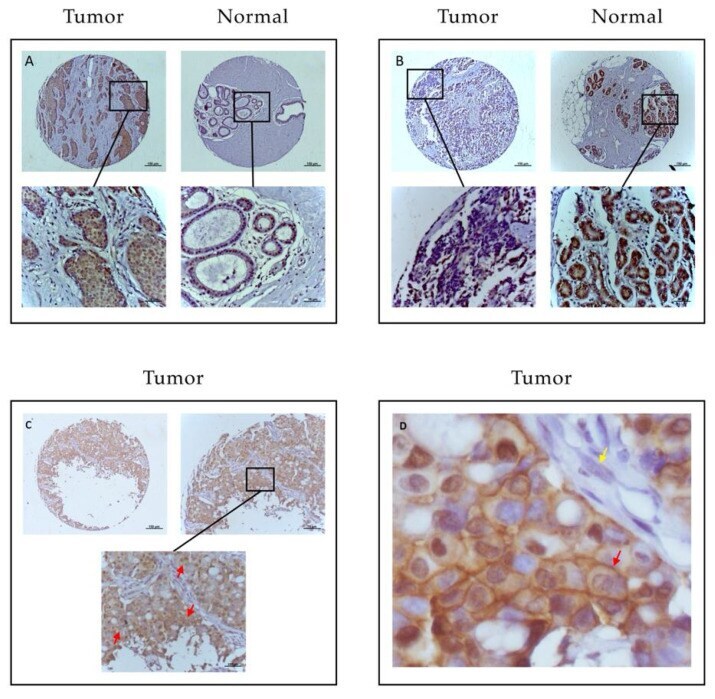
- Figure 1 Examples of staining pattern for EphB4 in tumor and normal tissue sets from patients with breast cancer. ( A ) shows the common staining pattern with higher expression of EphB4 in tumor tissue comparing to corresponding normal tissue. ( B ) shows an aberrant pattern with higher expression of EphB4 in normal tissue than staining in tumor tissue. The scale bars represent 100 micrometers at pictures above. Pictures below show 40x enlargements of the sections in ( A - C ). ( D ) shows 400x enlargement of a tumor section from panel ( C ) to emphasize membranous staining of EphB4. Red arrows indicate membrane staining, yellow arrow absence of EphB4 in stromal cells.
- Submitted by
- Invitrogen Antibodies (provider)
- Main image
- Experimental details
- Figure 2 Scoring diagram of breast cancer and adjacent normal tissue pairs of the test cohort ( A ) and validation cohort ( B ) stained for EphB4. Green = Tumor is higher score than normal; Red = Normal tissue is higher score than tumor; Blue = Tumor and normal tissue share the same score. The thickness of the line is proportional to the number of sets with identical scores. The numbers 0-7 on the y -axis represent the IHC staining scoring values. The thickest line (in panel B, green line 6 to 5) represents 7 pairs and the thinnest line (in both panels) represents 1 pair.
- Submitted by
- Invitrogen Antibodies (provider)
- Main image
- Experimental details
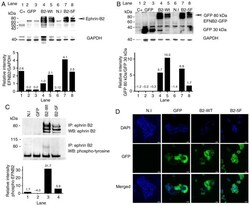
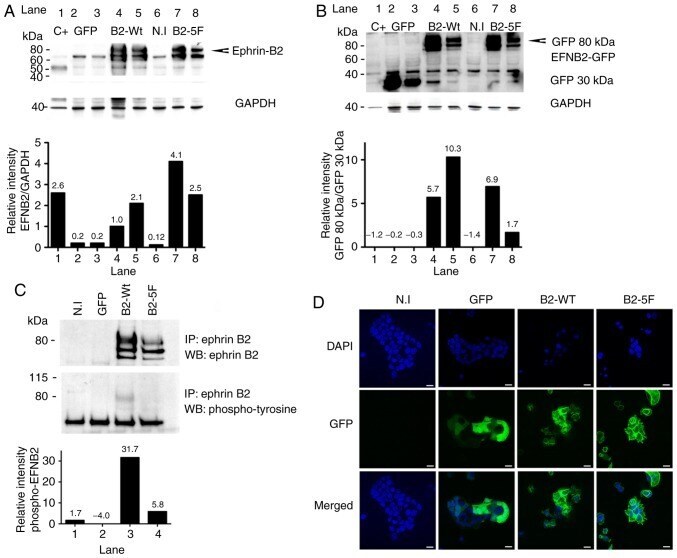
- Figure 2 Generation of MCF7-B2 cells. Infected cells with viral vectors expressing GFP (lanes 2 and 3), ephrin-B2-WT (B2-WT) (lanes 4 and 5) and ephrin-B2-5F (B2-5F) (lanes 7 and 8) were treated with two multiplicities of infection (MOI): MOI 25 (lanes 2, 4 and 7) and MOI 1.5 (lanes 3, 5 and 8). Total lysate from SKBR3 cells infected with human ephrin-B2 (EX-M0409-Lv105, Genecopoeia) (~50 kDa) was used as a positive control (C+). Non-infected MCF7 cells (N.I) were used as a negative control. GAPDH was used as a loading control. Ephrin-B2 detected with the anti-pan (A) ephrin B antibody or (B) anti-GFP antibody and visualized as an 80 kDa GFP-fusion protein indicated by arrowheads. Ephrin-B2 activation was verified by (C) immunoprecipitation and column charts, from this representative experiment, and representative immunoblots are shown. Ephrin-B2 expression was visualized by confocal microscopy at x600 magnification. (D) Cell nuclei are indicated with DAPI staining. Scale bars, 30 u m.
- Submitted by
- Invitrogen Antibodies (provider)
- Main image

- Experimental details
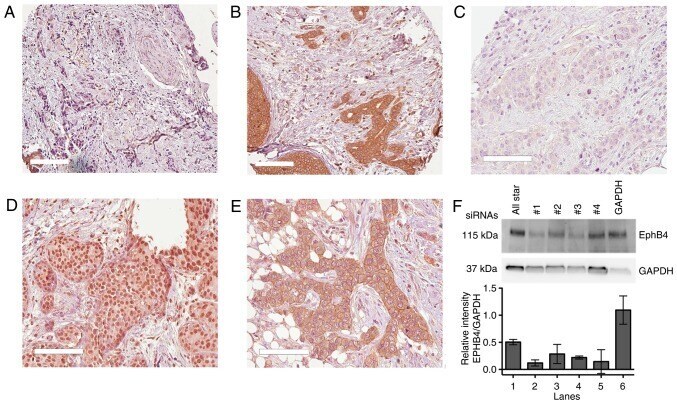
- Figure 5 Immunohistochemistry was used to detect ephrin-B and EphB4 protein expression. Representative immunostaining of a (A) negative ephrin-B tumor, (B) membranous ephrin-B, (C) EphB4-negative, (D) nuclear EphB4 and (E) membranous EphB4. Scale bars, 100 u m. (F) EphB4 antibody validation in MCF7 cells was performed by immunoblotting and the intensity of the bands quantified (n=2). Error bars represent the standard error of the mean (SEM). The AllStar siRNA was used as negative control and GAPDH siRNA as positive control. The ephrin B antibody was the same used in all the in vitro experiments.