 Explore
 Validate
 Learn
Learn Western blot
 Immunocytochemistry
Antibody data
- Antibody Data
- Antigen structure
- References [1]
- Comments [0]
- Validations
- Immunocytochemistry [1]
- Immunohistochemistry [2]
- Other assay [4]
Submit
Validation data
Reference
Comment
Report error
- Product number
- PA5-31482 - Provider product page

- Provider
- Invitrogen Antibodies
- Product name
- SMYD1 Polyclonal Antibody
- Antibody type
- Polyclonal
- Antigen
- Recombinant full-length protein
- Description
- Recommended positive controls: 293T, A431, mouse heart. Predicted reactivity: Mouse (93%), Rat (93%), Pig (95%), Chicken (83%), Bovine (95%). Store product as a concentrated solution. Centrifuge briefly prior to opening the vial.
- Reactivity
- Human, Mouse, Rat
- Host
- Rabbit
- Isotype
- IgG
- Vial size
- 100 μL
- Concentration
- 1 mg/mL
- Storage
- Store at 4°C short term. For long term storage, store at -20°C, avoiding freeze/thaw cycles.
Submitted references The Methyltransferase Smyd1 Mediates LPS-Triggered Up-Regulation of IL-6 in Endothelial Cells.
Shamloul A, Steinemann G, Roos K, Liem CH, Bernd J, Braun T, Zakrzewicz A, Berkholz J
Cells 2021 Dec 13;10(12)
Cells 2021 Dec 13;10(12)
No comments: Submit comment
Supportive validation
- Submitted by
- Invitrogen Antibodies (provider)
- Main image

- Experimental details
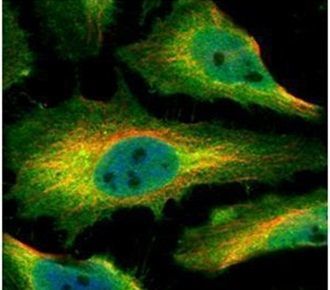
- Immunofluorescent analysis of SMYD1 in paraformaldehyde-fixed HeLa cells using a SMYD1 polyclonal antibody (Product # PA5-31482) (Green) at a 1:500 dilution. Alpha-tubulin filaments were labeled with Product # PA5-29281 (Red) at a 1:2000.
Supportive validation
- Submitted by
- Invitrogen Antibodies (provider)
- Main image
- Experimental details
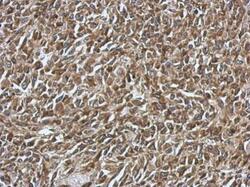
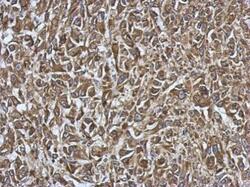
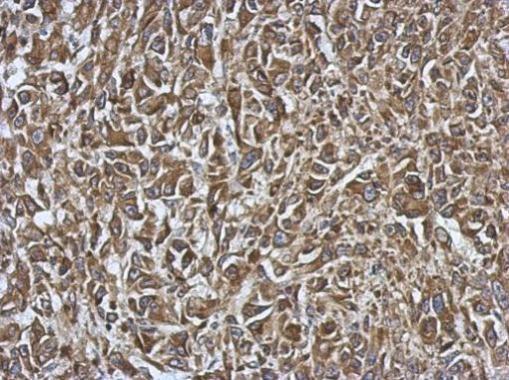
- Immunohistochemical analysis of paraffin-embedded RT2 xenograft, using SMYD1 Polyclonal Antibody (Product # PA5-31482) antibody at 1:500 dilution. Antigen Retrieval: EDTA based buffer, pH 8.0, 15 min.
- Submitted by
- Invitrogen Antibodies (provider)
- Main image
- Experimental details
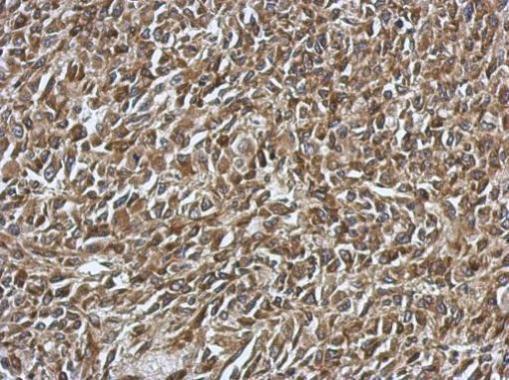
- Immunohistochemical analysis of paraffin-embedded HBL435 xenograft, using SMYD1 Polyclonal Antibody (Product # PA5-31482) antibody at 1:500 dilution. Antigen Retrieval: EDTA based buffer, pH 8.0, 15 min.
Supportive validation
- Submitted by
- Invitrogen Antibodies (provider)
- Main image
- Experimental details
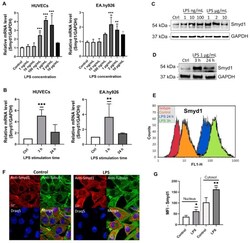
- Figure 1 LPS stimulation increases Smyd1 expression in endothelial cells. ( A ) RT-qPCR for the quantification of Smyd1 mRNA levels in HUVECs and EA.hy926 cells that were stimulated with different concentrations of LPS ranging from 1 ng/mL to 10 ug/mL for 3 h. Expression values relative to control (no LPS supplement). n = 3, ** p < 0.01, *** p < 0.001 using one-way ANOVA. ( B ) RT-qPCR for the quantification of Smyd1 mRNA levels in HUVECs and EA.hy926 cells that were stimulated with 1 ug/mL LPS for 3 h or 24 h. Expression values relative to control (Ctrl, no LPS supplement). n = 3, ** p < 0.01, *** p < 0.001 using one-way ANOVA. ( C ) Immunoblotting for the determination of Smyd1 protein levels in total lysates of EA.hy926 cells incubated with different concentrations of LPS ranging from 1 ng/mL to 10 ug/mL for 3 h in comparison to no LPS supplement (Ctrl). Representative immunoblot of n = 3. ( D ) Immunoblotting for the determination of Smyd1 protein levels in total lysates of EA.hy926 cells after incubation with 1 ug/mL LPS for 3 h or 24 h in comparison to no LPS supplement (Ctrl). Representative immunoblot of n = 3. ( E ) Representative flow cytometry histograms of EA.hy926 cells stimulated without LPS or with 1 ug/mL LPS for 3 h or 24 h and incubated with a monoclonal antibody recognizing Smyd1 and, subsequently, fluorescence-labeled secondary antibodies. An isotype-matched monoclonal IgG was used as control. n = 3. ( F ) Immunocytochemistry with anti-Smyd1 (red) and anti

- Submitted by
- Invitrogen Antibodies (provider)
- Main image

- Experimental details
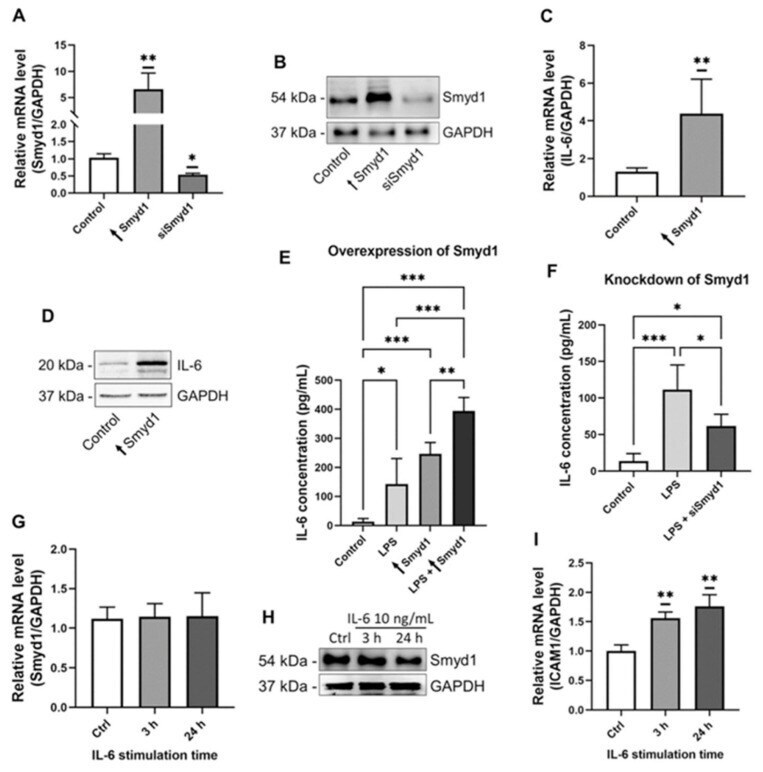
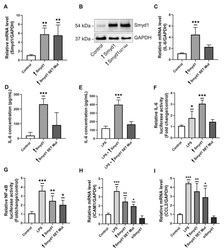
- Figure 2 Smyd1 increases IL-6 expression and secretion in endothelial cells. ( A , B ) RT-qPCR to quantify Smyd1 mRNA levels ( A ) and immunoblotting for the determination of Smyd1 protein levels ( B ) in pCMV2-Smyd1-flag vector (|Smyd1) or Smyd1-specific siRNA transfected EA.hy926 cells. Expression values relative to control (transfection with vector lacking gene insert). n = 3, * p < 0.05, ** p < 0.01 using one-way ANOVA. Representative immunoblot of n = 3. ( C , D ) RT-qPCR for the quantification of IL-6 mRNA levels ( C ) and immunoblotting for the determination of IL-6 protein levels ( D ) in total lysates of EA.hy926 cells, which were transfected with either a pCMV2-Smyd1-flag vector (|Smyd1) or a vector without specific gene insert (Control). Expression values relative to control. n = 3, ** p < 0.01 using Student t -test. Representative immunoblot of n = 3. ( E ) ELISA for the quantification of IL-6 protein concentrations in supernatants of EA.hy926 cells transfected with a pCMV2-Smyd1-flag vector (|Smyd1) or a vector lacking a specific gene insert (Control) without or with LPS (1 ug/mL) stimulation for 24 h. n = 7, * p < 0.05, ** p < 0.01, *** p < 0.001 using two-way ANOVA. ( F ) ELISA for the quantification of IL-6 protein concentrations in supernatants of EA.hy926 cells simultaneously transfected with Smyd1-specific siRNA and stimulated with LPS (1 ug/mL) for 24 h or scrambled siRNA (Control). n = 5, * p < 0.05, *** p < 0.001 using two-way ANOVA. ( G , H ) RT-qPCR to
- Submitted by
- Invitrogen Antibodies (provider)
- Main image
- Experimental details
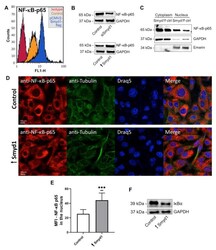
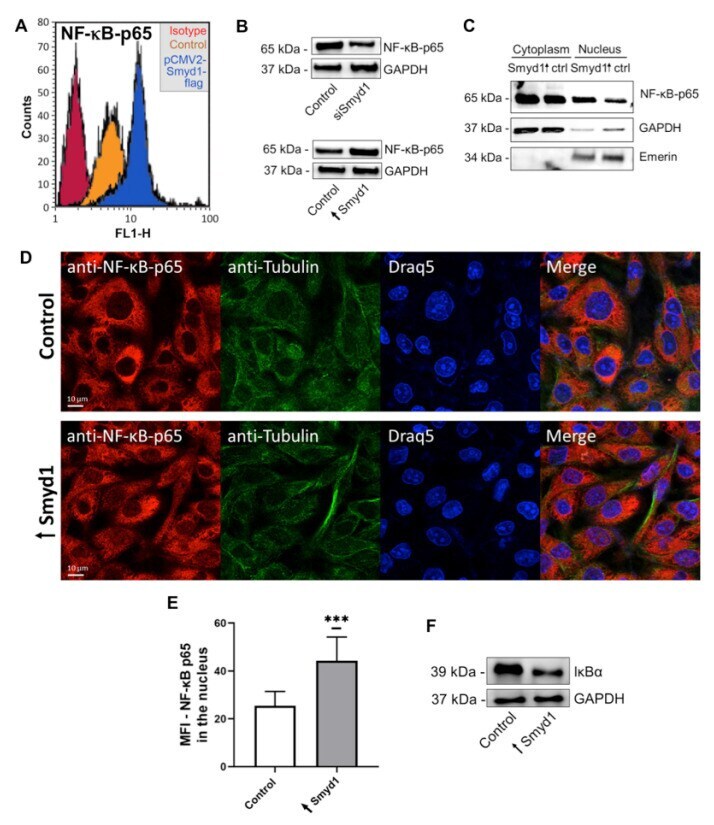
- Figure 3 Smyd1 up-regulates and activates nuclear translocation of NF-kappaB in EA.hy926 cells. ( A ) Representative flow cytometry histograms of EA.hy926 cells transfected with a pCMV2-Smyd1-flag vector or a vector without gene insert (control) and incubated with a monoclonal antibody recognizing the p65 subunit of NF-kappaB and, subsequently, fluorescence-labeled secondary antibodies. An isotype-matched monoclonal IgG control antibody was used as control. ( B ) Immunoblotting for the determination of NF-kappaB-p65 levels in total lysates of EA.hy926 cells transfected either with a vector lacking a specific gene insert (Control) or a pCMV2-Smyd1-flag vector (|Smyd1) and scrambled siRNA (Control) or Smyd1-specific siRNAs (siSmyd1). Representative immunoblots of n = 3. ( C ) Immunoblotting for the determination of NF-kappaB-p65 subunit levels in nuclear and cytoplasmic fractions of EA.hy926 cells (isolated by NE-PER extraction kit) that were transfected with a pCMV2-Smyd1-flag vector (|Smyd1) or a vector without gene insert (Ctrl) for 24 h. Blot matrices were probed with antibodies against NF-kappaB p65, Emerin (nuclear marker) and GAPDH (cytoplasmic marker). Representative immunoblot of n = 3. ( D ) Immunocytochemistry of EA.hy926 cells with anti-NF-kappaB subunit (red) and anti-Tubulin (green) antibodies 24 h after transfection with a vector without gene insert (Control; upper panel) or a pCMV2-Smyd1-flag vector (|Smyd1; lower panel). Draq5 (blue) was used to counterstain th
- Submitted by
- Invitrogen Antibodies (provider)
- Main image
- Experimental details
- Figure 5 The methyltransferase activity of Smyd1 regulates IL-6 expression. ( A , B ) RT-qPCR for the quantification of Smyd1 mRNA levels ( A ) and immunoblotting for determination of Smyd1 protein levels ( B ) in total lysates of EA.hy926 cells transfected with the pCMV2-Smyd1-flag vector (|Smyd1) or the Smyd1-SET-mutant vector (|Smyd1 SET Mut). Expression values relative to control (transfection with vector lacking gene insert). n = 3, ** p < 0.01 using one-way ANOVA. Representative immunoblot of n = 3. ( C ) RT-qPCR for the quantification of IL-6 mRNA levels in EA.hy926 cells transfected with the pCMV2-Smyd1-flag vector (|Smyd1) or the vector with a Smyd1 gene insert expressing a point mutation within the SET domain (|Smyd1 SET mutant). Expression values relative to control (transfection with vector lacking gene insert). n = 5, *** p < 0.001 using one-way ANOVA. ( D , E ) ELISA for the determination of IL-6 concentrations in supernatants of non-stimulated ( D ) and 1 ug/mL LPS-stimulated ( E ) EA.hy926 cells transfected with a pCMV2-Smyd1-flag vector (|Smyd1) or Smyd1-SET-mutant vector (|Smyd1 SET Mut). n = 5, *** p < 0.001 using one-way ANOVA. ( F ) Relative luciferase activity of EA.hy926 cells transfected with a pBABE lucIL-6 reporter alone (Control), in combination with LPS stimulation (LPS) or co-transfected with the pCMV2-Smyd1-flag (|Smyd1) or the vector with a mutated Smyd1 gene insert within the SET domain (|Smyd1 SET Mut). Expression values relative to control. n
