Explore
 Validate
 Learn
Learn Western blot
 Flow cytometry
Antibody data
- Antibody Data
- Antigen structure
- References [2]
- Comments [0]
- Validations
- Flow cytometry [2]
- Other assay [5]
Submit
Validation data
Reference
Comment
Report error
- Product number
- PA5-24695 - Provider product page

- Provider
- Invitrogen Antibodies
- Product name
- CTC1 Polyclonal Antibody
- Antibody type
- Polyclonal
- Antigen
- Synthetic peptide
- Reactivity
- Human
- Host
- Rabbit
- Isotype
- IgG
- Vial size
- 400 μL
- Concentration
- 0.5 mg/mL
- Storage
- Store at 4°C short term. For long term storage, store at -20°C, avoiding freeze/thaw cycles.
Submitted references Pol α-primase dependent nuclear localization of the mammalian CST complex.
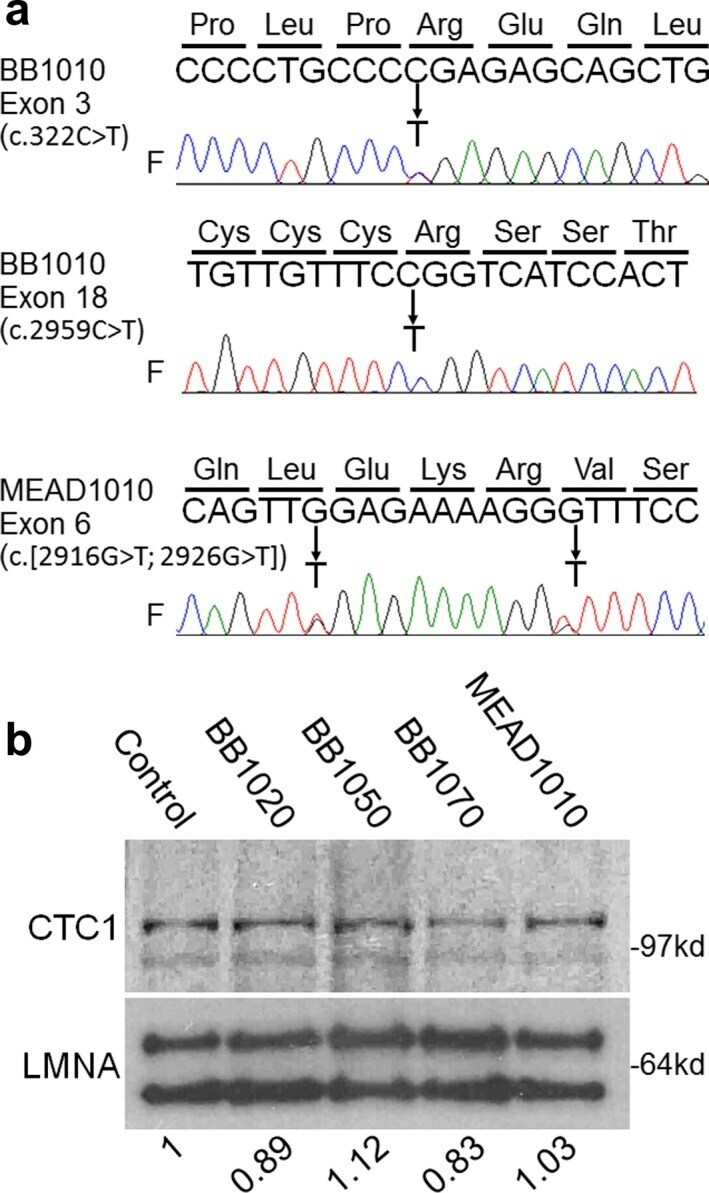
CTC1 mutations in a Brazilian family with progeroid features and recurrent bone fractures.
Kelich JM, Papaioannou H, Skordalakes E
Communications biology 2021 Mar 17;4(1):349
Communications biology 2021 Mar 17;4(1):349
CTC1 mutations in a Brazilian family with progeroid features and recurrent bone fractures.
Sargolzaeiaval F, Zhang J, Schleit J, Lessel D, Kubisch C, Precioso DR, Sillence D, Hisama FM, Dorschner M, Martin GM, Oshima J
Molecular genetics & genomic medicine 2018 Nov;6(6):1148-1156
Molecular genetics & genomic medicine 2018 Nov;6(6):1148-1156
No comments: Submit comment
Supportive validation
- Submitted by
- Invitrogen Antibodies (provider)
- Main image
- Experimental details
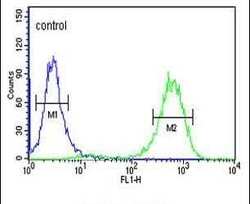
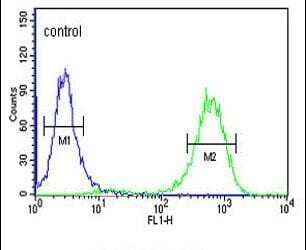
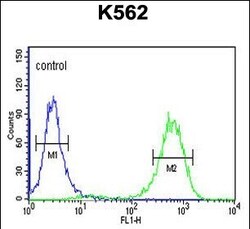
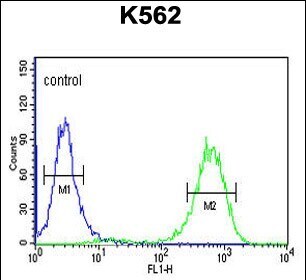
- Flow cytometry analysis of K562 cells using a CQ068 polyclonal antibody (Product # PA5-24695) (right) compared to a negative control cell (left) at a dilution of 1:10-50, followed by a FITC-conjugated goat anti-rabbit antibody
- Submitted by
- Invitrogen Antibodies (provider)
- Main image
- Experimental details
- Flow cytometry of CTC1 in K562 cells (right histogram). Samples were incubated with CTC1 polyclonal antibody (Product # PA5-24695) followed by FITC-conjugated goat-anti-rabbit secondary antibody. Negative control cell (left histogram).
Supportive validation
- Submitted by
- Invitrogen Antibodies (provider)
- Main image
- Experimental details
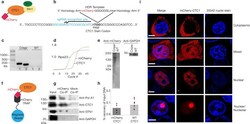
- Fig. 1 CRISPR Cas9 endogenous tagging of CTC1 reveals a dynamic intracellular localization. a An mCherry tag was genetically added to the N-terminal of CTC1. b The CRISPR Cas9 editing strategy is shown. A homology-directed repair template (HDR) was used in which the mCherry coding region was flanked by 1000 nucleotide homology arms coding for the CTC1 gene. The guide RNA utilized situates beside the ATG start codon to ensure N-terminal in-frame tagging of mCherry. c Genomic PCR of CRISPR edited and control cells was conducted using two sets of primers flanking the site of insertion of mCherry to confirm proper integration. d qPCR of reverse transcribed RNA obtained from the mCherry-CTC1 edited cell line quantifying mCherry and CTC1 signal. GAPDH is utilized as an endogenous control. e Western blot probing wild type HEK293T cells and CRISPR edited cells for mCherry reveals a single band of expected size. GAPDH was also probed for as a control. f Cartoon showing mCherry-Trap method to pull out CTC1 and associated proteins from cells. g Co-IP demonstrating mCherry-CTC1''s ability to associate with both PolA1 and STN1 but not GAPDH . h ChIP DNA recovery is shown for mCherry-CTC1 and wild type CTC1. i Confocal images of CRISPR-tagged mCherry-CTC1 cells. Within the same samples originating from single clones, mCherry CTC1 is seen as either predominantly nuclear, predominantly cytoplasmic, nucleolar, or a mixture of these conditions. 33342 was utilized to visualize chromatin.
- Submitted by
- Invitrogen Antibodies (provider)
- Main image
- Experimental details
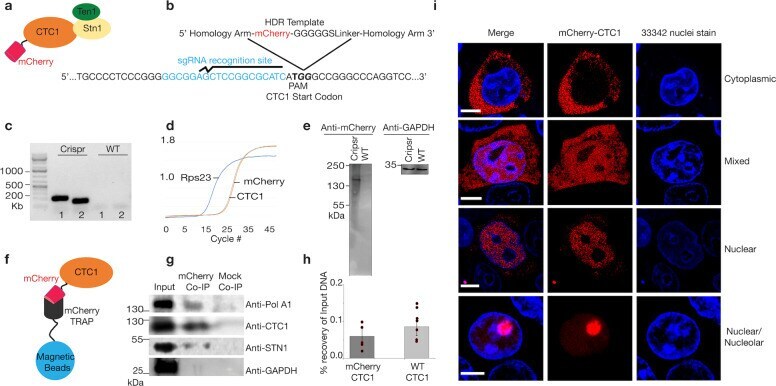
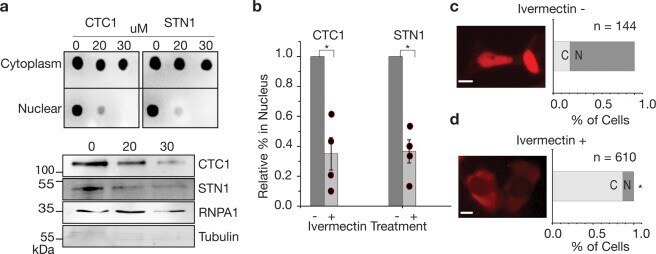
- Fig. 3 Nuclear import of CTC1/STN1 is reduced by Ivermectin treatment. a Cell lysate fractionation results for CTC1, and STN1 after being treated with Ivermectin at varying concentrations (muM). Dot blots as well as western blotting is shown to confirm the nuclear fractions. b Quantification of cell fractionation studies for ivermectin treatment. * p -value < 0.05. Student''s t -test results comparing control and ivermectin-treated cells are as follows. CTC1, p -value = 0.021392. STN1, p -value = 0.019171. c , d Epifluorescence microscopy analysis of mCherry-CTC1 or control cells after undergoing 20 muM ivermectin. Scale bar is ~5 mum.
- Submitted by
- Invitrogen Antibodies (provider)
- Main image
- Experimental details
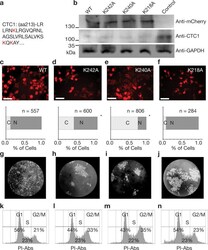
- Fig. 4 Mutant CTC1 constructs result in inhibited nuclear import and cell cycle defects. a The amino acids mutated are highlighted in red within the CTC1 amino acid sequence. b Western blotting results showing correct molecular weight and expression level of the mCherry-CTC1 construct after transfection into CTC1 knockdown cells. GAPDH was utilized as a loading control. c - f Epifluorescence microscopy analysis of mCherry-CTC1 mutants followed by quantification of the percentage of cells with predominately nuclear localization. * p -value < 0.001. When comparing K242A, K240A, and K218A to WT, using the binomial Z -test for proportions, the results are as follows. K242A, z = 11.1739 and p is
- Submitted by
- Invitrogen Antibodies (provider)
- Main image
- Experimental details
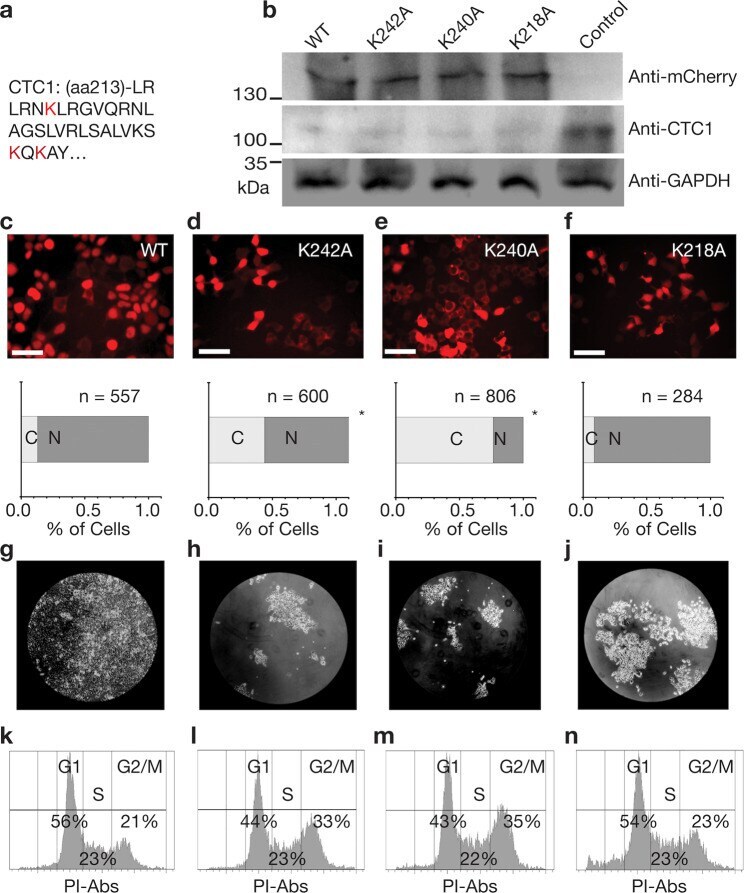
- Fig. 6 CTC1 mutants affect PolA1 binding and shRNA knockdown of PolA1 leads to less CTC1 nuclear accumulation. a Western blot data is shown for wild type and mutant CTC1 construct expressing cells after RFP-Trap was employed. IPs were then probed for PolA1, and CTC1. b Cell-fractionated Co-IP using RFP-beads incubated with nuclear and cytoplasmic extracts of WT HEK293T cells. c shRNA knockdown of PolA1 is quantified using reverse-transcribed DNA and qPCR as well as western blotting. Tubulin was utilized as loading controls. d Epifluorescence imaging of empty vector treated mCherry-CTC1 cells (control) and shRNAs targeting PolA1 (PolA1 KD). The value of z is -13.0997. The value of p is < 0.00001 (binomial Z -test for proportions). Scale bar is ~20 um. e Cell lysate fractionation western blotting was performed on WT HEK293T cells treated with either empty vector or shRNAs targeting PolA1 demonstrating reduction of nuclear CTC1 in the presence of PolA1 knockdown. First lane of each fraction represents control cells, while the second lane of each fraction represents the knockdown cell lines. f Quantification of the results of three trials of the experiment shown in e . * p -value < 0.001. The obtained p -value comparing conditions is 0.0185 from Student''s t -test.

- Submitted by
- Invitrogen Antibodies (provider)
- Main image
- Experimental details
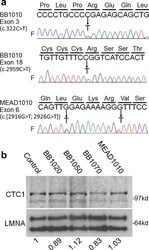
- Figure 2 Identification of CTC 1 variants. (a) Sequencing results of CTC 1 exons. CTC 1 variants found in BB 1010 and MEAD 1010 are shown as follows: arrows indicate heterozygous changes. F indicates forward sequencing. (b) Western analysis of nuclear proteins in the BB 1010 and MEAD pedigrees. The top panel shows the CTC 1 protein, and the bottom panel shows the lamin A/C protein ( LMNA ). Numbers indicate the CTC 1 protein levels relative to that of the control after normalization with the internal standard, lamin A/C