 Explore
 Validate
 Learn
Learn Immunocytochemistry
Antibody data
- Antibody Data
- Antigen structure
- References [1]
- Comments [0]
- Validations
- Immunocytochemistry [1]
- Immunohistochemistry [1]
- Other assay [2]
Submit
Validation data
Reference
Comment
Report error
- Product number
- PA5-59595 - Provider product page

- Provider
- Invitrogen Antibodies
- Product name
- LEUTX Polyclonal Antibody
- Antibody type
- Polyclonal
- Antigen
- Recombinant protein fragment
- Description
- Immunogen sequence: AKWKRQQRQQ MQTRPSLGPA NQTTSVKKEE TPSAITTANI RPVSPGISDA NDHDLREPSG IKNPGGASAS ARVSSW Highest antigen sequence identity to the following orthologs: Mouse - 30%, Rat - 29%.
- Reactivity
- Human
- Host
- Rabbit
- Isotype
- IgG
- Vial size
- 100 μL
- Concentration
- 0.1 mg/mL
- Storage
- Store at 4°C short term. For long term storage, store at -20°C, avoiding freeze/thaw cycles.
Submitted references Relationship of DUX4 and target gene expression in FSHD myocytes.
Chau J, Kong X, Viet Nguyen N, Williams K, Ball M, Tawil R, Kiyono T, Mortazavi A, Yokomori K
Human mutation 2021 Apr;42(4):421-433
Human mutation 2021 Apr;42(4):421-433
No comments: Submit comment
Supportive validation
- Submitted by
- Invitrogen Antibodies (provider)
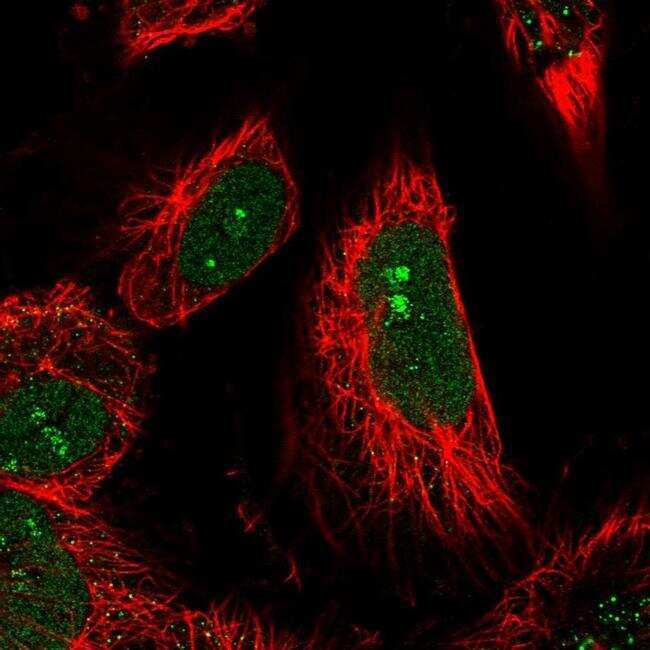
- Main image
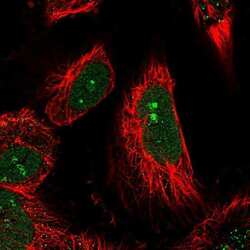
- Experimental details
- Immunofluorecent analysis of LEUTX in human cell line U-251 MG using LEUTX Polyclonal Antibody (Product # PA5-59595). Staining shows localization to nucleus and nucleoli.
Supportive validation
- Submitted by
- Invitrogen Antibodies (provider)
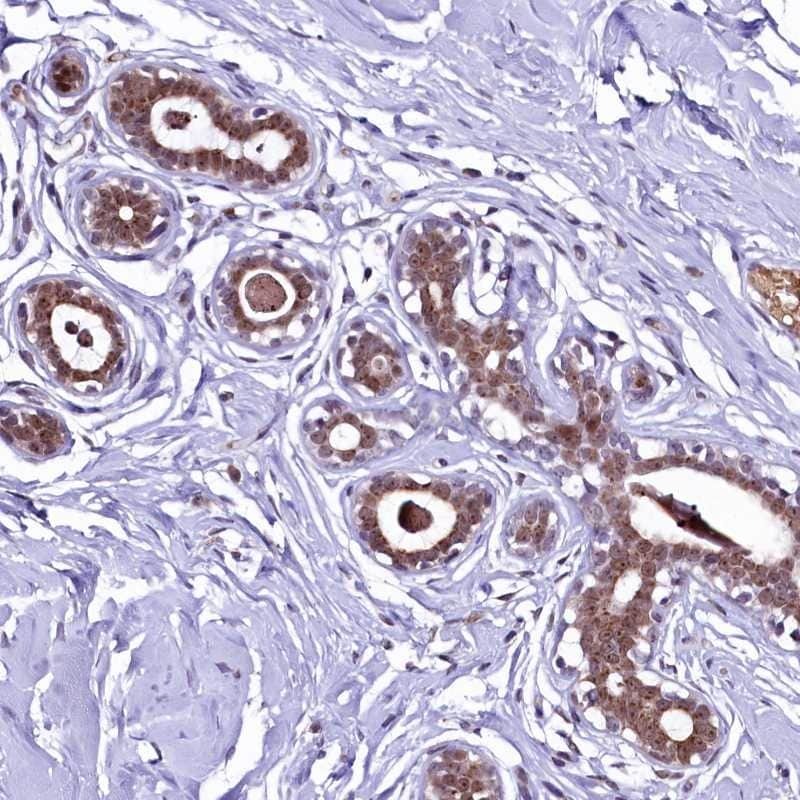
- Main image
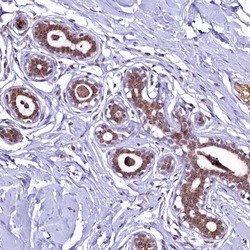
- Experimental details
- Immunohistochemical analysis of LEUTX in human breast using LEUTX Polyclonal Antibody (Product # PA5-59595) shows moderate cytoplasmic and nuclear positivity in glandular cells.
Supportive validation
- Submitted by
- Invitrogen Antibodies (provider)
- Main image
- Experimental details
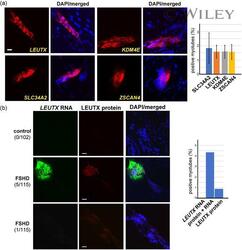
- 3 Figure Comparison with DUX4 target gene expression. (a) RNAScope staining of DUX4 target genes LEUTX , KDM4E , SLC34A2 , and ZSCAN4 . Merged images with DAPI (blue) staining are also shown, as indicated at the top. Unlike DUX4 , staining of target genes is spread along the myotube and in the cytoplasm. Approximately 2% of myotubes showed a positive RNAScope target gene signal (right). Scale bar = 20 mum. (b) Costaining of LEUTX RNAScope (green) and LEUTX protein immunofluorescence staining (red) in control and FSHD myotubes at Day 6 of differentiation. Merged images with DAPI (blue) staining are also shown, as indicated at the top. The middle panel shows a typical example of RNA and protein colocalization, whereas the bottom panel shows an example of weak protein staining without RNA. Numbers of myotubes with corresponding patterns in the total myotubes counted are shown in parentheses. Percentages of myotubes with LEUTX RNA only, LEUTX RNA and protein, or LEUTX protein only are shown on the right. Scale bar = 20 mum. DAPI, 4',6-diamidino-2-phenylindole; FSHD, facioscapulohumeral dystrophy

- Submitted by
- Invitrogen Antibodies (provider)
- Main image
- Experimental details
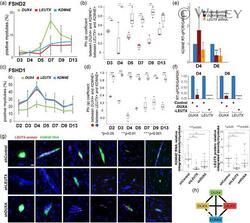
- 5 Figure KDM4E expression is regulated by DUX4 target transcription factors. (a) Individual time-course RNAScope analysis of DUX4, LEUTX , and KDM4E in FSHD2 myotubes for the indicated days of differentiation in Figure 4b. These include all the positive myotubes for each transcript. (b) Comparison of correlation between KDM4E and DUX4/LEUTX expression based on the FSHD2 RNAScope data in Figure 4b. The high phi values indicate a strong positive relationship between KDM4E and LEUTX RNA expression for the entire duration of the time course, with a perfect positive correlation ( phi = 1) on Day 4. Then, the phi values decrease but are more significant than those between KDM4E and DUX4 expression until Day 13. p Values (unpaired, two-tailed t test) are for the correlation differences of indicated genes on the same day. (c) Individual time-course RNAScope analysis of DUX4, LEUTX , and KDM4E in FSHD1 myotubes for the indicated days of differentiation in Figure 4f. These include all the positive myotubes for each transcript. (d) Comparison of correlation between KDM4E and DUX4/LEUTX expression based on the FSHD1 RNAScope data in Figure 4f. The results indicate a strong positive relationship between KDM4E and LEUTX RNA expression for the entire duration of the time course. The phi values between them are significantly higher than those between KDM4E and DUX4 expression. p Values (unpaired, two-tailed t test) are for the correlation differences of indicated genes on the same day. (e) T
