Explore
 Validate
 Learn
Learn35-4776-42
antibody from Invitrogen Antibodies
Targeting: FOXP3
AIID, DIETER, IPEX, JM2, PIDX, SCURFIN, XPID
 Flow cytometry
Antibody data
- Antibody Data
- Antigen structure
- References [48]
- Comments [0]
- Validations
- Flow cytometry [1]
- Other assay [42]
Submit
Validation data
Reference
Comment
Report error
- Product number
- 35-4776-42 - Provider product page

- Provider
- Invitrogen Antibodies
- Product name
- FOXP3 Monoclonal Antibody (PCH101), PE-Cyanine5.5, eBioscience™
- Antibody type
- Monoclonal
- Antigen
- Other
- Description
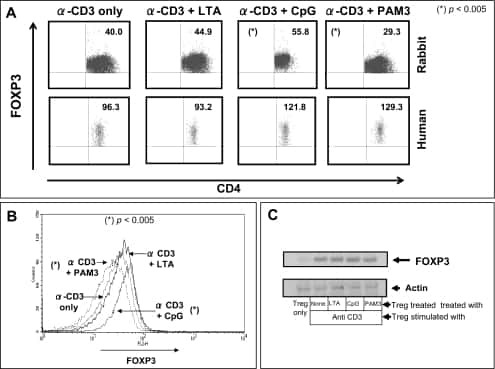
- Description: eBioscience offers a panel of monoclonal antibodies to different epitopes of human Foxp3, providing useful tools for investigating the complete expression pattern of Foxp3 at the protein level, and discerning the precise subsets of Foxp3^+ cells. The PCH101 antibody reacts with the amino terminus of human foxp3 protein also known as FORKHEAD BOX P3, SCURFIN, and JM2; cross reactivity of this antibody to other proteins has not been determined. Foxp3, a 49-55 kDa protein, is a member of the forkhead/winged-helix family of transcriptional regulators, and was identified as the gene defective in 'scurfy' (sf) mice. Constitutive high expression of Foxp3 mRNA has been shown in CD4+CD25+ regulatory T cells (Treg cells), and ectopic expression of foxp3 in CD4+CD25- cells imparts a Treg phenotype in these cells. Intracellular staining of human peripheral blood mononuclear cells (PBMCs) with PCH101 antibody using the anti-human Foxp3 Staining Set and protocol reveals approximately 0.5-4% of lymphocytes staining, with the majority of staining occurring in the CD25^bright population. This is subject to donor variability. PCH101 crossreacts with rhesus, chimpanzee and cynomolgus. We recommend the use of CD4 (OKT4, Product # 11-0048-42 , or RPA-T4, Product # 11-0049-42 , depending on the species) and CD25 (BC96, Product # 17-0259-42). Applications Reported: This PCH101 antibody has been reported for use in intracellular staining followed by flow cytometric analysis. Applications Tested: This PCH101 antibody has been pre-titrated and tested by intracellular staining and flow cytometric analysis of normal human peripheral blood cells using the Foxp3/Transcription Factor Staining Buffer Set and protocol. Please refer to Best Protocols for Staining Protocol (refer to Protocol B: One-step protocol for intracellular (nuclear) proteins). This can be used at 5 µL (0.125 µg) per test. A test is defined as the amount (µg) of antibody that will stain a cell sample in a final volume of 100 µL. Cell number should be determined empirically but can range from 10^5 to 10^8 cells/test. Light sensitivity: This tandem dye is sensitive photo-induced oxidation. Please protect this vial and stained samples from light. Fixation: Samples can be stored in IC Fixation Buffer (Product # 00-8222) (100 µL cell sample + 100 µL IC Fixation Buffer) or 1-step Fix/Lyse Solution (Product # 00-5333) for up to 3 days in the dark at 4°C with minimal impact on brightness and FRET efficiency/compensation. Some generalizations regarding fluorophore performance after fixation can be made, but clone specific performance should be determined empirically. Excitation: 488-561 nm; Emission: 695 nm; Laser: Blue Laser, Green Laser, Yellow-Green Laser.
- Reactivity
- Human
- Host
- Rat
- Isotype
- IgG
- Antibody clone number
- PCH101
- Vial size
- 100 Tests
- Concentration
- 5 µL/Test
- Storage
- 4° C, store in dark, DO NOT FREEZE!
Submitted references Metabolic Disturbance and Th17/Treg Imbalance Are Associated With Progression of Gingivitis.
Ex vivo expansion of dysfunctional regulatory T lymphocytes restores suppressive function in Parkinson's disease.
SARS-CoV-2 infection paralyzes cytotoxic and metabolic functions of the immune cells.
FABP4 facilitates inflammasome activation to induce the Treg/Th17 imbalance in preeclampsia via forming a positive feedback with IL-17A.
Longitudinal analysis shows durable and broad immune memory after SARS-CoV-2 infection with persisting antibody responses and memory B and T cells.
Longitudinal analysis shows durable and broad immune memory after SARS-CoV-2 infection with persisting antibody responses and memory B and T cells.
Soluble fibrinogen‑like protein 2 levels are decreased in patients with ischemic heart failure and associated with cardiac function.
Imbalance between T helper 1 and regulatory T cells plays a detrimental role in experimental Parkinson's disease in mice.
HDAC Inhibitor, CG-745, Enhances the Anti-Cancer Effect of Anti-PD-1 Immune Checkpoint Inhibitor by Modulation of the Immune Microenvironment.
Th17 reprogramming of T cells in systemic juvenile idiopathic arthritis.
Human Tumor-Infiltrating MAIT Cells Display Hallmarks of Bacterial Antigen Recognition in Colorectal Cancer.
Met-Flow, a strategy for single-cell metabolic analysis highlights dynamic changes in immune subpopulations.
Plasma Transfusion Promoted Reprogramming CD4(+) T Lymphocytes Immune Response in Severe Sepsis Mice Model Through Modulating the Exosome Protein Galectin 9.
Viable bacterial colonization is highly limited in the human intestine in utero.
Double negative T cells mediate Lag3-dependent antigen-specific protection in allergic asthma.
T-Lymphocyte Subset Distribution and Activity in Patients With Glaucoma.
IL-6 receptor blockade corrects defects of XIAP-deficient regulatory T cells.
Effect of TGF-β1 on blood CD4(+)CD25(high) regulatory T cell proliferation and Foxp3 expression during non-small cell lung cancer blood metastasis.
Fc Effector Function Contributes to the Activity of Human Anti-CTLA-4 Antibodies.
Follicular Regulatory T Cells Are Highly Permissive to R5-Tropic HIV-1.
ALS patients' regulatory T lymphocytes are dysfunctional, and correlate with disease progression rate and severity.
Serial immunomonitoring of cancer patients receiving combined antagonistic anti-CD40 and chemotherapy reveals consistent and cyclical modulation of T cell and dendritic cell parameters.
HDAC inhibition potentiates immunotherapy in triple negative breast cancer.
Alteration of Th17 and Foxp3(+) regulatory T cells in patients with unexplained recurrent spontaneous abortion before and after the therapy of hCG combined with immunoglobulin.
Blocking the recruitment of naive CD4(+) T cells reverses immunosuppression in breast cancer.
Equilibrium of Treg/Th17 cells of peripheral blood in syphilitic patients with sero-resistance.
Pulmonary sarcoidosis is associated with high-level inducible co-stimulator (ICOS) expression on lung regulatory T cells--possible implications for the ICOS/ICOS-ligand axis in disease course and resolution.
Human Head and Neck Squamous Cell Carcinoma-Associated Semaphorin 4D Induces Expansion of Myeloid-Derived Suppressor Cells.
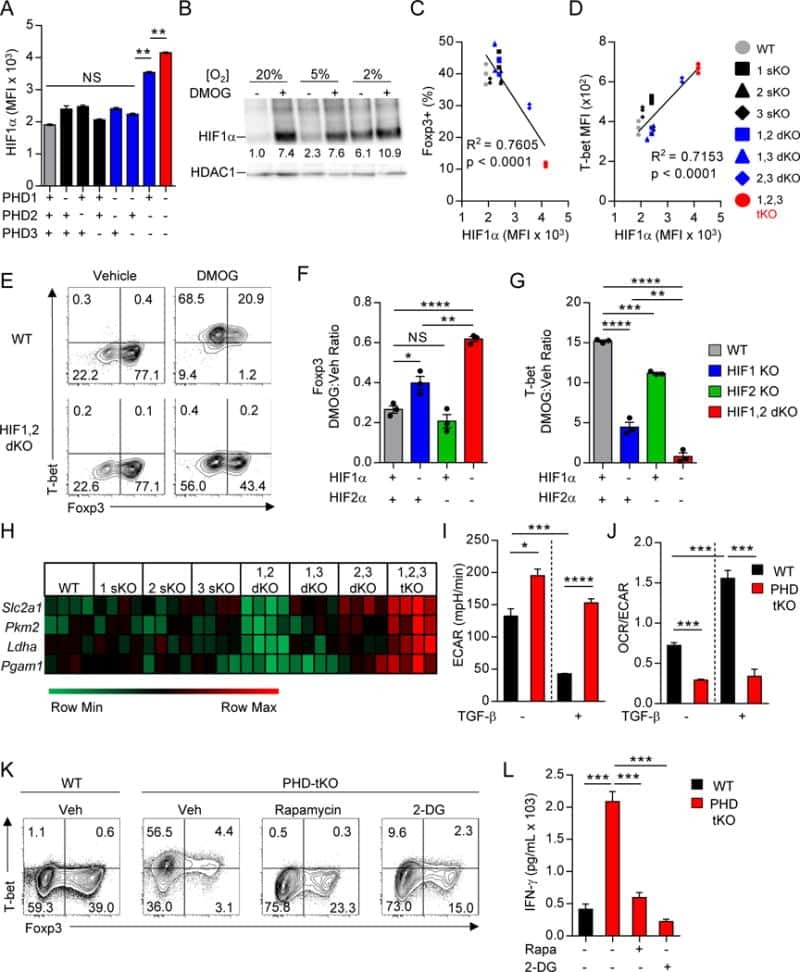
Oxygen Sensing by T Cells Establishes an Immunologically Tolerant Metastatic Niche.
Development of Type 2, But Not Type 1, Leprosy Reactions is Associated with a Severe Reduction of Circulating and In situ Regulatory T-Cells.
Glycolysis controls the induction of human regulatory T cells by modulating the expression of FOXP3 exon 2 splicing variants.
The role of endogenous IFN-β in the regulation of Th17 responses in patients with relapsing-remitting multiple sclerosis.
Human T cells upregulate CD69 after coculture with xenogeneic genetically-modified pig mesenchymal stromal cells.
Impaired function of regulatory T cells in cord blood of children of allergic mothers.
OMIP-006: phenotypic subset analysis of human T regulatory cells via polychromatic flow cytometry.
Engagement of TLR2 reverses the suppressor function of conjunctiva CD4+CD25+ regulatory T cells and promotes herpes simplex virus epitope-specific CD4+CD25- effector T cell responses.
CD40 signalling induces IL-10-producing, tolerogenic dendritic cells.
Safety and T cell modulating effects of high dose vitamin D3 supplementation in multiple sclerosis.
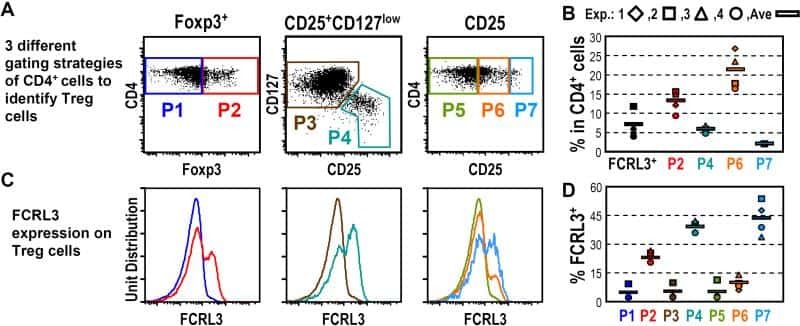
Fc receptor-like 3 protein expressed on IL-2 nonresponsive subset of human regulatory T cells.
IL-15 and dermal fibroblasts induce proliferation of natural regulatory T cells isolated from human skin.
FOXP3 regulates TLR10 expression in human T regulatory cells.
Mucosal but not peripheral FOXP3+ regulatory T cells are highly increased in untreated HIV infection and normalize after suppressive HAART.
IL-2 administration increases CD4+ CD25(hi) Foxp3+ regulatory T cells in cancer patients.
Foxp3+CD4+CD25+ T cells control virus-specific memory T cells in chimpanzees that recovered from hepatitis C.
Depletion of alloreactive T cells via CD69: implications on antiviral, antileukemic and immunoregulatory T lymphocytes.
Cutting edge: direct suppression of B cells by CD4+ CD25+ regulatory T cells.
Cutting edge: direct suppression of B cells by CD4+ CD25+ regulatory T cells.
Human CD4+ T cells express TLR5 and its ligand flagellin enhances the suppressive capacity and expression of FOXP3 in CD4+CD25+ T regulatory cells.
Wang W, Wang X, Lu S, Lv H, Zhao T, Xie G, Du Y, Fan Y, Xu L
Frontiers in immunology 2021;12:670178
Frontiers in immunology 2021;12:670178
Ex vivo expansion of dysfunctional regulatory T lymphocytes restores suppressive function in Parkinson's disease.
Thome AD, Atassi F, Wang J, Faridar A, Zhao W, Thonhoff JR, Beers DR, Lai EC, Appel SH
NPJ Parkinson's disease 2021 May 13;7(1):41
NPJ Parkinson's disease 2021 May 13;7(1):41
SARS-CoV-2 infection paralyzes cytotoxic and metabolic functions of the immune cells.
Singh Y, Trautwein C, Fendel R, Krickeberg N, Berezhnoy G, Bissinger R, Ossowski S, Salker MS, Casadei N, Riess O, Deutsche COVID-19 OMICS Initiate (DeCOI)
Heliyon 2021 Jun;7(6):e07147
Heliyon 2021 Jun;7(6):e07147
FABP4 facilitates inflammasome activation to induce the Treg/Th17 imbalance in preeclampsia via forming a positive feedback with IL-17A.
Chang GP, Yang XL, Liu W, Lin S, Yang SL, Zhao MY
Molecular therapy. Nucleic acids 2021 Jun 4;24:743-754
Molecular therapy. Nucleic acids 2021 Jun 4;24:743-754
Longitudinal analysis shows durable and broad immune memory after SARS-CoV-2 infection with persisting antibody responses and memory B and T cells.
Cohen KW, Linderman SL, Moodie Z, Czartoski J, Lai L, Mantus G, Norwood C, Nyhoff LE, Edara VV, Floyd K, De Rosa SC, Ahmed H, Whaley R, Patel SN, Prigmore B, Lemos MP, Davis CW, Furth S, O'Keefe J, Gharpure MP, Gunisetty S, Stephens KA, Antia R, Zarnitsyna VI, Stephens DS, Edupuganti S, Rouphael N, Anderson EJ, Mehta AK, Wrammert J, Suthar MS, Ahmed R, McElrath MJ
medRxiv : the preprint server for health sciences 2021 Jun 18;
medRxiv : the preprint server for health sciences 2021 Jun 18;
Longitudinal analysis shows durable and broad immune memory after SARS-CoV-2 infection with persisting antibody responses and memory B and T cells.
Cohen KW, Linderman SL, Moodie Z, Czartoski J, Lai L, Mantus G, Norwood C, Nyhoff LE, Edara VV, Floyd K, De Rosa SC, Ahmed H, Whaley R, Patel SN, Prigmore B, Lemos MP, Davis CW, Furth S, O'Keefe JB, Gharpure MP, Gunisetty S, Stephens K, Antia R, Zarnitsyna VI, Stephens DS, Edupuganti S, Rouphael N, Anderson EJ, Mehta AK, Wrammert J, Suthar MS, Ahmed R, McElrath MJ
Cell reports. Medicine 2021 Jul 20;2(7):100354
Cell reports. Medicine 2021 Jul 20;2(7):100354
Soluble fibrinogen‑like protein 2 levels are decreased in patients with ischemic heart failure and associated with cardiac function.
You Y, Huang S, Liu H, Fan C, Liu K, Wang Z
Molecular medicine reports 2021 Aug;24(2)
Molecular medicine reports 2021 Aug;24(2)
Imbalance between T helper 1 and regulatory T cells plays a detrimental role in experimental Parkinson's disease in mice.
Li W, Luo Y, Xu H, Ma Q, Yao Q
The Journal of international medical research 2021 Apr;49(4):300060521998471
The Journal of international medical research 2021 Apr;49(4):300060521998471
HDAC Inhibitor, CG-745, Enhances the Anti-Cancer Effect of Anti-PD-1 Immune Checkpoint Inhibitor by Modulation of the Immune Microenvironment.
Kim YD, Park SM, Ha HC, Lee AR, Won H, Cha H, Cho S, Cho JM
Journal of Cancer 2020;11(14):4059-4072
Journal of Cancer 2020;11(14):4059-4072
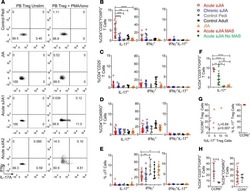
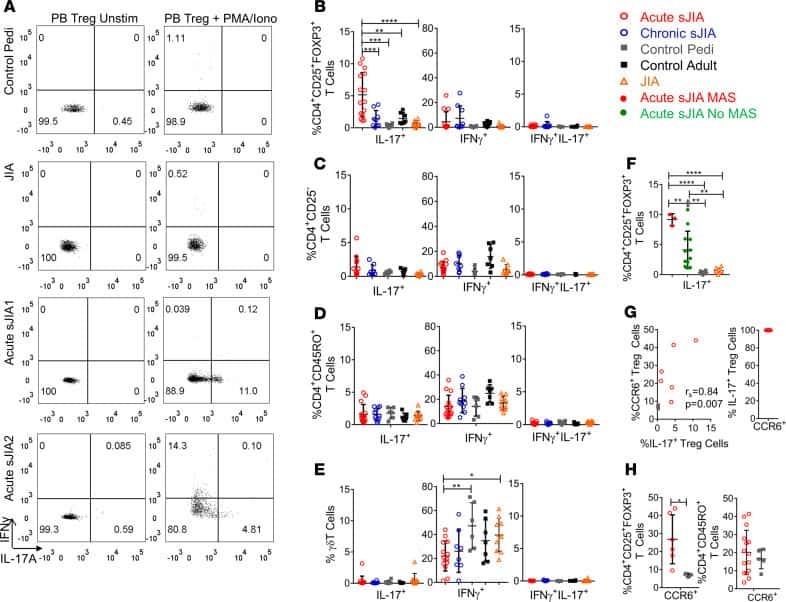
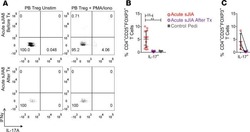
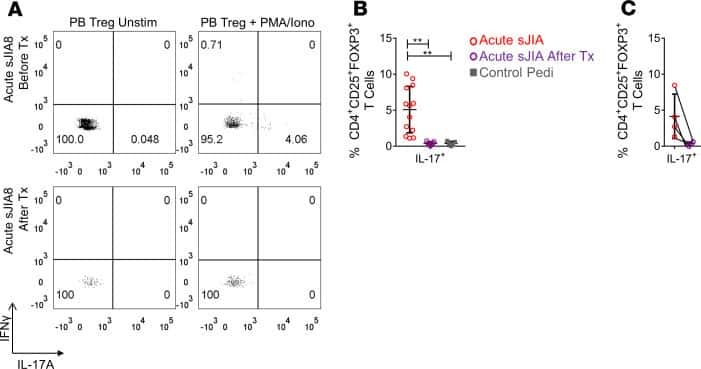
Th17 reprogramming of T cells in systemic juvenile idiopathic arthritis.
Henderson LA, Hoyt KJ, Lee PY, Rao DA, Jonsson AH, Nguyen JP, Rutherford K, Julé AM, Charbonnier LM, Case S, Chang MH, Cohen EM, Dedeoglu F, Fuhlbrigge RC, Halyabar O, Hazen MM, Janssen E, Kim S, Lo J, Lo MS, Meidan E, Son MBF, Sundel RP, Stoll ML, Nusbaum C, Lederer JA, Chatila TA, Nigrovic PA
JCI insight 2020 Mar 26;5(6)
JCI insight 2020 Mar 26;5(6)
Human Tumor-Infiltrating MAIT Cells Display Hallmarks of Bacterial Antigen Recognition in Colorectal Cancer.
Li S, Simoni Y, Becht E, Loh CY, Li N, Lachance D, Koo SL, Lim TP, Tan EKW, Mathew R, Nguyen A, Golovato J, Berkson JD, Prlic M, Lee B, Minot SS, Nagarajan N, Dey N, Tan DSW, Tan IB, Newell EW
Cell reports. Medicine 2020 Jun 23;1(3):100039
Cell reports. Medicine 2020 Jun 23;1(3):100039
Met-Flow, a strategy for single-cell metabolic analysis highlights dynamic changes in immune subpopulations.
Ahl PJ, Hopkins RA, Xiang WW, Au B, Kaliaperumal N, Fairhurst AM, Connolly JE
Communications biology 2020 Jun 12;3(1):305
Communications biology 2020 Jun 12;3(1):305
Plasma Transfusion Promoted Reprogramming CD4(+) T Lymphocytes Immune Response in Severe Sepsis Mice Model Through Modulating the Exosome Protein Galectin 9.
Zhang L, Zhang JP, Liu Y, Wang H, Cheng Y, Wang JH, Zhang WJ, Li ZZ, Guo JR
Cell transplantation 2020 Jan-Dec;29:963689720947347
Cell transplantation 2020 Jan-Dec;29:963689720947347
Viable bacterial colonization is highly limited in the human intestine in utero.
Rackaityte E, Halkias J, Fukui EM, Mendoza VF, Hayzelden C, Crawford ED, Fujimura KE, Burt TD, Lynch SV
Nature medicine 2020 Apr;26(4):599-607
Nature medicine 2020 Apr;26(4):599-607
Double negative T cells mediate Lag3-dependent antigen-specific protection in allergic asthma.
Tian D, Yang L, Wang S, Zhu Y, Shi W, Zhang C, Jin H, Tian Y, Xu H, Sun G, Liu K, Zhang Z, Zhang D
Nature communications 2019 Sep 18;10(1):4246
Nature communications 2019 Sep 18;10(1):4246
T-Lymphocyte Subset Distribution and Activity in Patients With Glaucoma.
Yang X, Zeng Q, Göktas E, Gopal K, Al-Aswad L, Blumberg DM, Cioffi GA, Liebmann JM, Tezel G
Investigative ophthalmology & visual science 2019 Mar 1;60(4):877-888
Investigative ophthalmology & visual science 2019 Mar 1;60(4):877-888
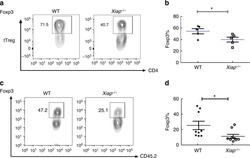
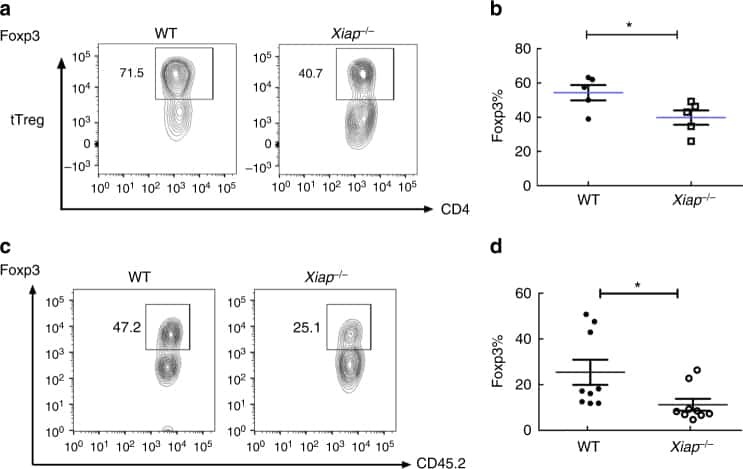
IL-6 receptor blockade corrects defects of XIAP-deficient regulatory T cells.
Hsieh WC, Hsu TS, Chang YJ, Lai MZ
Nature communications 2018 Jan 31;9(1):463
Nature communications 2018 Jan 31;9(1):463
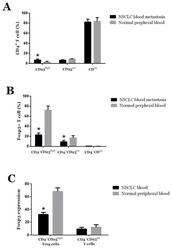
Effect of TGF-β1 on blood CD4(+)CD25(high) regulatory T cell proliferation and Foxp3 expression during non-small cell lung cancer blood metastasis.
Hu Y, Qi W, Sun L, Zhou H, Zhou B, Yang Z
Experimental and therapeutic medicine 2018 Aug;16(2):1403-1410
Experimental and therapeutic medicine 2018 Aug;16(2):1403-1410
Fc Effector Function Contributes to the Activity of Human Anti-CTLA-4 Antibodies.
Arce Vargas F, Furness AJS, Litchfield K, Joshi K, Rosenthal R, Ghorani E, Solomon I, Lesko MH, Ruef N, Roddie C, Henry JY, Spain L, Ben Aissa A, Georgiou A, Wong YNS, Smith M, Strauss D, Hayes A, Nicol D, O'Brien T, Mårtensson L, Ljungars A, Teige I, Frendéus B, TRACERx Melanoma, TRACERx Renal, TRACERx Lung consortia, Pule M, Marafioti T, Gore M, Larkin J, Turajlic S, Swanton C, Peggs KS, Quezada SA
Cancer cell 2018 Apr 9;33(4):649-663.e4
Cancer cell 2018 Apr 9;33(4):649-663.e4
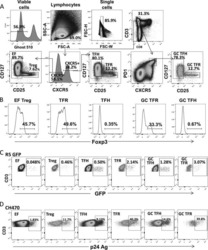
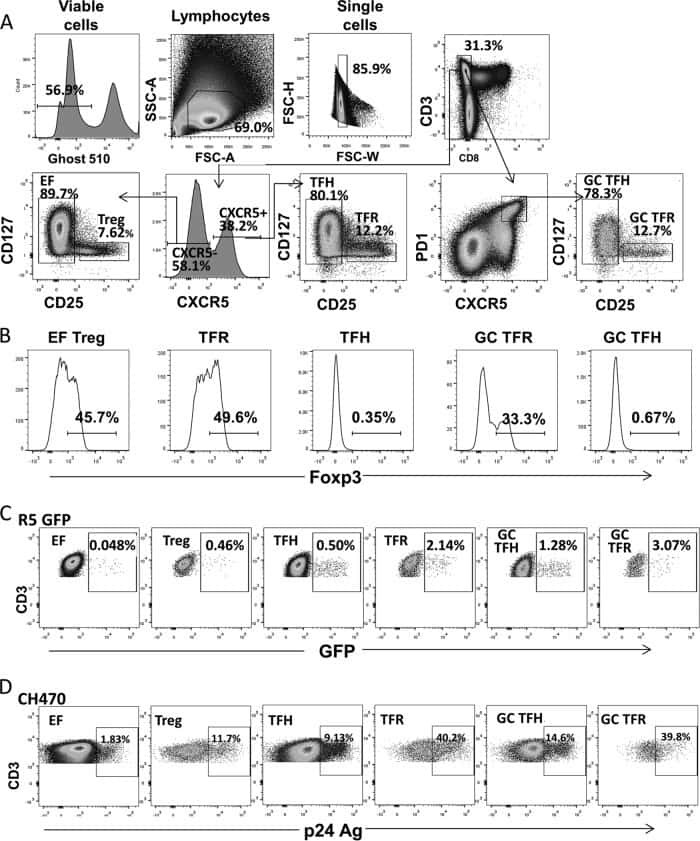
Follicular Regulatory T Cells Are Highly Permissive to R5-Tropic HIV-1.
Miller SM, Miles B, Guo K, Folkvord J, Meditz AL, McCarter MD, Levy DN, MaWhinney S, Santiago ML, Connick E
Journal of virology 2017 Sep 1;91(17)
Journal of virology 2017 Sep 1;91(17)
ALS patients' regulatory T lymphocytes are dysfunctional, and correlate with disease progression rate and severity.
Beers DR, Zhao W, Wang J, Zhang X, Wen S, Neal D, Thonhoff JR, Alsuliman AS, Shpall EJ, Rezvani K, Appel SH
JCI insight 2017 Mar 9;2(5):e89530
JCI insight 2017 Mar 9;2(5):e89530
Serial immunomonitoring of cancer patients receiving combined antagonistic anti-CD40 and chemotherapy reveals consistent and cyclical modulation of T cell and dendritic cell parameters.
McDonnell AM, Cook A, Robinson BWS, Lake RA, Nowak AK
BMC cancer 2017 Jun 15;17(1):417
BMC cancer 2017 Jun 15;17(1):417
HDAC inhibition potentiates immunotherapy in triple negative breast cancer.
Terranova-Barberio M, Thomas S, Ali N, Pawlowska N, Park J, Krings G, Rosenblum MD, Budillon A, Munster PN
Oncotarget 2017 Dec 26;8(69):114156-114172
Oncotarget 2017 Dec 26;8(69):114156-114172
Alteration of Th17 and Foxp3(+) regulatory T cells in patients with unexplained recurrent spontaneous abortion before and after the therapy of hCG combined with immunoglobulin.
Sha J, Liu F, Zhai J, Liu X, Zhang Q, Zhang B
Experimental and therapeutic medicine 2017 Aug;14(2):1114-1118
Experimental and therapeutic medicine 2017 Aug;14(2):1114-1118
Blocking the recruitment of naive CD4(+) T cells reverses immunosuppression in breast cancer.
Su S, Liao J, Liu J, Huang D, He C, Chen F, Yang L, Wu W, Chen J, Lin L, Zeng Y, Ouyang N, Cui X, Yao H, Su F, Huang JD, Lieberman J, Liu Q, Song E
Cell research 2017 Apr;27(4):461-482
Cell research 2017 Apr;27(4):461-482
Equilibrium of Treg/Th17 cells of peripheral blood in syphilitic patients with sero-resistance.
Zhao J, Ma J, Zhang X, Li Q, Yang X
Experimental and therapeutic medicine 2016 Jun;11(6):2300-2304
Experimental and therapeutic medicine 2016 Jun;11(6):2300-2304
Pulmonary sarcoidosis is associated with high-level inducible co-stimulator (ICOS) expression on lung regulatory T cells--possible implications for the ICOS/ICOS-ligand axis in disease course and resolution.
Sakthivel P, Grunewald J, Eklund A, Bruder D, Wahlström J
Clinical and experimental immunology 2016 Feb;183(2):294-306
Clinical and experimental immunology 2016 Feb;183(2):294-306
Human Head and Neck Squamous Cell Carcinoma-Associated Semaphorin 4D Induces Expansion of Myeloid-Derived Suppressor Cells.
Younis RH, Han KL, Webb TJ
Journal of immunology (Baltimore, Md. : 1950) 2016 Feb 1;196(3):1419-29
Journal of immunology (Baltimore, Md. : 1950) 2016 Feb 1;196(3):1419-29
Oxygen Sensing by T Cells Establishes an Immunologically Tolerant Metastatic Niche.
Clever D, Roychoudhuri R, Constantinides MG, Askenase MH, Sukumar M, Klebanoff CA, Eil RL, Hickman HD, Yu Z, Pan JH, Palmer DC, Phan AT, Goulding J, Gattinoni L, Goldrath AW, Belkaid Y, Restifo NP
Cell 2016 Aug 25;166(5):1117-1131.e14
Cell 2016 Aug 25;166(5):1117-1131.e14
Development of Type 2, But Not Type 1, Leprosy Reactions is Associated with a Severe Reduction of Circulating and In situ Regulatory T-Cells.
Vieira AP, Trindade MÂ, Pagliari C, Avancini J, Sakai-Valente NY, Duarte AJ, Benard G
The American journal of tropical medicine and hygiene 2016 Apr;94(4):721-7
The American journal of tropical medicine and hygiene 2016 Apr;94(4):721-7
Glycolysis controls the induction of human regulatory T cells by modulating the expression of FOXP3 exon 2 splicing variants.
De Rosa V, Galgani M, Porcellini A, Colamatteo A, Santopaolo M, Zuchegna C, Romano A, De Simone S, Procaccini C, La Rocca C, Carrieri PB, Maniscalco GT, Salvetti M, Buscarinu MC, Franzese A, Mozzillo E, La Cava A, Matarese G
Nature immunology 2015 Nov;16(11):1174-84
Nature immunology 2015 Nov;16(11):1174-84
The role of endogenous IFN-β in the regulation of Th17 responses in patients with relapsing-remitting multiple sclerosis.
Tao Y, Zhang X, Chopra M, Kim MJ, Buch KR, Kong D, Jin J, Tang Y, Zhu H, Jewells V, Markovic-Plese S
Journal of immunology (Baltimore, Md. : 1950) 2014 Jun 15;192(12):5610-7
Journal of immunology (Baltimore, Md. : 1950) 2014 Jun 15;192(12):5610-7
Human T cells upregulate CD69 after coculture with xenogeneic genetically-modified pig mesenchymal stromal cells.
Li J, Andreyev O, Chen M, Marco M, Iwase H, Long C, Ayares D, Shen Z, Cooper DK, Ezzelarab MB
Cellular immunology 2013 Sep-Oct;285(1-2):23-30
Cellular immunology 2013 Sep-Oct;285(1-2):23-30
Impaired function of regulatory T cells in cord blood of children of allergic mothers.
Hrdý J, Kocourková I, Prokešová L
Clinical and experimental immunology 2012 Oct;170(1):10-7
Clinical and experimental immunology 2012 Oct;170(1):10-7
OMIP-006: phenotypic subset analysis of human T regulatory cells via polychromatic flow cytometry.
Murdoch DM, Staats JS, Weinhold KJ
Cytometry. Part A : the journal of the International Society for Analytical Cytology 2012 Apr;81(4):281-3
Cytometry. Part A : the journal of the International Society for Analytical Cytology 2012 Apr;81(4):281-3
Engagement of TLR2 reverses the suppressor function of conjunctiva CD4+CD25+ regulatory T cells and promotes herpes simplex virus epitope-specific CD4+CD25- effector T cell responses.
Dasgupta G, Chentoufi AA, You S, Falatoonzadeh P, Urbano LA, Akhtarmalik A, Nguyen K, Ablabutyan L, Nesburn AB, BenMohamed L
Investigative ophthalmology & visual science 2011 May 17;52(6):3321-33
Investigative ophthalmology & visual science 2011 May 17;52(6):3321-33
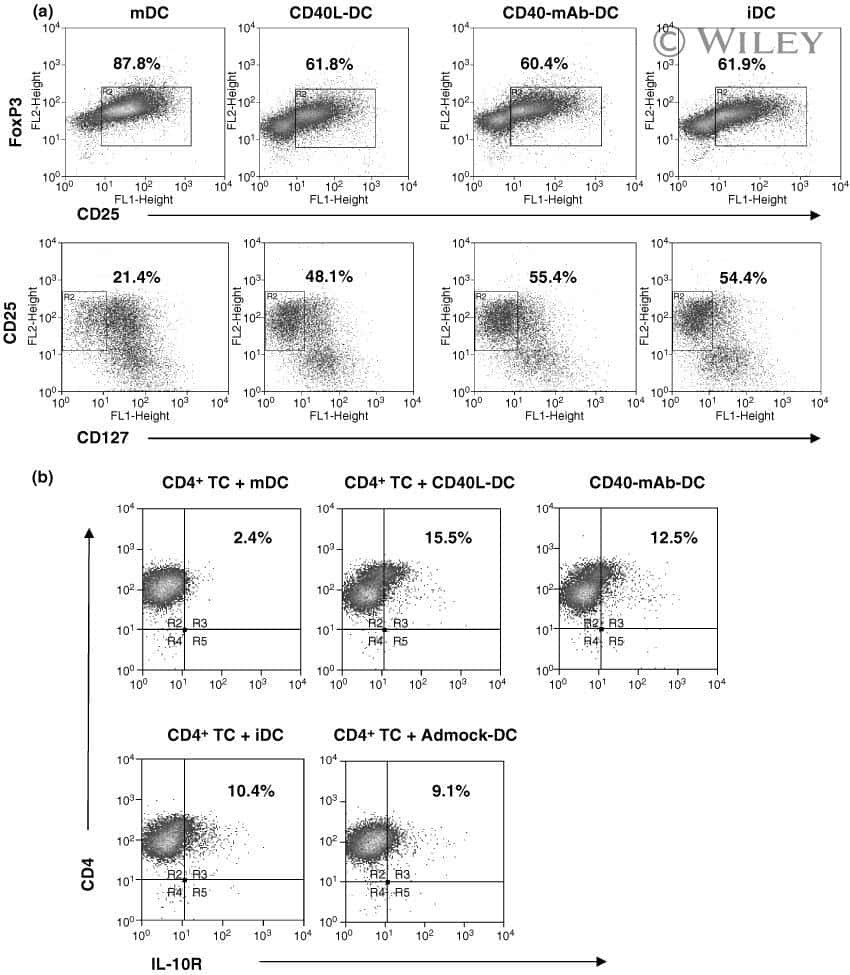
CD40 signalling induces IL-10-producing, tolerogenic dendritic cells.
Tuettenberg A, Fondel S, Steinbrink K, Enk AH, Jonuleit H
Experimental dermatology 2010 Jan;19(1):44-53
Experimental dermatology 2010 Jan;19(1):44-53
Safety and T cell modulating effects of high dose vitamin D3 supplementation in multiple sclerosis.
Smolders J, Peelen E, Thewissen M, Cohen Tervaert JW, Menheere P, Hupperts R, Damoiseaux J
PloS one 2010 Dec 13;5(12):e15235
PloS one 2010 Dec 13;5(12):e15235
Fc receptor-like 3 protein expressed on IL-2 nonresponsive subset of human regulatory T cells.
Nagata S, Ise T, Pastan I
Journal of immunology (Baltimore, Md. : 1950) 2009 Jun 15;182(12):7518-26
Journal of immunology (Baltimore, Md. : 1950) 2009 Jun 15;182(12):7518-26
IL-15 and dermal fibroblasts induce proliferation of natural regulatory T cells isolated from human skin.
Clark RA, Kupper TS
Blood 2007 Jan 1;109(1):194-202
Blood 2007 Jan 1;109(1):194-202
FOXP3 regulates TLR10 expression in human T regulatory cells.
Bell MP, Svingen PA, Rahman MK, Xiong Y, Faubion WA Jr
Journal of immunology (Baltimore, Md. : 1950) 2007 Aug 1;179(3):1893-900
Journal of immunology (Baltimore, Md. : 1950) 2007 Aug 1;179(3):1893-900
Mucosal but not peripheral FOXP3+ regulatory T cells are highly increased in untreated HIV infection and normalize after suppressive HAART.
Epple HJ, Loddenkemper C, Kunkel D, Tröger H, Maul J, Moos V, Berg E, Ullrich R, Schulzke JD, Stein H, Duchmann R, Zeitz M, Schneider T
Blood 2006 Nov 1;108(9):3072-8
Blood 2006 Nov 1;108(9):3072-8
IL-2 administration increases CD4+ CD25(hi) Foxp3+ regulatory T cells in cancer patients.
Ahmadzadeh M, Rosenberg SA
Blood 2006 Mar 15;107(6):2409-14
Blood 2006 Mar 15;107(6):2409-14
Foxp3+CD4+CD25+ T cells control virus-specific memory T cells in chimpanzees that recovered from hepatitis C.
Manigold T, Shin EC, Mizukoshi E, Mihalik K, Murthy KK, Rice CM, Piccirillo CA, Rehermann B
Blood 2006 Jun 1;107(11):4424-32
Blood 2006 Jun 1;107(11):4424-32
Depletion of alloreactive T cells via CD69: implications on antiviral, antileukemic and immunoregulatory T lymphocytes.
Hartwig UF, Nonn M, Khan S, Meyer RG, Huber C, Herr W
Bone marrow transplantation 2006 Feb;37(3):297-305
Bone marrow transplantation 2006 Feb;37(3):297-305
Cutting edge: direct suppression of B cells by CD4+ CD25+ regulatory T cells.
Lim HW, Hillsamer P, Banham AH, Kim CH
Journal of immunology (Baltimore, Md. : 1950) 2005 Oct 1;175(7):4180-3
Journal of immunology (Baltimore, Md. : 1950) 2005 Oct 1;175(7):4180-3
Cutting edge: direct suppression of B cells by CD4+ CD25+ regulatory T cells.
Lim HW, Hillsamer P, Banham AH, Kim CH
Journal of immunology (Baltimore, Md. : 1950) 2005 Oct 1;175(7):4180-3
Journal of immunology (Baltimore, Md. : 1950) 2005 Oct 1;175(7):4180-3
Human CD4+ T cells express TLR5 and its ligand flagellin enhances the suppressive capacity and expression of FOXP3 in CD4+CD25+ T regulatory cells.
Crellin NK, Garcia RV, Hadisfar O, Allan SE, Steiner TS, Levings MK
Journal of immunology (Baltimore, Md. : 1950) 2005 Dec 15;175(12):8051-9
Journal of immunology (Baltimore, Md. : 1950) 2005 Dec 15;175(12):8051-9
No comments: Submit comment
Supportive validation
- Submitted by
- Invitrogen Antibodies (provider)
- Main image

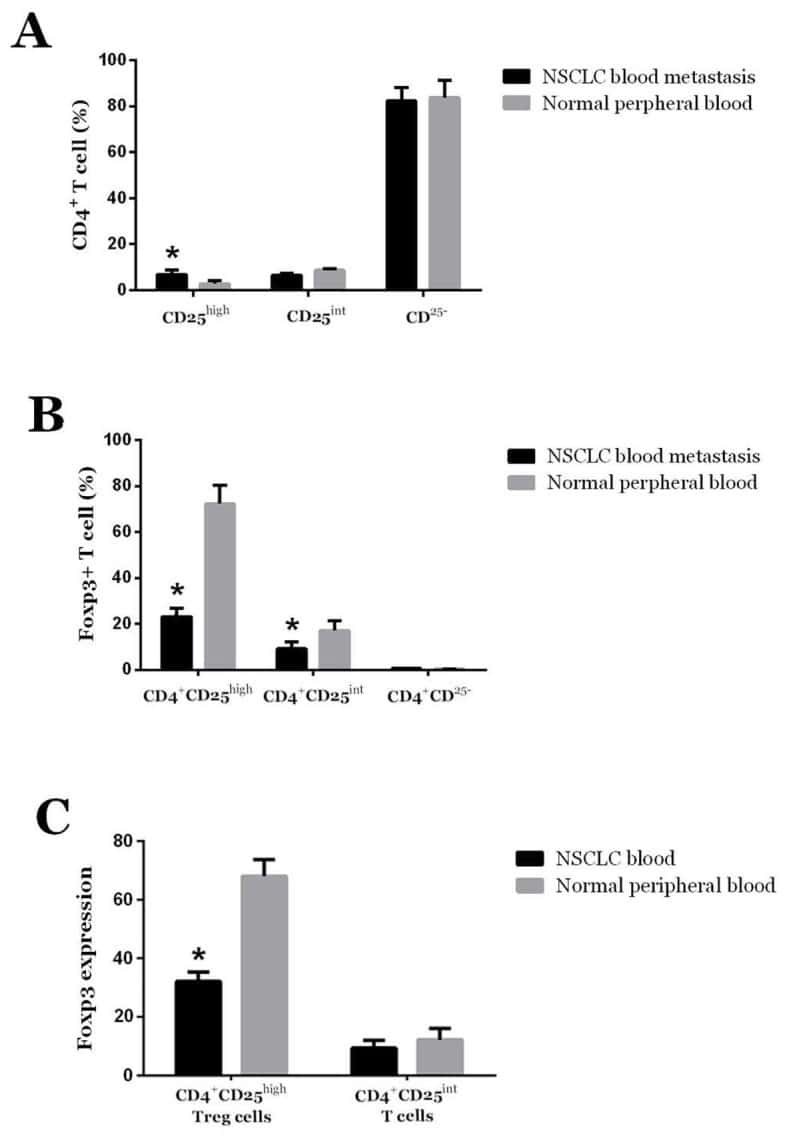
- Experimental details
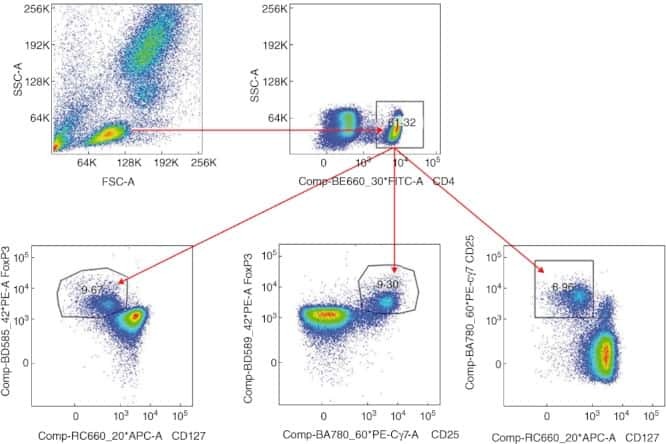
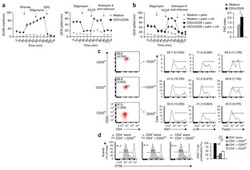
- Surface staining of normal human peripheral blood cells with Anti-Human CD4 APC (Product # 17-0048-42) followed by intracellular staining with Rat IgG2a K Isotype Control PE-Cyanine5-5 (Product # 35-4321-82) (left) or Anti-Human Foxp3 PE-Cyanine5-5 (right) using the Foxp3/Transcription Factor Staining Buffers (Product # 00-5523-00). Cells in the lymphocyte gate were used for analysis.

Supportive validation
- Submitted by
- Invitrogen Antibodies (provider)
- Main image
- Experimental details
- NULL
- Submitted by
- Invitrogen Antibodies (provider)
- Main image
- Experimental details
- NULL
- Submitted by
- Invitrogen Antibodies (provider)
- Main image
- Experimental details
- NULL

- Submitted by
- Invitrogen Antibodies (provider)
- Main image

- Experimental details
- NULL
- Submitted by
- Invitrogen Antibodies (provider)
- Main image
- Experimental details
- NULL
- Submitted by
- Invitrogen Antibodies (provider)
- Main image
- Experimental details
- NULL

- Submitted by
- Invitrogen Antibodies (provider)
- Main image
- Experimental details
- NULL
- Submitted by
- Invitrogen Antibodies (provider)
- Main image
- Experimental details
- NULL

- Submitted by
- Invitrogen Antibodies (provider)
- Main image

- Experimental details
- NULL
- Submitted by
- Invitrogen Antibodies (provider)
- Main image
- Experimental details
- NULL

- Submitted by
- Invitrogen Antibodies (provider)
- Main image
- Experimental details
- NULL

- Submitted by
- Invitrogen Antibodies (provider)
- Main image

- Experimental details
- NULL
- Submitted by
- Invitrogen Antibodies (provider)
- Main image

- Experimental details
- NULL
- Submitted by
- Invitrogen Antibodies (provider)
- Main image
- Experimental details
- NULL
- Submitted by
- Invitrogen Antibodies (provider)
- Main image
- Experimental details
- NULL
- Submitted by
- Invitrogen Antibodies (provider)
- Main image
- Experimental details
- NULL
- Submitted by
- Invitrogen Antibodies (provider)
- Main image
- Experimental details
- NULL
- Submitted by
- Invitrogen Antibodies (provider)
- Main image
- Experimental details
- NULL
- Submitted by
- Invitrogen Antibodies (provider)
- Main image
- Experimental details
- NULL
- Submitted by
- Invitrogen Antibodies (provider)
- Main image
- Experimental details
- NULL
- Submitted by
- Invitrogen Antibodies (provider)
- Main image
- Experimental details
- NULL
- Submitted by
- Invitrogen Antibodies (provider)
- Main image
- Experimental details
- NULL
- Submitted by
- Invitrogen Antibodies (provider)
- Main image
- Experimental details
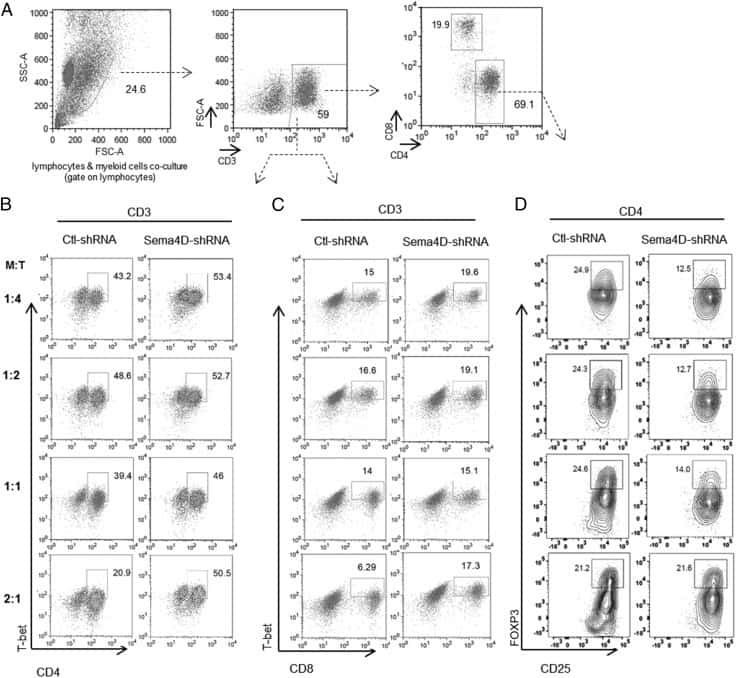
- Figure 4 Intra-tumoral Treg Cell Depletion Is Required for the Anti-tumor Activity of Anti-CTLA-4 Mice were treated with 200 mug of anti-CTLA-4 on days 6 and 9 after s.c. inoculation of MCA205 tumor cells (n = 9-21). TILs, LNs, and PBMCs were processed on day 11 and stained for flow cytometry analysis. (A) Percentage of FoxP3 + CD4 + Treg cells from total CD4 + T cells. (B) CD8 + /Treg cell ratio in the indicated sites. Horizontal bars represent the mean. (C) Percentage of Ki67-expressing CD4 + FoxP3 - and CD8 + T cells. (D) Percentage of CD4 + FoxP3 - and CD8 + T cells expressing IFNgamma following re-stimulation with phorbol 12-myristate 13-acetate (PMA) and ionomycin; cumulative data of three separate experiments. Error bars show +-SEM. (E and F) hFcgammaR mice were treated with anti-CTLA-4 on days 6, 9, and 12 after s.c. inoculation of MCA205 (50 mug/dose), MC38 (100 mug/dose) or B16 (200 mug/dose) tumor cells. (E) MCA205 tumor growth in individual hFcgammaR mice in each treatment group. Inset numbers show the fraction of mice with complete long-term response. (F) Kaplan-Meier curves demonstrating survival of hFcgammaR mice for each tumor model. The total number of mice in each treatment group is shown at the right. * p < 0.05; ** p < 0.01; *** p < 0.001; **** p < 0.0001. See also Figure S4 .
- Submitted by
- Invitrogen Antibodies (provider)
- Main image

- Experimental details
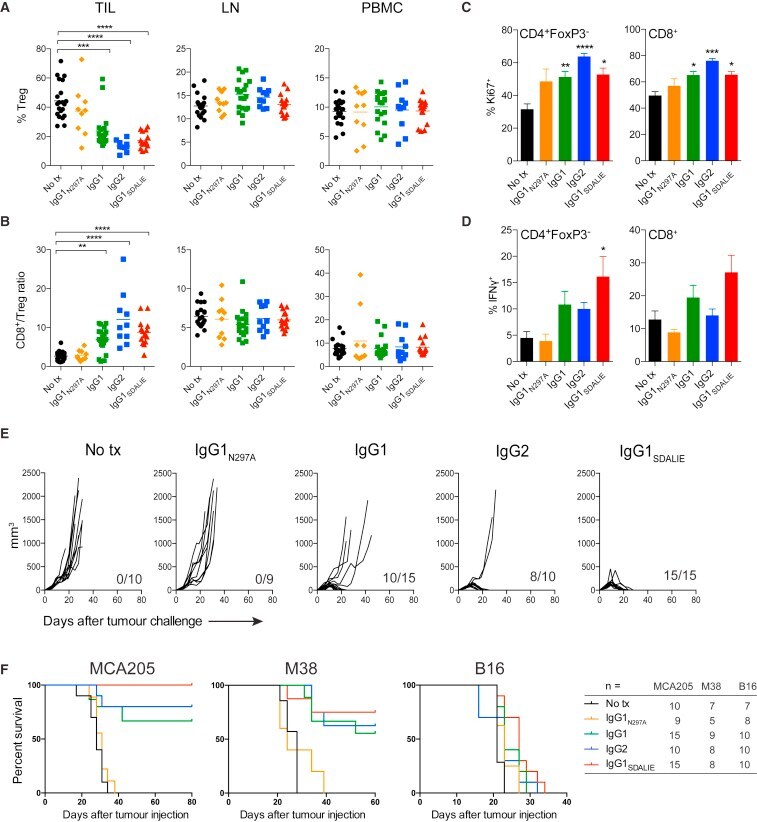
- Figure 1. Flow cytometric mapping of the CD4 + CD25 + Foxp3 + cells in peripheral blood withdrawn from the syphilitic patients with sero-resistance. Foxp3, forkhead box P3.
- Submitted by
- Invitrogen Antibodies (provider)
- Main image
- Experimental details
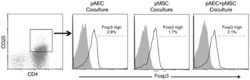
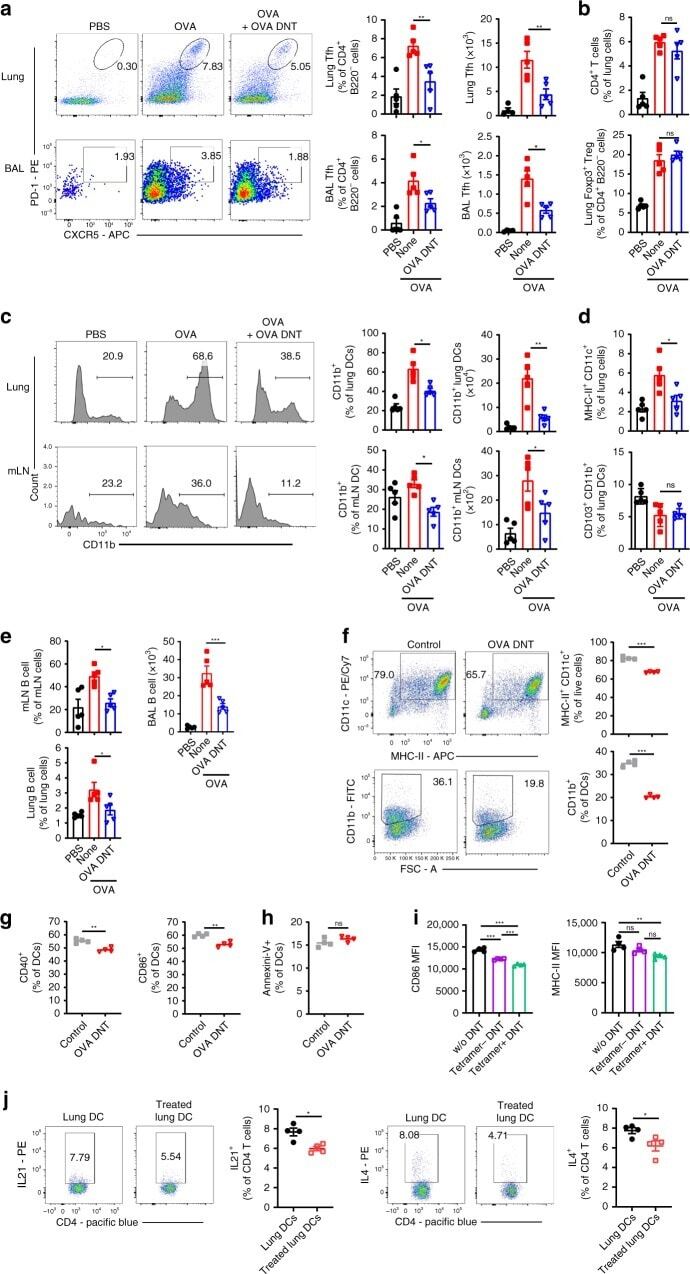
- Fig. 4 OVA DNT treatment selectively inhibited Tfh cells and CD11b + DCs. OVA-sensitized mice were treated with an intravenous transfer of OVA DNTs after the first OVA challenge. The mice were challenged daily for the next two days and sacrificed 48 h after the last aerosol challenge. a The lung and BALF Tfh cell (CD4 + B220 - CXCR5 + PD-1 + ), b CD4 + T cell (CD4 + B220 - ) and Treg cell (CD4 + B220 - Foxp3 + ) proportions were measured by flow cytometry. c The lung and mLN CD11b + DC (CD11c + MHC-II + CD11b + ), d DC (CD11c + MHC-9II + ) and CD103 + DC (CD11c + MHC-II + CD103 + CD11b - ) proportions were measured by flow cytometry. e The proportions of B cells (B220 + CD4 - ) in the mLN (mediastinum lymph node), BALF and lungs were measured by flow cytometry. OVA-stimulated bone marrow cells were cocultured with OVA DNTs and stimulated with GM-CSF (20 ng/ml) for 3 days to test the direct effect of OVA DNTs on OVA DC proliferation and differentiation. f The proportions of bone marrow-derived DCs and CD11b+ DCs were measured by flow cytometry. The direct effects of OVA DNTs on g costimulatory molecule expression and h apoptosis in DCs were measured by flow cytometry. i OVA tetramer + and tetramer - DNT cells were sorted by flow cytometry from OVA-primed DNT cells. Tetramer + or tetramer - DNT cells were cocultured with lung DCs from allergic asthma mice for 3 days. The MFIs of CD86 and MHC-II in DCs were measured by flow cytometry. j Lung DCs (2.5 x 10 4 ) from OVA DNT cell-t
- Submitted by
- Invitrogen Antibodies (provider)
- Main image

- Experimental details
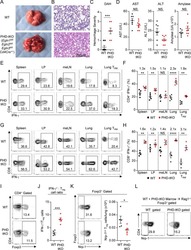
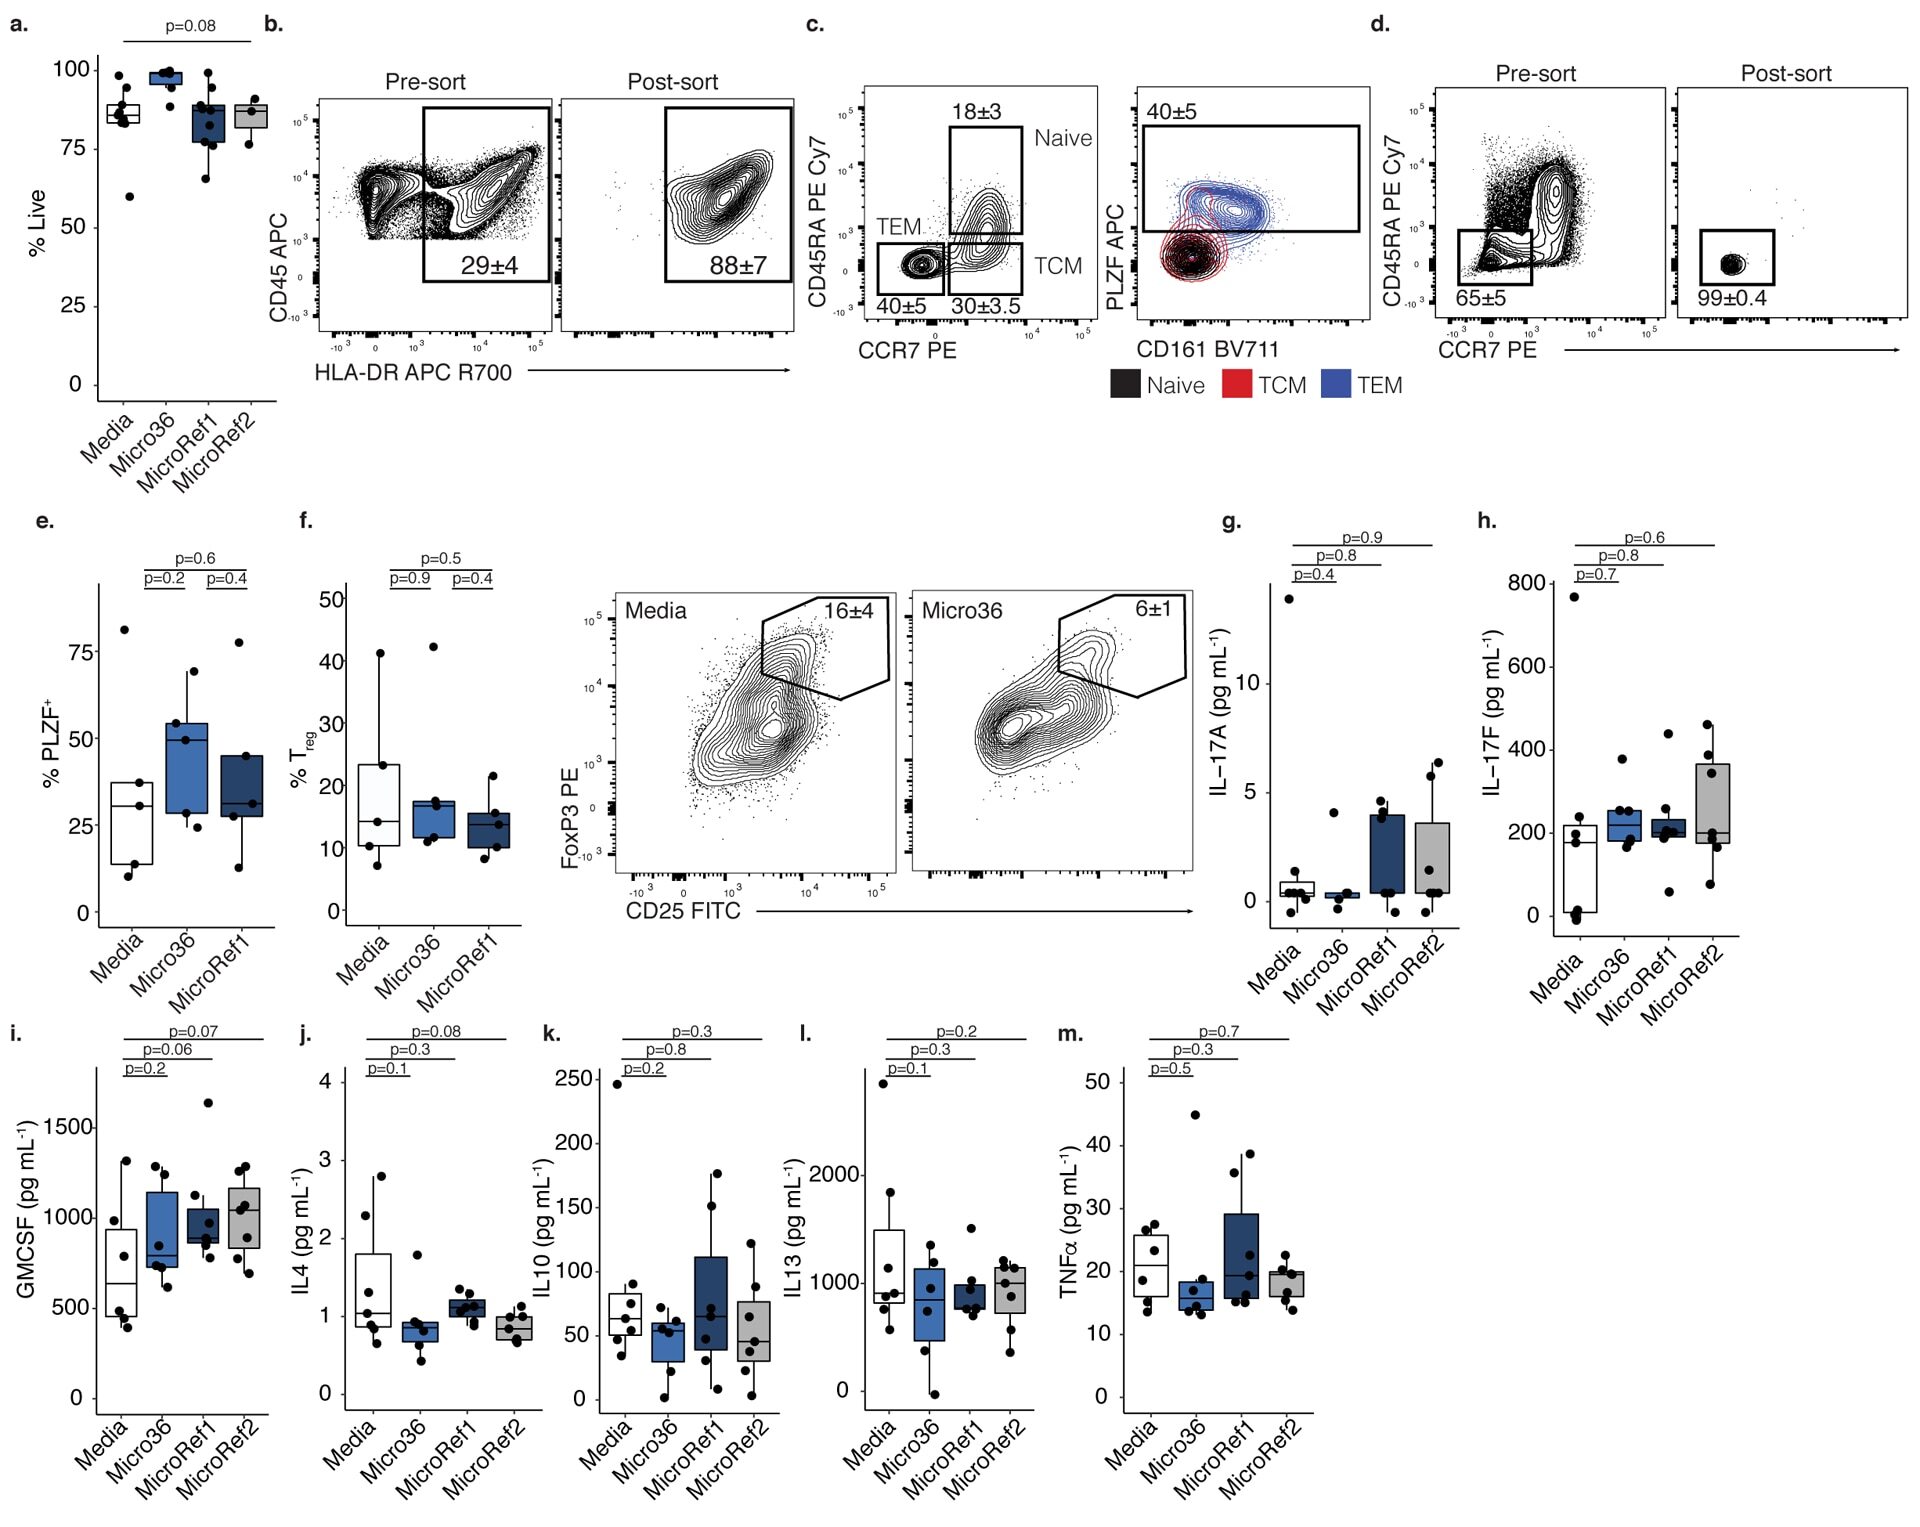
- Extended Data 9. Fetal Micrococcus isolate promotes distinct APC and T cell phenotypes. a. Proportion of live cells after treatment with media (n=9) or Micrococcus (Micro36 n=6, MicroRef1 n=9, MicroRef2 n=3) strains, where n represents biologically independent fetal specimens for the indicated treatment. ANOVA test for significance. b. HLA-DR + CD45 + lin - cells pre- (left) and post- (right) fluorescence activated cell sorting (FACS). c. Proportion of naive (CD45RA + CCR7 + ), central memory (TCM, CD45RA - CCR7 + ), and effector memory T cells (TEM, CD45RA - CCR7 - ) among live, TCRbeta + , CD4 + cells (left panel) and PLZF and CD161 expression among memory subsets, numbers indicate proportion in TEM (right panel). d. Pre- (left) and post- (right) FACS of effector memory T cells. e. Proportion of PLZF + T cells or f. left, proportion of CD25 hi FoxP3 + regulatory T cells (T regs ) and right, representative flow plots of FoxP3 and CD25 expression among intestinal live, TCRbeta + , CD4 + , Valpha7.2 - , cells after exposure to splenic APCs pretreated with media or Micrococcus (Micro36, MicroRef1) strains for n=5 biologically independent fetal specimens. Concentration of g. IL-17A, h. IL-17F, i. GM-CSF, j. IL-4, k. IL-10, l. IL-13, m. TNFalpha in culture supernatants of lamina propria T cell co-cultures with splenic antigen presenting cells pre-exposed to media (n=7) or Micrococcus (Micro36 n=6, MicroRef1 n=7, MicroRef2 n=7) strains, where n represents biologically independent
- Submitted by
- Invitrogen Antibodies (provider)
- Main image
- Experimental details
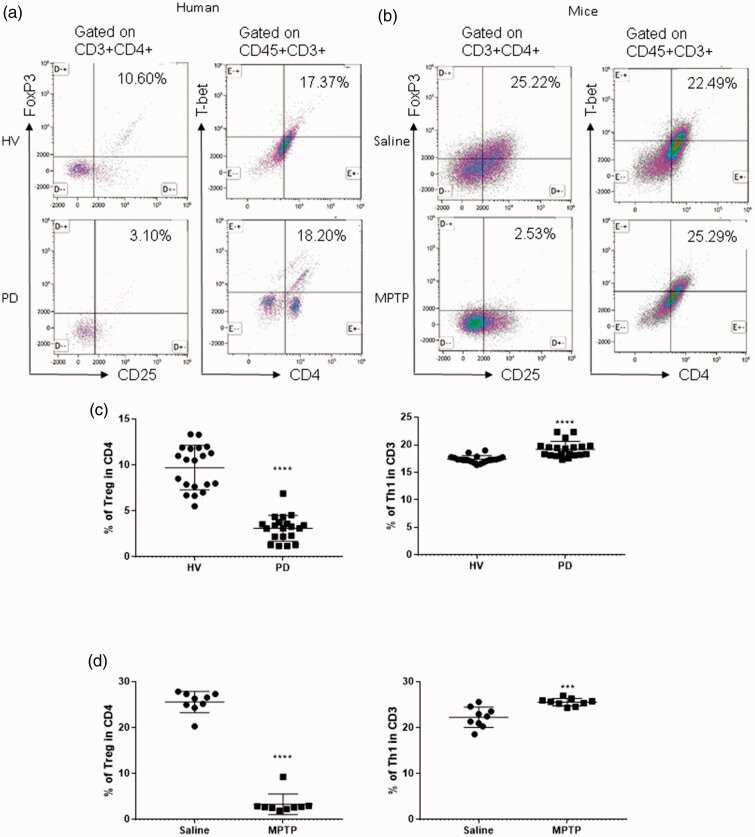
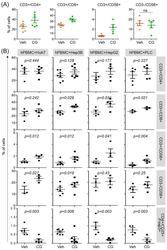
- Figure 1. Patients with Parkinson's disease (PD) and mice with experimental PD exhibit decreased regulatory T (Treg) and increased T helper 1 (Th1) cell numbers in the blood. Treg cells were defined as CD3+CD4+CD25+FoxP3+ cells, whereas Th1 cells were identified as CD3+CD4+T-bet+ cells. (a) Representative plots of Treg and Th1 cells in patients with PD and healthy volunteers (HVs). (b) Representative plots of Treg and Th1 cells in control mice (Saline) and 1-methyl-4-phenyl-1,2,3,6-tetrahydropyridine (MPTP)-treated mice. (c) Patients with PD exhibited lower Treg cell levels and greater Th1 cell levels in the blood than HVs. n = 20. ****, p < 0.0001 by a two-tailed Student's t tests. (d) MPTP-induced experimental PD mice had fewer Treg and more Th1 cells in the circulation than saline-treated mice. n = 9/group in each experiment performed in triplicate. ***, p < 0.001; ****, p < 0.0001, according to Student's t test.
- Submitted by
- Invitrogen Antibodies (provider)
- Main image
- Experimental details
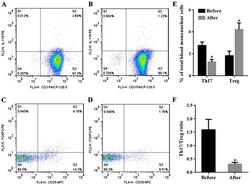
- Figure 1. The percentage of T helper 17 (Th17) and regulatory T (Treg) cells in peripheral blood mononuclear cells (PBMCs) and the Th17/Treg ratio varies in patients with a successful pregnancy after immunotherapy. The percentage of Th17 and Treg cells in PBMCs were detected by flow cytometry in patients with unexplained recurrent spontaneous abortion (URSA) before and after therapy. Representative CD3 + CD8 + IL-17A + flow cytometry plots from patients with URSA are shown (A) before and (B) after therapy. Representative CD4 + CD25 + Foxp3 + flow cytometry plots from patients with URSA are shown (C) before and (D) after therapy. (E) The percentage of Th17 cells in PBMCs significantly decreased after therapy. The percentage of Treg cells in PBMCs significantly increased after therapy (*P

- Submitted by
- Invitrogen Antibodies (provider)
- Main image
- Experimental details
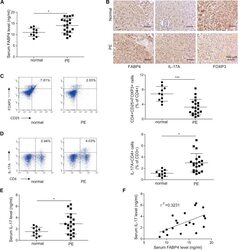
- Figure 1 Elevation of FABP4 is accompanied with Treg/Th17 imbalance in PE (A) The serum level of FABP4 was determined by ELISA (normal pregnant women, n = 10; PE, n = 20). (B) The immunoreactivities of FABP4, IL-17A, and FOXP3 in placental tissues were monitored by IHC analysis. (C and D) The percentages of Treg (C) and Th17 cells (D) in peripheral blood were assessed by FACS (normal pregnant women, n = 10; PE, n = 20). (E) The serum level of IL-17A was determined by ELISA (normal pregnant women, n = 10; PE, n = 20). (F) Pearson's correlation analysis between IL-17A and FABP4 expression. Data were representative images. *p < 0.05.

- Submitted by
- Invitrogen Antibodies (provider)
- Main image
- Experimental details
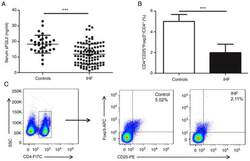
- Figure 1. Serum sFGL2 levels and circulating Tregs frequencies are decreased in patients with IHF. (A) Serum sFGL2 levels were analyzed by ELISA. (B) The frequency of Tregs was compared in each group. (C) Representative FSC/SSC pseudo-color density image shows the gated CD4 + T cells and representative fluorescence-activated cell sorting plots of CD4 + CD25 + Foxp3 + Tregs from a single patient in each group. ***P

- Submitted by
- Invitrogen Antibodies (provider)
- Main image
- Experimental details
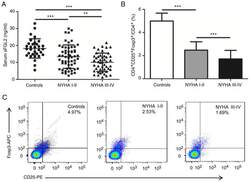
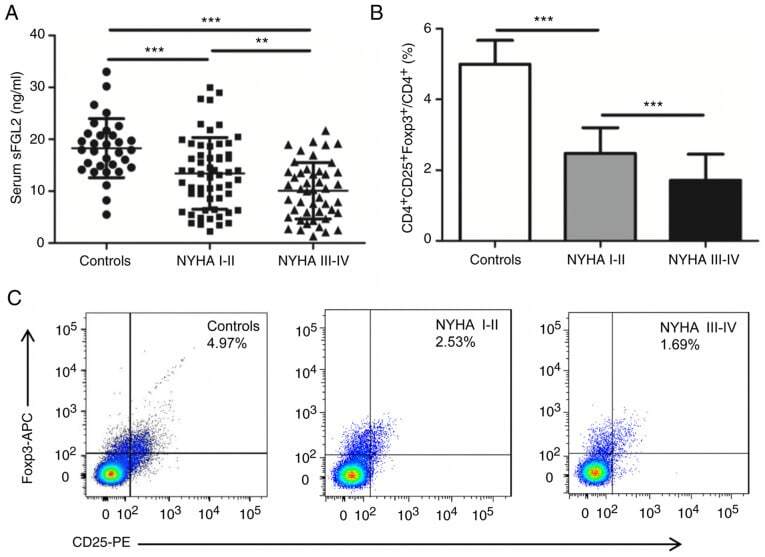
- Figure 2. Serum sFGL2 levels and circulating Tregs frequencies are decreased with the elevation of NYHA classification. (A) sFGL2 levels were analyzed by ELISA. (B) The proportion of Tregs was compared in each subgroup. (C) Representative fluorescence-activated cell sorting plots of CD4 + CD25 + Foxp3 + Tregs from a single person in each subgroup. **P
- Submitted by
- Invitrogen Antibodies (provider)
- Main image
- Experimental details
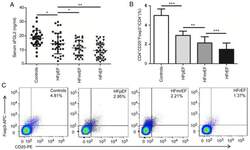
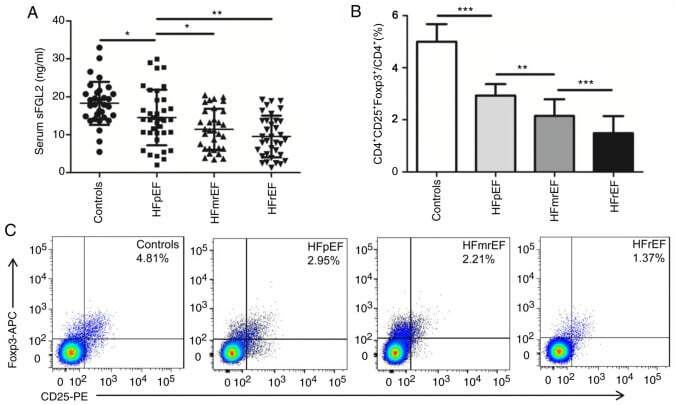
- Figure 3. Serum sFGL2 levels and circulating Tregs frequencies are decreased with the reduction of LVEF. (A) sFGL2 levels were analyzed by ELISA. (B) The proportion of Tregs was compared in each subgroup. (C) Representative fluorescence-activated cell sorting plots of CD4 + CD25 + Foxp3 + Tregs from a single person in each subgroup. *P
- Submitted by
- Invitrogen Antibodies (provider)
- Main image

- Experimental details
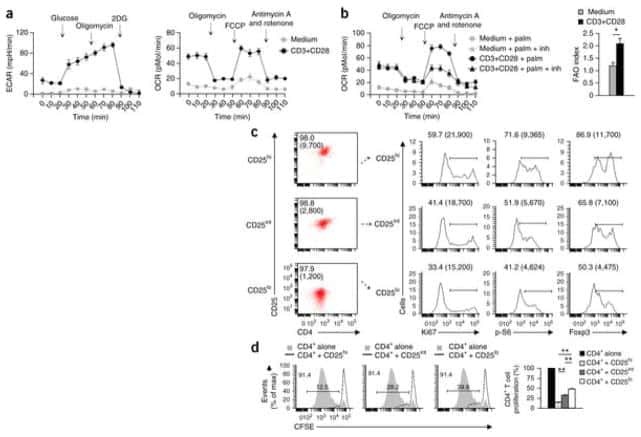
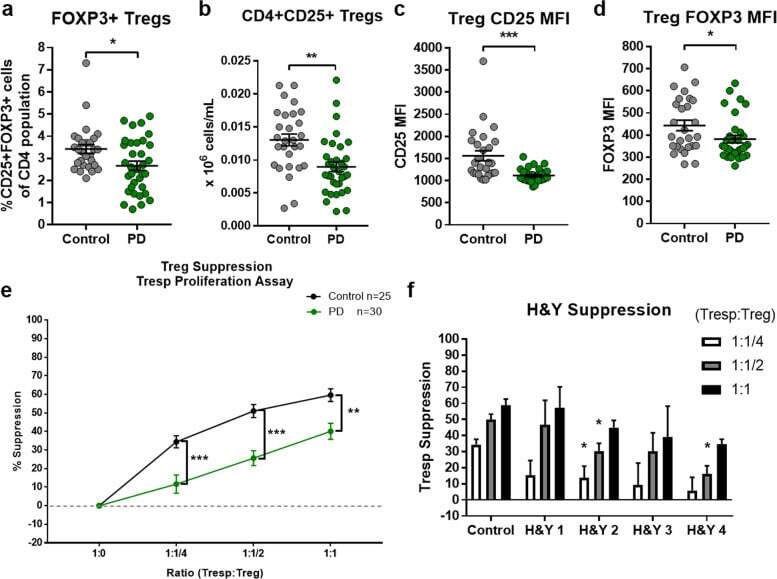
- Fig. 3 Investigation into PD Treg populations shows reduced numbers and impaired function. The number of Tregs in PD patients are decreased via a flow cytometric analysis of CD4 + CD25 + FOXP3 + cells as a percent of total CD4 + population and b counting of viable CD4 + CD25 + immune cells following bead/column-based isolation methods from peripheral blood (C n = 28, PD n = 34). Treg health and function markers were deceased in PD patients compared to controls when examining c CD25 protein MFI and d FOXP3 protein MFI from CD4 + CD25 + FOXP3 + cells during flow cytometry (C n = 28, PD n = 34). e Treg suppression of Tresp proliferation is impaired in PD patients compared to controls at ratios (Tresp:Treg) of 1:1, 1:1/2, and 1:1/4 (C n = 25, PD n = 30). f The suppressive capacity of PD Tregs on Tresp proliferation decreases with increasing PD disease burden using the H&Y disease scale (C n = 25, H&Y1 n = 4, H&Y2 n = 17, H&Y3 n = 5, H&Y4 n = 4). Numbers shown as averages +- SEM with Student's t test or one-way ANOVA with appropriate post hoc testing for multiple comparisons as appropriate. P -values are * p < 0.05, ** p < 0.01, and *** p < 0.001.
- Submitted by
- Invitrogen Antibodies (provider)
- Main image
- Experimental details
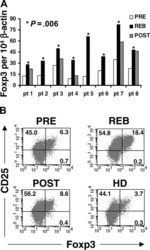
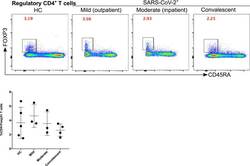
- Figure 5 Kinetics of regulatory T cells is not affected significantly in mild, moderate and convalescent patients. Foxp3 + expression on CD19 - CD3 + CD4 + CD45RA - T cells to identify the regulatory T cells in HC, outpatient, outpatient and convalescent (upper FACS panel). There was a statistically significant difference among HC, mild, moderate and convalescent (upper FACS panel). Figure 5
- Submitted by
- Invitrogen Antibodies (provider)
- Main image
- Experimental details
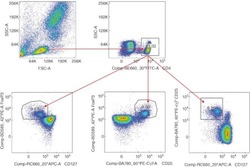
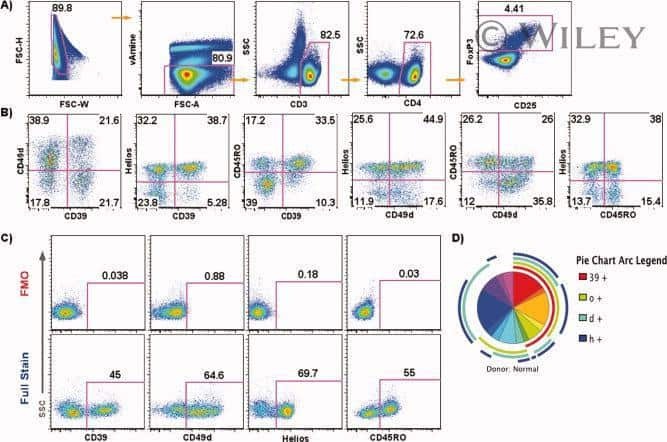
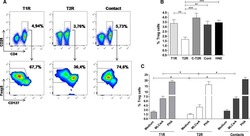
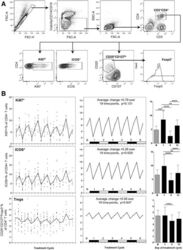
- Fig. 6 a Representative flow cytometry data, demonstrating the gating strategy used on PBMC for Treg identification and analysis. FSC-area vs. FSC-height was used for doublet discrimination. A ""dump"" channel was used to gate out dead cells (LIVE/DEAD fixable viability stain), CD14 + monocytes and CD19 + B cells, and lymphocytes were subsequently selected by FSC vs. SSC. CD4 + T cells were gated on the basis of CD4 vs. CD3 staining, then examined for expression of Ki67 and ICOS. Tregs were identified within the CD4 + T cell population as CD25 hi CD127 lo and Foxp3 + . b Longitudinal empirical data, linear mixed models and estimated means (left, centre and right-hand panels respectively) for Ki67+ and ICOS+ expression on CD4+ T cells, and the Treg proportion of CD4 cells ( P -values: *

- Submitted by
- Invitrogen Antibodies (provider)
- Main image
- Experimental details
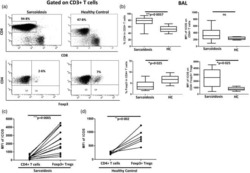
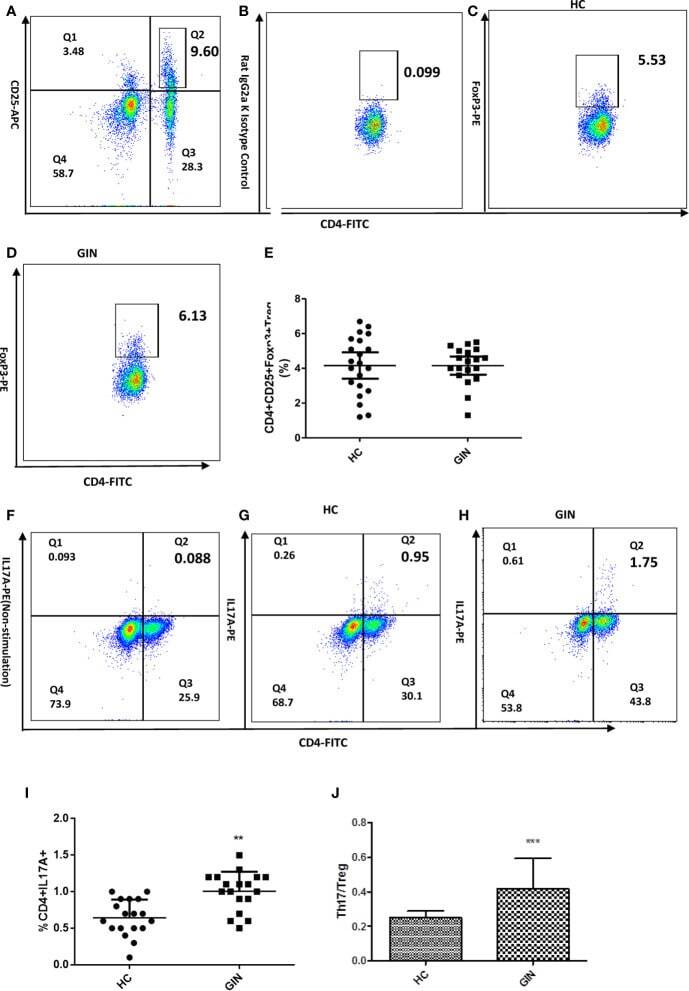
- Figure 2 Proportions of CD4+CD25+FoxP3+ Treg and CD4+IL-17+ Th17 cells in gingivitis patients and healthy controls. (A) Dot plot int the upperright quadrant represents CD4+ CD25 + T Cells. (B) Isotype control staining of FoxP3. (C) Dot plot represents Treg cells from a healthy control subject (D) Treg cells from a representative patient with gingivitis. (E) CD4+CD25+Foxp3+Treg percentages. (F) Non stimulation of Leukocyte Activation Cocktail of the Th17 cells in a healthy control . (G) Dot plot in the upper right quadrant represents Th17 cells from a healthy control subject. (H) Th17 cells from a representative patient with gingivitis. (I) CD4+IL-17+Th17 percentages. (J) the ratio of Th17/Tre. Data presented are means +- SD. ** P < 0.01, *** P < 0.001 versus healthy control.
- Submitted by
- Invitrogen Antibodies (provider)
- Main image

- Experimental details
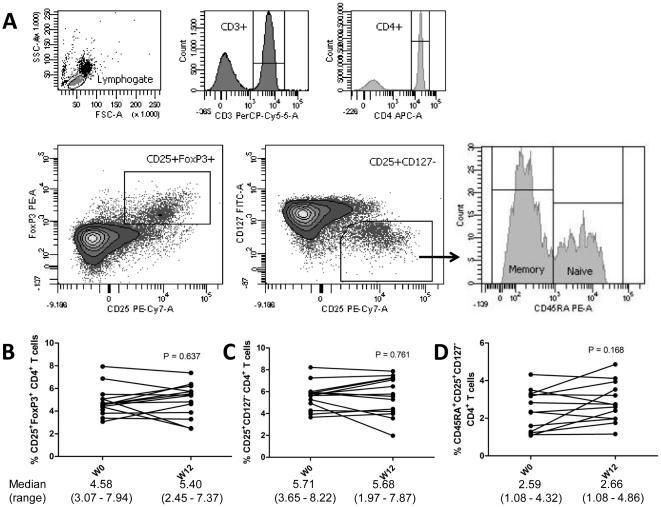
- Figure 2 Phenotypic analysis of circulating regulatory T cells (Treg). A) Isolated PBMC were analyzed directly ex-vivo by flow cytometry. In the lymphogate, CD3 + CD4 + cells were assessed for the proportions of CD25 + FoxP3 + and CD25 + CD127 - Treg cells. Expression of CD45RA was analyzed to phenotype naive (CD45RA + ) and memory (CD45RA - ) Treg. B-D) The proportions of circulating CD25 + FoxP3 + (B) and CD25 + CD127 - (C)Treg, and of naive Treg (D) before and after vitamin D 3 supplementation (week 0 and 12). Significance was assessed with the Wilcoxon signed ranks comparison test.
- Submitted by
- Invitrogen Antibodies (provider)
- Main image
- Experimental details
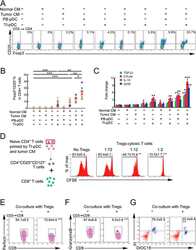
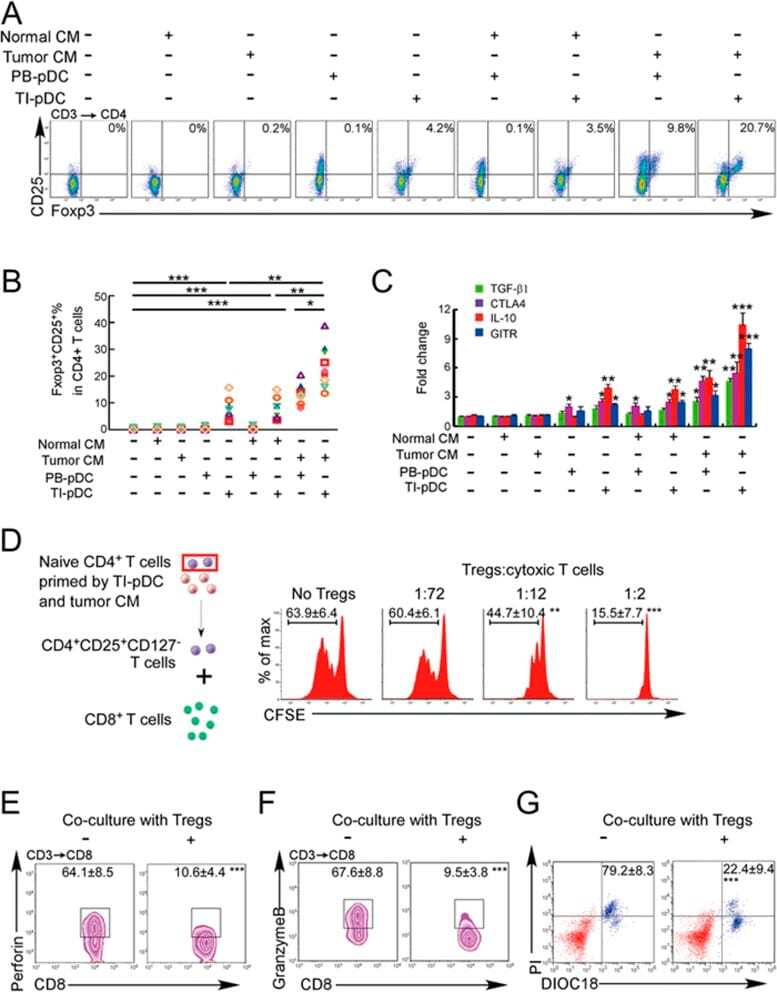
- Figure 3 Naive CD4 + T cells are converted to functional Tregs by tumor-infiltrating DCs and tumor conditioned medium (CM). (A-C) Naive CD4 + T cells from peripheral blood of patients with invasive breast carcinoma were co-cultured with or without autologous pDCs isolated from tumor (TI) or peripheral blood (PB) for 9 days in the presence or absence of 30% CM from autologous tumor slices or adjacent normal tissue slices. (A , B) Non-adherent cells from co-cultures were stained for CD3, CD4, CD25 and intracellular Foxp3, and analyzed by flow cytometry. Representative plots of gated CD3 + CD4 + cells (A) and quantification of percentage of Foxp3 + CD25 + cells among CD3 + CD4 + cells (B) are shown (mean +- SEM, n = 19; * P < 0.05, ** P < 0.01, *** P < 0.001 by Student's t -test). (C) Expression of Treg-associated genes, assessed by qRT-PCR normalized to GAPDH , in sorted CD4 + T cells, relative to expression in cultures without DCs or CM (mean +- SEM, n = 19; * P < 0.05, ** P < 0.01, *** P < 0.001 compared with naive CD4 + T cells cultured alone by Student's t -test). (D-G) Effect of naive CD4 + T cell-derived Tregs, obtained by co-culture with TI pDCs and tumor CM as above, on function of autologous tumor-specific CD8 + T cells. Tumor-specific CD8 + T cells were generated for each subject by stimulating autologous PB CD8 + T cells with autologous tumor lysate-pulsed autologous DCs. Tregs were recovered from co-cultures by magnetic sorting. (D) CFSE-labeled CD8 + T ce
- Submitted by
- Invitrogen Antibodies (provider)
- Main image
- Experimental details
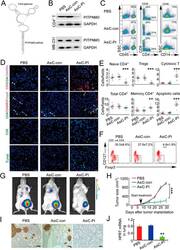
- Figure 6 In vivo knockdown of PITPNM3 in CD4 + T cells reverses immunosuppression and inhibits tumor progression in humanized mice. (A) Humanized mice bearing palpable MDA-MB-231 orthotopic xenografts were intraperitoneally injected daily for 14 days with PBS, 1 nmol CD4-aptamer-control siRNA (AsiC-con) or CD4-aptamer-siRNA targeting PITPNM3 (sequence in A , AsiC-PI) to assess the role of PITPNM3 in TI Tregs, and other T cells and tumor control. Experimental schematic is provided in Supplementary information, Figure S9A . (B) Representative immunoblots showing selective knockdown of PITPNM3 protein in PB CD4 + T cells, but not tumor xenografts ( n = 3). (C) PITPNM3 knockdown did not affect the distribution of human CD45 + hematopoietic cells, CD4 + and CD8 + T cells, and CD14 + monocytes in the peripheral blood of humanized mice. Representative flow plots are shown ( n = 3). (D , E) Effect of PITPNM3 knockdown on TI naive CD4 + , Tregs and CD8 + T cell numbers, and apoptosis by TUNEL assay in xenografts. D shows representative immunofluorescence microscopy images. Top row indicates CD4 + naive T cells by arrows; the second row indicates CD4 + CD45RO + Foxp3 - CD4 + memory T cells (yellow arrows) and Foxp3 + Tregs (white arrows). Scale bar, 50 mum. E shows number of cells of each subtype/high power field in eight mice ( ** P < 0.01, *** P < 0.001 compared to PBS group by Student's t -test). (F) Flow cytometry analysis of gated human CD3 + CD4 + cells isolated from xenogra
- Submitted by
- Invitrogen Antibodies (provider)
- Main image
- Experimental details
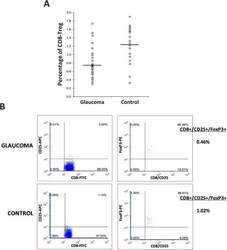
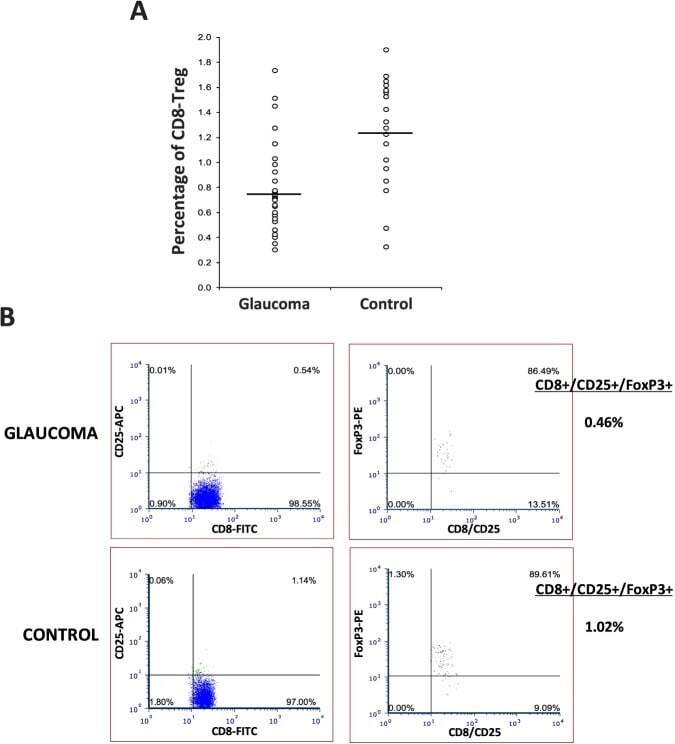
- Figure 3 T-lymphocyte subset distribution in glaucoma. Mononuclear cells isolated from peripheral blood samples from glaucoma (n = 32) and control (n = 21) groups were analyzed by multicolor flow cytometry for T-cell subset markers. (A) Similar to CD4+ Tregs, the percentage of CD8+/CD25+/FoxP3+ Tregs (CD8-Tregs) was also significantly lower in glaucomatous samples than nonglaucomatous controls (ANOVA, P < 0.001). (B) Shown are representative flow cytometry images after CD8/CD25/FoxP3 immunostaining for Tregs.
- Submitted by
- Invitrogen Antibodies (provider)
- Main image
- Experimental details
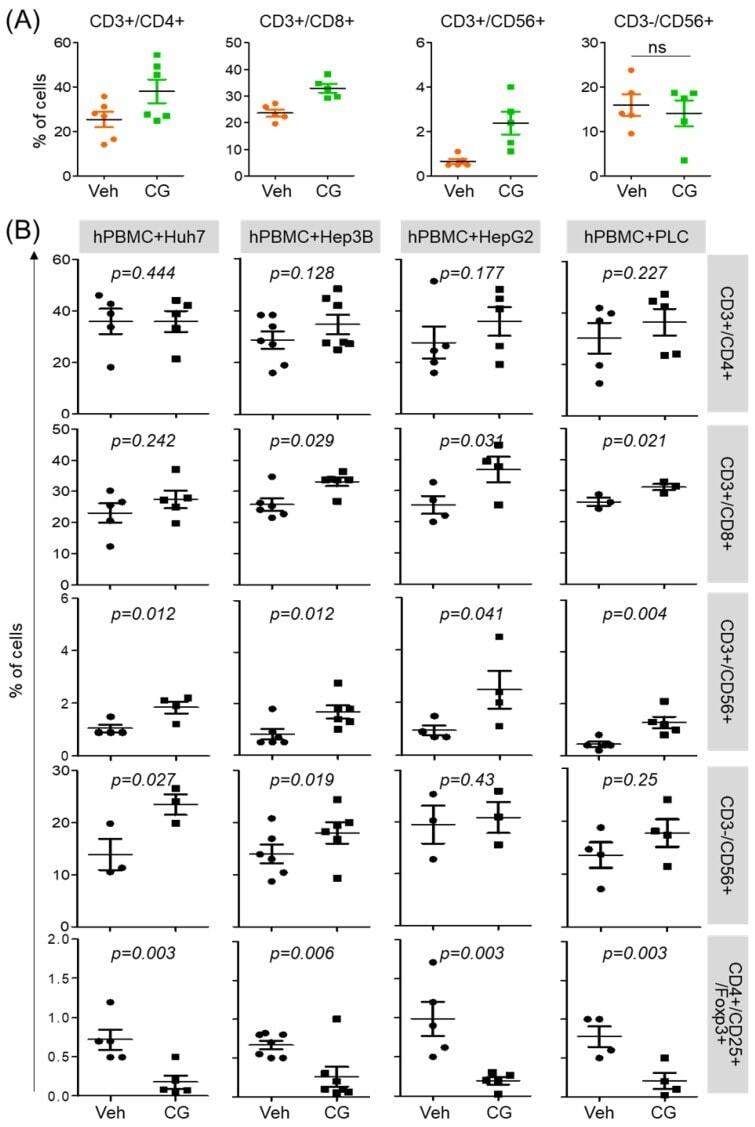
- Figure 3 CG-745 increases helper T cells, cytotoxic T cells and natural killer T cells, and decreases Treg: (A) hPBMCs were incubated with CG (CG-745) for 36 hours and a subset of hPBMCs was analyzed using the antibodies indicated in the text; (B) hPBMCs were co-cultured with Huh7, Hep3B, HepG2 or PLC/PRF/5 cells for 36 hours with or without CG, and a subset of hPBMCs was analyzed by Attune Nxt (Invitrogen, USA).
- Submitted by
- Invitrogen Antibodies (provider)
- Main image
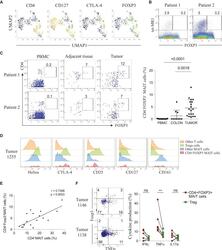
- Experimental details
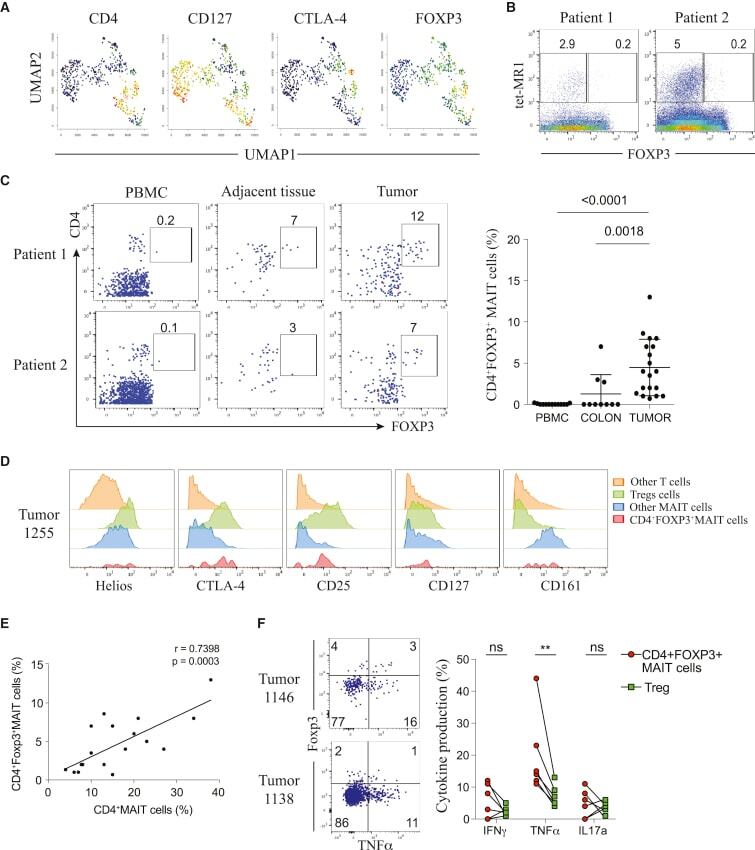
- Figure 2 Identification of a CD4 + Foxp3 + Subset in Tumor-Infiltrating MAIT Cells (A) UMAP plots showing expression of selected markers on MAIT cells; intensities are red (high), yellow/green (intermediate), blue (low). (B) Tet-MR1 staining plotted against Foxp3 on total T cells from two CRC tumor samples. (C) Representative staining of CD4 + Foxp3 + MAIT cells from PBMC, adjacent tissue, and tumors of two patients, gated on total MAIT cells. Shown are frequencies of Foxp3 expression among total MAIT cells (PBMC = 13, colon = 10, tumor = 19). Data are mean with SD from at least 7 experiments. Mann-Whitney U test. (D) Expression intensities of Treg-related markers and CD161 on different T cells compared with the CD4 + Foxp3 + MAIT subset; one representative tumor sample. (E) Correlation of Foxp3 expression on MAIT cells with CD4 + MAIT cell frequency; n = 20, two-tailed paired t test, Pearson''s correlation. (F) Co-expression of Foxp3 and TNF-alpha gated on total MAIT cells (left) and cytokine production (IFNgamma, TNF-alpha, and IL-17) by CD4 + Foxp3 + tumor-infiltrating MAIT cells compared with Tregs upon 4 h of PMA/ionomycin stimulation (right); n = 6. Data are mean with SD from 2 experiments; two-tailed paired t test. See also Figure S2 .