 Explore
 Validate
 Learn
Learn14-4774-80
antibody from Invitrogen Antibodies
Targeting: FOXP3
AIID, DIETER, IPEX, JM2, PIDX, SCURFIN, XPID
 Western blot
 Immunohistochemistry
 Other assay
Antibody data
- Antibody Data
- Antigen structure
- References [26]
- Comments [0]
- Validations
- Other assay [16]
Submit
Validation data
Reference
Comment
Report error
- Product number
- 14-4774-80 - Provider product page

- Provider
- Invitrogen Antibodies
- Product name
- FOXP3 Monoclonal Antibody (150D/E4), eBioscience™
- Antibody type
- Monoclonal
- Antigen
- Other
- Description
- Description: eBioscience offers a panel of monoclonal antibodies to different epitopes of human/primate and mouse/rat Foxp3 protein, providing useful tools for investigating the complete expression pattern of Foxp3 at the protein level, and discerning the precise subsets of Foxp3+ cells. Other antibodies to Foxp3 available from eBioscience, which have been used significantly in scientific literature, include the anti-human Foxp3 PCH101 (Product # 72-5776) and ebio7979 (Product # 12-7979), and the anti-mouse/rat Foxp3 FJK-16s (Product # 72-5775). The 150D/E4 has been mapped to the splice region in Exon 2 found in human cells. The splicing of this region has not been shown to occur in mouse. Characterization of this antibody to the splice variant has been limited to epitope mapping. It should be noted that other antibodies such as PCH101 and 236A/E7 will recognize both the spliced and full length forms of the Foxp3 protein and stain more intensely than 150D/E4 and FJK-16s in human cells. The 150D/E4 antibody reacts with mouse/rat/human Foxp3 also known as FORKHEAD BOX P3, SCURFIN, and JM2. Cross reactivity of this antibody to other proteins has not been determined. Foxp3, a 49-55 kDa protein, is a member of the forkhead/winged-helix family of transcriptional regulators, and was identified as the gene defective in 'scurfy' (sf) mice. Constitutive high expression of FoxP3 mRNA has been shown in CD4+CD25+ regulatory T cells (Treg cells), and ectopic expression of Foxp3 in CD4+CD25- cells imparts a Treg phenotype in these cells. Applications Reported: This 150D/E4 antibody has been reported for use in immunoblotting (WB), and immunohistochemical staining. Applications Tested: This 150D/E4 antibody has been tested by immunoblotting of recombinant mouse and human Foxp3 protein. The purified format is not recommended for intracellular staining and flow cytometric analysis. Purity: Greater than 90%, as determined by SDS-PAGE. Aggregation: Less than 10%, as determined by HPLC. Filtration: 0.2 µm post-manufacturing filtered.
- Reactivity
- Human, Mouse, Rat
- Host
- Mouse
- Isotype
- IgG
- Antibody clone number
- 150D/E4
- Vial size
- 25 µg
- Concentration
- 0.5 mg/mL
- Storage
- 4° C
Submitted references AMP-activated protein kinase alpha1 promotes tumor development via FOXP3 elevation in tumor-infiltrating Treg cells.
Differential expression of tissue-restricted antigens among mTEC is associated with distinct autoreactive T cell fates.
Regulatory T Cells License Macrophage Pro-Resolving Functions During Atherosclerosis Regression.
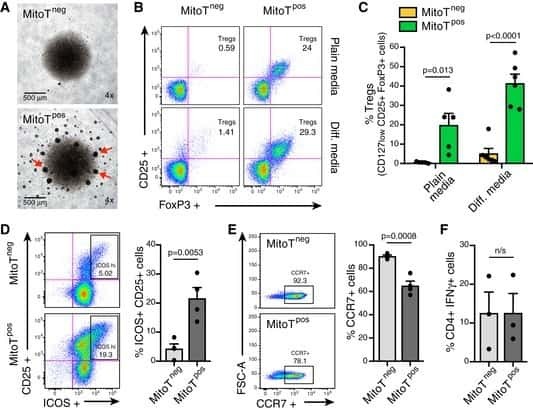
Mitochondrial transfer from MSCs to T cells induces Treg differentiation and restricts inflammatory response.
MEF2D sustains activation of effector Foxp3+ Tregs during transplant survival and anticancer immunity.
Inhibiting the coregulator CoREST impairs Foxp3+ Treg function and promotes antitumor immunity.
Alternative Splicing of FOXP3 Controls Regulatory T Cell Effector Functions and Is Associated With Human Atherosclerotic Plaque Stability.
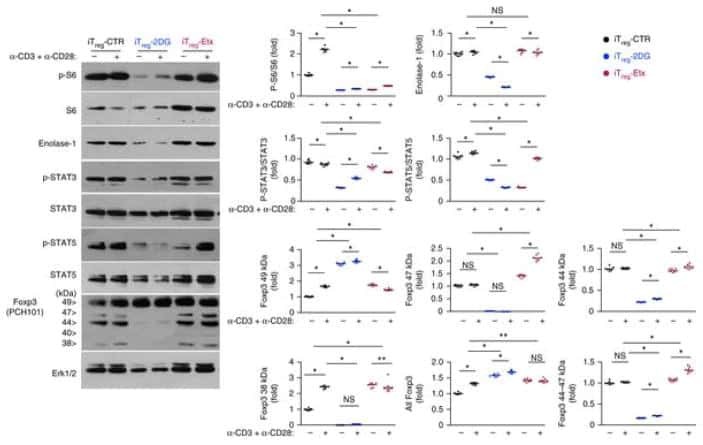
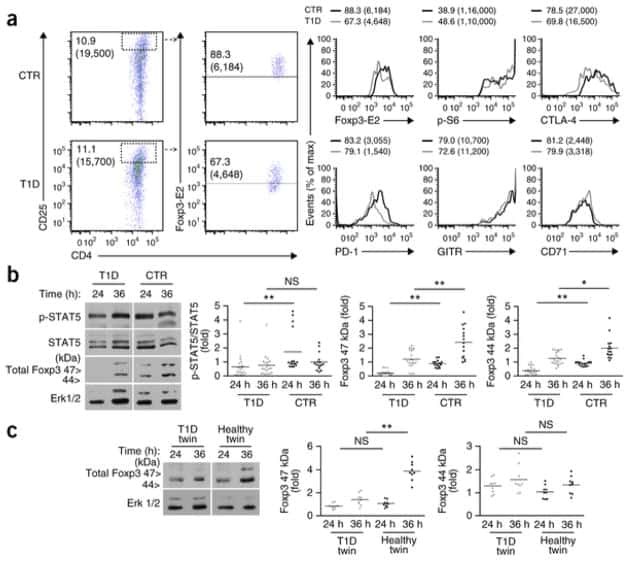
Cutting Edge: Increased Autoimmunity Risk in Glycogen Storage Disease Type 1b Is Associated with a Reduced Engagement of Glycolysis in T Cells and an Impaired Regulatory T Cell Function.
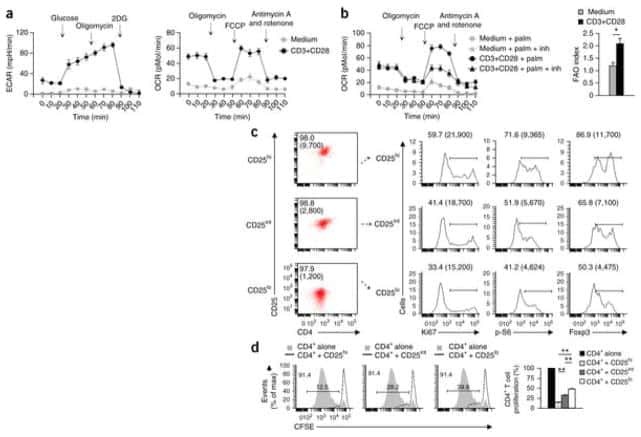
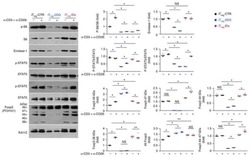
Foxp3 Reprograms T Cell Metabolism to Function in Low-Glucose, High-Lactate Environments.
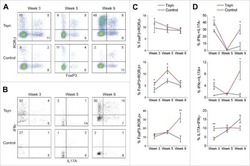
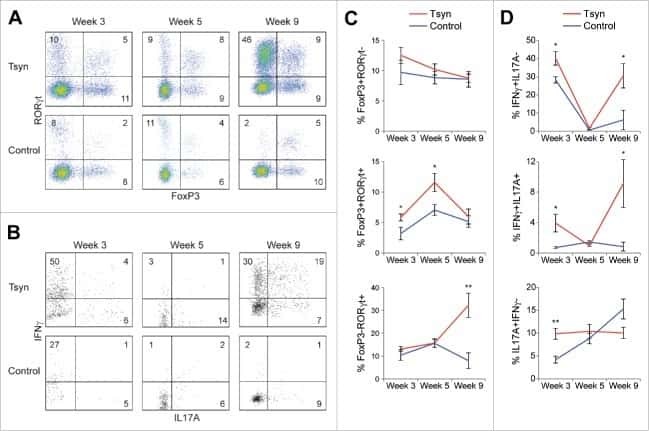
Microbial, metabolomic, and immunologic dynamics in a relapsing genetic mouse model of colitis induced by T-synthase deficiency.
Histone/protein deacetylase 11 targeting promotes Foxp3+ Treg function.
Differential Role of Hematopoietic and Nonhematopoietic Cell Types in the Regulation of NK Cell Tolerance and Responsiveness.
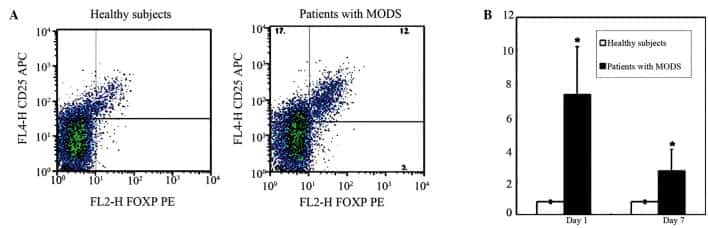
Characteristics of CD4(+)CD25(+)Foxp3(+) regulatory T cells in patients with multiple organ dysfunction syndrome.
TGF-Beta Blockade Increases Renal Inflammation Caused by the C-Terminal Module of the CCN2.
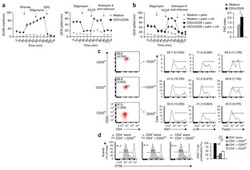
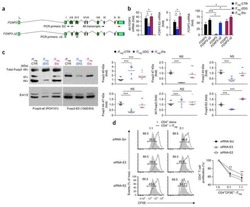
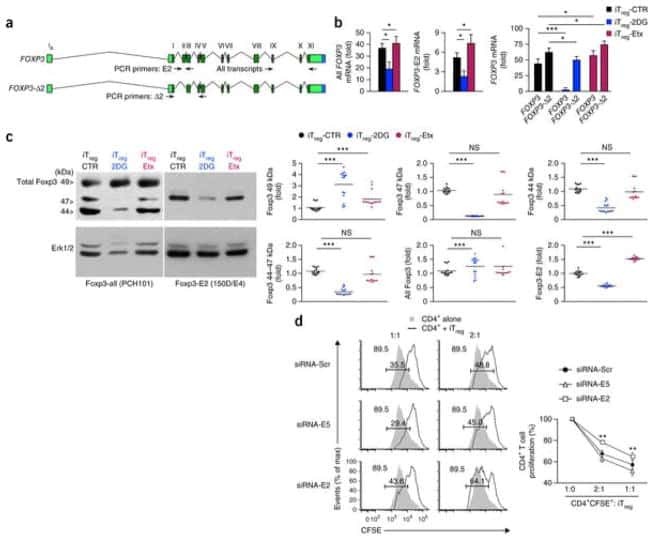
Glycolysis controls the induction of human regulatory T cells by modulating the expression of FOXP3 exon 2 splicing variants.
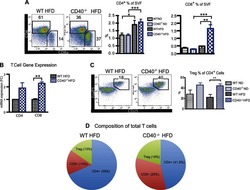
CD40 deficiency in mice exacerbates obesity-induced adipose tissue inflammation, hepatic steatosis, and insulin resistance.
The C-terminal module IV of connective tissue growth factor is a novel immune modulator of the Th17 response.
Paradoxically increased FOXP3+ T cells in IBD do not preferentially express the isoform of FOXP3 lacking exon 2.
Protein kinase B/Akt signals impair Th17 differentiation and support natural regulatory T cell function and induced regulatory T cell formation.
Critical roles of lysosomal acid lipase in T cell development and function.
Malignant Tregs express low molecular splice forms of FOXP3 in Sézary syndrome.
Epigenetic inheritance of DNA methylation limits activation-induced expression of FOXP3 in conventional human CD25-CD4+ T cells.
Regulatory T cell lineage specification by the forkhead transcription factor foxp3.
Analysis of FOXP3 protein expression in human CD4+CD25+ regulatory T cells at the single-cell level.
The origin of FOXP3-expressing CD4+ regulatory T cells: thymus or periphery.
Control of regulatory T cell development by the transcription factor Foxp3.
An J, Ding Y, Yu C, Li J, You S, Liu Z, Song P, Zou MH
iScience 2022 Jan 21;25(1):103570
iScience 2022 Jan 21;25(1):103570
Differential expression of tissue-restricted antigens among mTEC is associated with distinct autoreactive T cell fates.
Lebel MÈ, Coutelier M, Galipeau M, Kleinman CL, Moon JJ, Melichar HJ
Nature communications 2020 Jul 24;11(1):3734
Nature communications 2020 Jul 24;11(1):3734
Regulatory T Cells License Macrophage Pro-Resolving Functions During Atherosclerosis Regression.
Sharma M, Schlegel MP, Afonso MS, Brown EJ, Rahman K, Weinstock A, Sansbury BE, Corr EM, van Solingen C, Koelwyn GJ, Shanley LC, Beckett L, Peled D, Lafaille JJ, Spite M, Loke P, Fisher EA, Moore KJ
Circulation research 2020 Jul 17;127(3):335-353
Circulation research 2020 Jul 17;127(3):335-353
Mitochondrial transfer from MSCs to T cells induces Treg differentiation and restricts inflammatory response.
Court AC, Le-Gatt A, Luz-Crawford P, Parra E, Aliaga-Tobar V, Bátiz LF, Contreras RA, Ortúzar MI, Kurte M, Elizondo-Vega R, Maracaja-Coutinho V, Pino-Lagos K, Figueroa FE, Khoury M
EMBO reports 2020 Feb 5;21(2):e48052
EMBO reports 2020 Feb 5;21(2):e48052
MEF2D sustains activation of effector Foxp3+ Tregs during transplant survival and anticancer immunity.
Di Giorgio E, Wang L, Xiong Y, Akimova T, Christensen LM, Han R, Samanta A, Trevisanut M, Bhatti TR, Beier UH, Hancock WW
The Journal of clinical investigation 2020 Dec 1;130(12):6242-6260
The Journal of clinical investigation 2020 Dec 1;130(12):6242-6260
Inhibiting the coregulator CoREST impairs Foxp3+ Treg function and promotes antitumor immunity.
Xiong Y, Wang L, Di Giorgio E, Akimova T, Beier UH, Han R, Trevisanut M, Kalin JH, Cole PA, Hancock WW
The Journal of clinical investigation 2020 Apr 1;130(4):1830-1842
The Journal of clinical investigation 2020 Apr 1;130(4):1830-1842
Alternative Splicing of FOXP3 Controls Regulatory T Cell Effector Functions and Is Associated With Human Atherosclerotic Plaque Stability.
Joly AL, Seitz C, Liu S, Kuznetsov NV, Gertow K, Westerberg LS, Paulsson-Berne G, Hansson GK, Andersson J
Circulation research 2018 May 11;122(10):1385-1394
Circulation research 2018 May 11;122(10):1385-1394
Cutting Edge: Increased Autoimmunity Risk in Glycogen Storage Disease Type 1b Is Associated with a Reduced Engagement of Glycolysis in T Cells and an Impaired Regulatory T Cell Function.
Melis D, Carbone F, Minopoli G, La Rocca C, Perna F, De Rosa V, Galgani M, Andria G, Parenti G, Matarese G
Journal of immunology (Baltimore, Md. : 1950) 2017 May 15;198(10):3803-3808
Journal of immunology (Baltimore, Md. : 1950) 2017 May 15;198(10):3803-3808
Foxp3 Reprograms T Cell Metabolism to Function in Low-Glucose, High-Lactate Environments.
Angelin A, Gil-de-Gómez L, Dahiya S, Jiao J, Guo L, Levine MH, Wang Z, Quinn WJ 3rd, Kopinski PK, Wang L, Akimova T, Liu Y, Bhatti TR, Han R, Laskin BL, Baur JA, Blair IA, Wallace DC, Hancock WW, Beier UH
Cell metabolism 2017 Jun 6;25(6):1282-1293.e7
Cell metabolism 2017 Jun 6;25(6):1282-1293.e7
Microbial, metabolomic, and immunologic dynamics in a relapsing genetic mouse model of colitis induced by T-synthase deficiency.
Jacobs JP, Lin L, Goudarzi M, Ruegger P, McGovern DP, Fornace AJ Jr, Borneman J, Xia L, Braun J
Gut microbes 2017 Jan 2;8(1):1-16
Gut microbes 2017 Jan 2;8(1):1-16
Histone/protein deacetylase 11 targeting promotes Foxp3+ Treg function.
Huang J, Wang L, Dahiya S, Beier UH, Han R, Samanta A, Bergman J, Sotomayor EM, Seto E, Kozikowski AP, Hancock WW
Scientific reports 2017 Aug 17;7(1):8626
Scientific reports 2017 Aug 17;7(1):8626
Differential Role of Hematopoietic and Nonhematopoietic Cell Types in the Regulation of NK Cell Tolerance and Responsiveness.
Shifrin NT, Kissiov DU, Ardolino M, Joncker NT, Raulet DH
Journal of immunology (Baltimore, Md. : 1950) 2016 Nov 15;197(10):4127-4136
Journal of immunology (Baltimore, Md. : 1950) 2016 Nov 15;197(10):4127-4136
Characteristics of CD4(+)CD25(+)Foxp3(+) regulatory T cells in patients with multiple organ dysfunction syndrome.
Zang X, Jiang Y, Li X, DU Y, Niu J
Experimental and therapeutic medicine 2016 May;11(5):1908-1912
Experimental and therapeutic medicine 2016 May;11(5):1908-1912
TGF-Beta Blockade Increases Renal Inflammation Caused by the C-Terminal Module of the CCN2.
Rodrigues-Díez R, Rayego-Mateos S, Orejudo M, Aroeira LS, Selgas R, Ortiz A, Egido J, Ruiz-Ortega M
Mediators of inflammation 2015;2015:506041
Mediators of inflammation 2015;2015:506041
Glycolysis controls the induction of human regulatory T cells by modulating the expression of FOXP3 exon 2 splicing variants.
De Rosa V, Galgani M, Porcellini A, Colamatteo A, Santopaolo M, Zuchegna C, Romano A, De Simone S, Procaccini C, La Rocca C, Carrieri PB, Maniscalco GT, Salvetti M, Buscarinu MC, Franzese A, Mozzillo E, La Cava A, Matarese G
Nature immunology 2015 Nov;16(11):1174-84
Nature immunology 2015 Nov;16(11):1174-84
CD40 deficiency in mice exacerbates obesity-induced adipose tissue inflammation, hepatic steatosis, and insulin resistance.
Guo CA, Kogan S, Amano SU, Wang M, Dagdeviren S, Friedline RH, Aouadi M, Kim JK, Czech MP
American journal of physiology. Endocrinology and metabolism 2013 May 1;304(9):E951-63
American journal of physiology. Endocrinology and metabolism 2013 May 1;304(9):E951-63
The C-terminal module IV of connective tissue growth factor is a novel immune modulator of the Th17 response.
Rodrigues-Díez R, Rodrigues-Díez RR, Rayego-Mateos S, Suarez-Alvarez B, Lavoz C, Stark Aroeira L, Sánchez-López E, Orejudo M, Alique M, Lopez-Larrea C, Ortiz A, Egido J, Ruiz-Ortega M
Laboratory investigation; a journal of technical methods and pathology 2013 Jul;93(7):812-24
Laboratory investigation; a journal of technical methods and pathology 2013 Jul;93(7):812-24
Paradoxically increased FOXP3+ T cells in IBD do not preferentially express the isoform of FOXP3 lacking exon 2.
Lord JD, Valliant-Saunders K, Hahn H, Thirlby RC, Ziegler SF
Digestive diseases and sciences 2012 Nov;57(11):2846-55
Digestive diseases and sciences 2012 Nov;57(11):2846-55
Protein kinase B/Akt signals impair Th17 differentiation and support natural regulatory T cell function and induced regulatory T cell formation.
Pierau M, Engelmann S, Reinhold D, Lapp T, Schraven B, Bommhardt UH
Journal of immunology (Baltimore, Md. : 1950) 2009 Nov 15;183(10):6124-34
Journal of immunology (Baltimore, Md. : 1950) 2009 Nov 15;183(10):6124-34
Critical roles of lysosomal acid lipase in T cell development and function.
Qu P, Du H, Wilkes DS, Yan C
The American journal of pathology 2009 Mar;174(3):944-56
The American journal of pathology 2009 Mar;174(3):944-56
Malignant Tregs express low molecular splice forms of FOXP3 in Sézary syndrome.
Krejsgaard T, Gjerdrum LM, Ralfkiaer E, Lauenborg B, Eriksen KW, Mathiesen AM, Bovin LF, Gniadecki R, Geisler C, Ryder LP, Zhang Q, Wasik MA, Odum N, Woetmann A
Leukemia 2008 Dec;22(12):2230-9
Leukemia 2008 Dec;22(12):2230-9
Epigenetic inheritance of DNA methylation limits activation-induced expression of FOXP3 in conventional human CD25-CD4+ T cells.
Nagar M, Vernitsky H, Cohen Y, Dominissini D, Berkun Y, Rechavi G, Amariglio N, Goldstein I
International immunology 2008 Aug;20(8):1041-55
International immunology 2008 Aug;20(8):1041-55
Regulatory T cell lineage specification by the forkhead transcription factor foxp3.
Fontenot JD, Rasmussen JP, Williams LM, Dooley JL, Farr AG, Rudensky AY
Immunity 2005 Mar;22(3):329-41
Immunity 2005 Mar;22(3):329-41
Analysis of FOXP3 protein expression in human CD4+CD25+ regulatory T cells at the single-cell level.
Roncador G, Brown PJ, Maestre L, Hue S, Martínez-Torrecuadrada JL, Ling KL, Pratap S, Toms C, Fox BC, Cerundolo V, Powrie F, Banham AH
European journal of immunology 2005 Jun;35(6):1681-91
European journal of immunology 2005 Jun;35(6):1681-91
The origin of FOXP3-expressing CD4+ regulatory T cells: thymus or periphery.
Sakaguchi S
The Journal of clinical investigation 2003 Nov;112(9):1310-2
The Journal of clinical investigation 2003 Nov;112(9):1310-2
Control of regulatory T cell development by the transcription factor Foxp3.
Hori S, Nomura T, Sakaguchi S
Science (New York, N.Y.) 2003 Feb 14;299(5609):1057-61
Science (New York, N.Y.) 2003 Feb 14;299(5609):1057-61
No comments: Submit comment
Supportive validation
- Submitted by
- Invitrogen Antibodies (provider)
- Main image
- Experimental details
- NULL

- Submitted by
- Invitrogen Antibodies (provider)
- Main image

- Experimental details
- NULL
- Submitted by
- Invitrogen Antibodies (provider)
- Main image

- Experimental details
- NULL

- Submitted by
- Invitrogen Antibodies (provider)
- Main image
- Experimental details
- NULL
- Submitted by
- Invitrogen Antibodies (provider)
- Main image
- Experimental details
- NULL
- Submitted by
- Invitrogen Antibodies (provider)
- Main image
- Experimental details
- NULL
- Submitted by
- Invitrogen Antibodies (provider)
- Main image
- Experimental details
- NULL

- Submitted by
- Invitrogen Antibodies (provider)
- Main image
- Experimental details
- NULL
- Submitted by
- Invitrogen Antibodies (provider)
- Main image
- Experimental details
- NULL
- Submitted by
- Invitrogen Antibodies (provider)
- Main image

- Experimental details
- NULL
- Submitted by
- Invitrogen Antibodies (provider)
- Main image
- Experimental details
- NULL
- Submitted by
- Invitrogen Antibodies (provider)
- Main image
- Experimental details
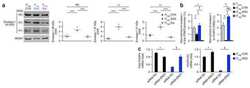
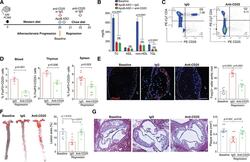
- Figure 2. Regulatory T cell (Treg) depletion abrogates atherosclerosis regression. A , Experimental design: Atherosclerosis was established in C57BL6&solJ mice by injection of adeno-associated virus (AAV)-PCSK (proprotein convertase subtilisin&solkexin type)-9 followed by Western diet feeding for 20 wk (Baseline). Mice were then switched to chow diet and atherosclerosis regression was initiated by apoB (apolipoprotein B)-antisense oligonucleotide (ASO)-mediated lipid lowering in conjunction with anti-CD25 or IgG isotype control antibody treatment for 3 wk. B , Plasma total cholesterol, HDL (high-density lipoprotein) and non-HDL cholesterol, and triglyceride levels at baseline and after regression &plus IgG anti-CD25 treatment (n=11 mice&solgroup). C , Representative flow cytometric analyses of CD4 &plus CD25 &plus cells in the circulation of mice treated with IgG or anti-CD25 during atherosclerosis regression. D , Quantification of FoxP3 &plus CD25 &plus cells in peripheral blood (n=5&solgroup), thymus (n=5&solgroup), and spleen (n=9&solgroup) of mice by flow cytometry. Data are mean+-SEM and are representative of 2 independent experiments. P values were determined by a Student t test. E , Representative immunofluorescence staining for FoxP3 in aortic root plaques from mice at baseline and after regression &plus IgG or anti-CD25 treatment (n=6 mice&solgroup). Quantification shown at right. Scale bars=100 &mgrm. F and G , Representative images and quantification of atheroscler
- Submitted by
- Invitrogen Antibodies (provider)
- Main image

- Experimental details
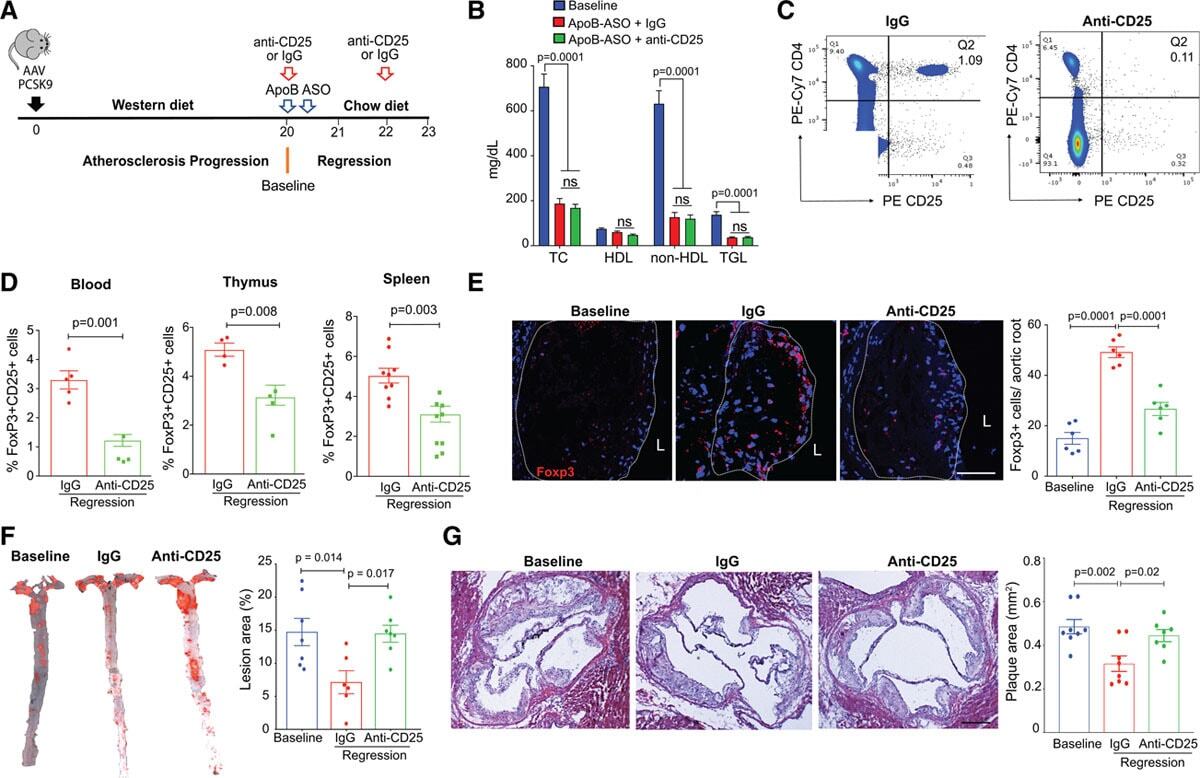
- Figure 3 Conditional HDAC11 deletion promotes chromatin remodeling at the Foxp3 locus and Treg gene expression. ( A ) ChIP studies of the Foxp3 promoter and 3 enhancer regions in WT vs. conditional HDAC11-/- Treg cells, showing increased acetyl-H3 binding at all 4 sites in HDAC11-/- vs. WT Treg cells. ( B ) Luciferase reporter assays showing the impact of overexpression, and also inhibition, of HDAC11 in 293 T cells that were transiently transfected with murine Foxp3-promoter-Luc vector plus expression vectors for p65, HDAC11, Foxp3, and p300, as specified, or empty vector (EV) along with 50 ng of pRL-TK Renilla luciferase internal control vector; EV was added to ensure equal amounts of DNA per reaction. After 48 h, cells were treated with PMA (6 ng/ml) and ionomycin (1 muM) for 5 to 6 h, and 1 muM HDAC11i where specified, and cell lysates were harvested for luciferase assays. Firefly luminescence data was normalized to Renilla luminescence and analyzed by ANOVA (*p < 0.05, **p < 0.005); data are representative of the results of 3 or more independent experiments. ( C ) Heat-map of selected genes that were upregulated (red) or downregulated (blue) in conditional HDAC11-/- vs. WT Treg cells. ( D ) qPCR evaluation of WT vs. conditional HDAC11-/- Treg cells, showing increased expression of Jun, Junb, Fos and Fosb in HDAC11-/- Tregs; normalized data are shown as mean +- SD, 4 mice/group, and *p < 0.05, **p < 0.01.
- Submitted by
- Invitrogen Antibodies (provider)
- Main image
- Experimental details
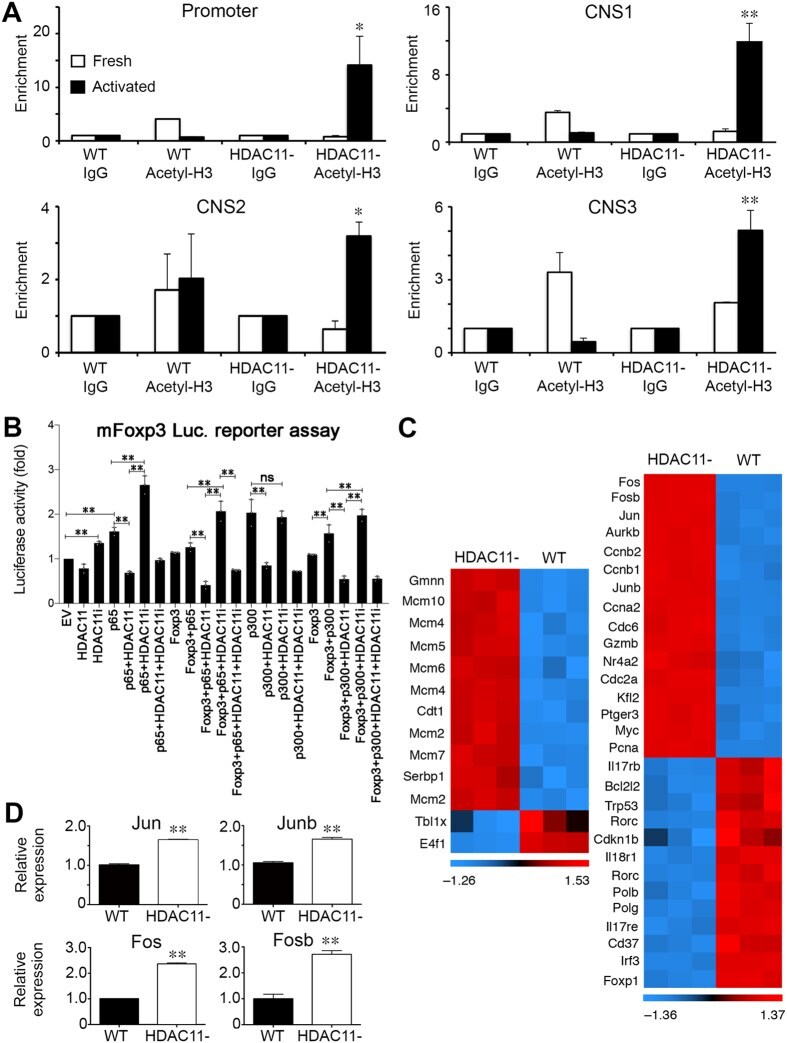
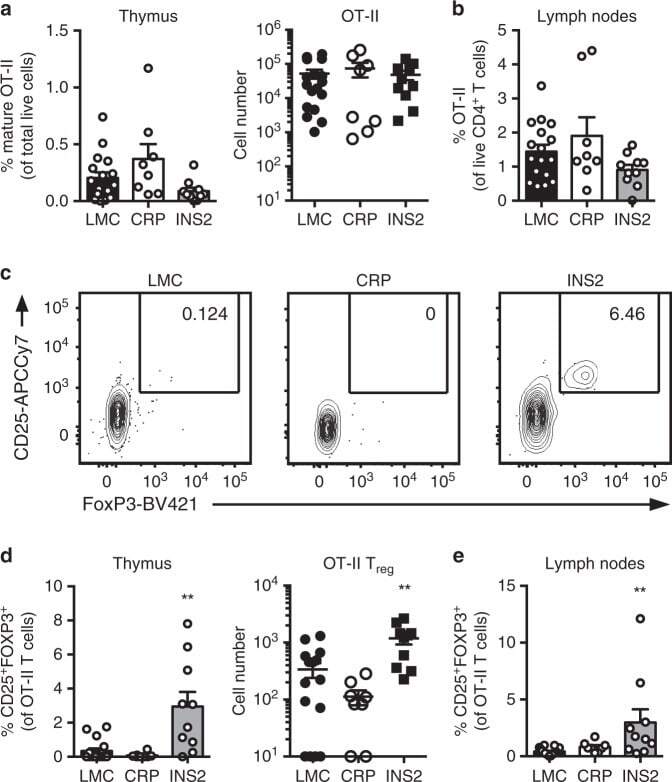
- Fig. 4 mTEC hi -restricted expression of USA preferentially induces T reg differentiation. Littermate control (LMC), CRP, and INS2 Tg mice (CD45.2, Thy1.2) were irradiated and reconstituted with 1% OT-II (CD45.2, Thy1.1) and 99% WT (CD45.1, Thy1.2) bone marrow. The hematopoietic chimeras were analyzed 6-8 weeks post-irradiation. a Proportion of mature TCRbeta hi CD4 + SP OT-II thymocytes among total live cells and absolute number of live CD4 + SP OT-II thymocytes. b Proportion of OT-II cells within the CD4 + T cell population in the peripheral lymph nodes. c Representative flow plots of CD25 and FoxP3 expression on OT-II T cells. d Proportion and absolute cell number of CD25 + Foxp3 + OT-II T cells in the thymus. e Proportion of CD25 + Foxp3 + OT-II T cells in the lymph nodes. (mean +- SEM, n = 17 LMC, 8 CRP, 10 INS2, from three independent experiments). All p -values indicated are calculated by Kruskal-Wallis test followed by Dunn's post-hoc comparisons to LMC, two-sided. ** p < 0.01 relative to LMC. Source data are provided as a Source Data file.
- Submitted by
- Invitrogen Antibodies (provider)
- Main image
- Experimental details
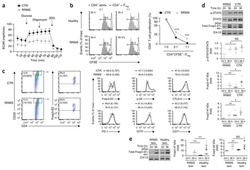
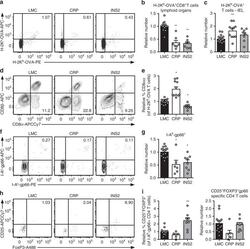
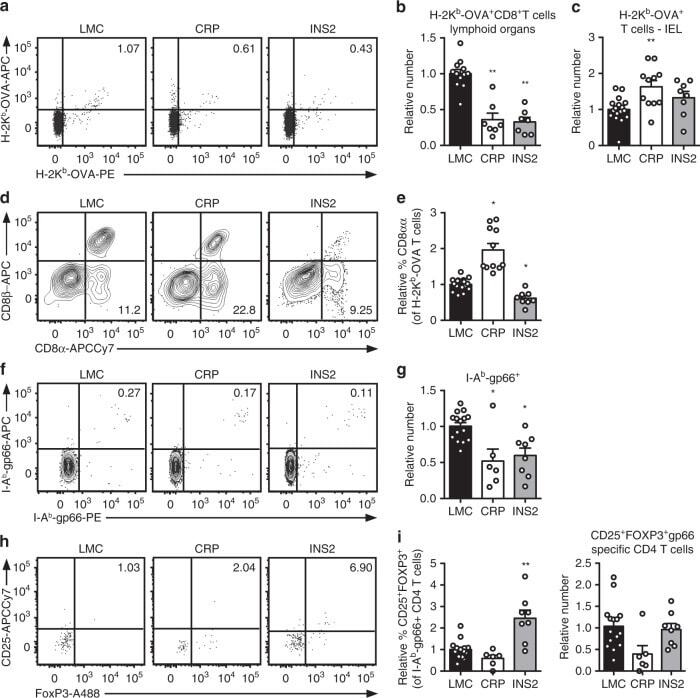
- Fig. 5 TRA expression by distinct mTEC compartments impacts the mode of tolerance induction in the polyclonal T cell repertoire in naive mice. a Representative flow plots of H-2K b -OVA tetramer on pooled peripheral lymph nodes and spleen cells from naive mice after enrichment, gated on live TCRalphabeta + CD8 + T cells. Relative number of H-2K b -OVA-specific TCRalphabeta + CD8 + T cells in the peripheral secondary lymphoid organs (mean +- SEM, n = 12 LMC, 7 CRP, 7 INS2) ( b ) and intraepithelial lymphocytes (IEL) (mean +- SEM, n = 17 LMC, 11 CRP, 8 INS2) ( c ) from CRP and INS2 Tg mice as compared to their respective littermate controls (LMC). d Representative flow plot of CD8alpha and CD8beta and e relative proportion of TCRalphabeta + CD8alphaalpha within the H-2K b -OVA tetramer double positive TCRalphabeta IEL of CRP and INS2 Tg mice as compared to their respective LMC (mean +- SEM, n = 17 LMC, 11 CRP, 8 INS2). f Representative flow plots of I-A b -gp66 tetramer on pooled peripheral lymph nodes and spleen cells from naive mice, gated on live TCRalphabeta + CD4 + T cells. g Relative number of I-A b -gp66 tetramer DP CD4 + T cells in the peripheral lymph nodes and the spleen of naive mice. h Representative flow plots of CD25 and FoxP3, gated on live I-A b -gp66 tetramer + CD4 + T cells. i Relative proportion of CD25 + FoxP3 + T reg of gp66-specific CD4 + T cells and relative number of gp66-specific CD4 + CD25 + FoxP3 + T reg from CRP and INS2 peripheral lymph nodes and sp
- Submitted by
- Invitrogen Antibodies (provider)
- Main image
- Experimental details
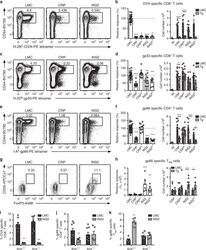
- Fig. 6 TRA expression by distinct mTEC compartments impacts the mode of tolerance induction in the polyclonal T cell repertoire in LCMV infected mice. Mice were infected with LCMV-OVA and the antigen-specific response was measured in the spleen 8 days post-infection (NI, not infected mice) a, c Representative CD44 and H-2K b -OVA or H-2D b -gp33 tetramer staining on CD8 + T cells from littermate controls (LMC), CRP, and INS2 Tg mice. Relative response and absolute number of OVA- ( b ) and gp33- ( d ) specific CD8 + T cell response in USA expressing mice as compared to LMC. e Representative CD44 and I-A b -gp66 tetramer staining on CD4 + T cells from LMC, CRP, and INS2 Tg mice. f Relative and absolute gp66-specific response in USA expressing mice. g Representative flow plot of CD25 and FoxP3, gated on live I-A b -gp66-specific CD4 + T cells. h Relative proportion of CD25 + FoxP3 + T reg among gp66-specific CD4 + T cells and absolute number of gp66-specific CD4 + CD25 + FoxP3 + T reg (mean +- SEM, b left panel n = 22 LMC, 7 CRP, 5 CRP lo , 9 INS2, 3 INS2 lo ; b right panel n = 3 NI, 8 CRP LMC, 10 CRP Tg, 9 CRP lo LMC, 9 CRP lo Tg, 10 INS2 LMC, 9 INS2 Tg, 3 INS2 lo LMC, 3 INS2 lo Tg; d and f left panel n = 32 LMC, 12 CRP, 12 CRP lo , 14 INS2, 8 INS2 lo , d right panel n = 6 NI, 11 CRP LMC, 12 CRP Tg, 11 CRP lo LMC, 12 CRP lo Tg, 13 INS2 LMC, 11 INS2 Tg, 6 INS2 lo LMC, 6 INS2 lo Tg, f right panel n = 6 NI, 11 CRP LMC, 13 CRP Tg, 12 CRP lo LMC, 13 CRP lo Tg, 14 INS2 LMC, 12 INS2 T
