Explore
 Validate
 Learn
Learn41-4777-80
antibody from Invitrogen Antibodies
Targeting: FOXP3
AIID, DIETER, IPEX, JM2, PIDX, SCURFIN, XPID
 Immunohistochemistry
Antibody data
- Antibody Data
- Antigen structure
- References [29]
- Comments [0]
- Validations
- Immunohistochemistry [2]
- Other assay [28]
Submit
Validation data
Reference
Comment
Report error
- Product number
- 41-4777-80 - Provider product page

- Provider
- Invitrogen Antibodies
- Product name
- FOXP3 Monoclonal Antibody (236A/E7), eFluor™ 570, eBioscience™
- Antibody type
- Monoclonal
- Antigen
- Other
- Description
- Description: The 236A/E7 antibody reacts with human Foxp3 protein also known as FORKHEAD BOX P3, SCURFIN, and JM2. Foxp3, a 49-55 kDa protein, is a member of the forkhead/winged-helix family of transcriptional regulators, and was identified as the gene defective in 'scurfy' (sf) mice. Constitutive high expression of Foxp3 mRNA has been shown in CD4+CD25+ regulatory T cells (Treg cells), and ectopic expression of Foxp3 in CD4+CD25- cells imparts a Treg phenotype in these cells. Intracellular staining and flow cytometric analysis of freshly isolated human peripheral blood mononuclear cells (PBMCs) with the 236A/E7 antibody using the Foxp3/Transcription Factor Staining Buffer Set (Product # 00-5523) and protocol reveals staining of the CD4+CD25bright population. The epitope from 236A/E7 is different from that of PCH101 (Product # 72-5776-40). This antibody has also been shown to recognize rhesus macaque, sooty mangabey and cynomolgus macaque. Applications Reported: This 236A/E7 antibody has been reported for use in immunohistochemical staining of frozen tissue sections, immunohistochemical staining of formalin-fixed paraffin embedded tissue sections, and microscopy. Applications Tested: This 236A/E7 antibody has been tested by immunohistochemistry on formalin-fixed paraffin embedded human tissue using high or low pH antigen retrieval and can be used at less than or equal to 5 µg/mL. It is recommended that the antibody be carefully titrated for optimal performance in the assay of interest. Filter Recommendation: When using this eFluor® 570 antibody conjugate, we recommend a filter that will capture the 570 emission wavelength (for example, Excitation 545/25, 565LP, Emission 605/70). A standard Alexa Fluor® 555 or TRITC filter is acceptable. Excitation: 555 nm; Emission: 570 nm.
- Reactivity
- Human
- Host
- Mouse
- Isotype
- IgG
- Antibody clone number
- 236A/E7
- Vial size
- 25 µg
- Concentration
- 0.2 mg/mL
- Storage
- 4° C, store in dark, DO NOT FREEZE!
Submitted references Common clonal origin of conventional T cells and induced regulatory T cells in breast cancer patients.
Multiple Immunostainings with Different Epitope Retrievals-The FOLGAS Protocol.
Increased CD3(+), CD8(+), or FoxP3(+) T Lymphocyte Infiltrations Are Associated with the Pathogenesis of Colorectal Cancer but Not with the Overall Survival of Patients.
Digital Pathology Analysis Quantifies Spatial Heterogeneity of CD3, CD4, CD8, CD20, and FoxP3 Immune Markers in Triple-Negative Breast Cancer.
Distinct Tumor Microenvironments Are a Defining Feature of Strain-Specific CRISPR/Cas9-Induced MPNSTs.
hESC-derived immune suppressive dendritic cells induce immune tolerance of parental hESC-derived allografts.
Inhibition of RANK signaling in breast cancer induces an anti-tumor immune response orchestrated by CD8+ T cells.
Biomarker recommendation for PD-1/PD-L1 immunotherapy development in pediatric cancer based on digital image analysis of PD-L1 and immune cells.
Molecular profiling of primary uveal melanomas with tumor-infiltrating lymphocytes.
Highly multiplexed immunofluorescence images and single-cell data of immune markers in tonsil and lung cancer.
Spontaneous Regression of Ovarian Carcinoma After Septic Peritonitis; A Unique Case Report.
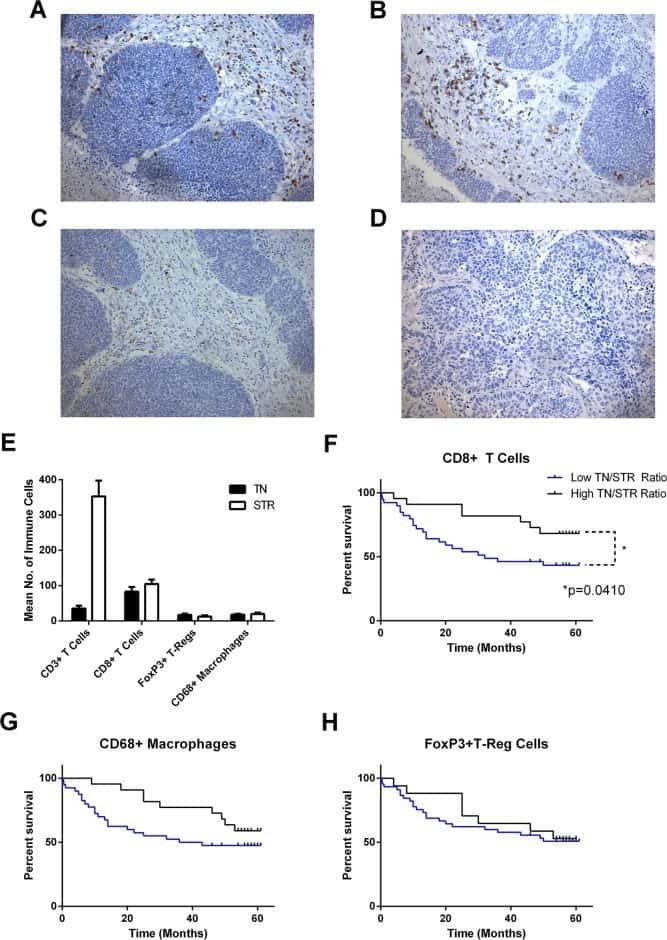
Multicomponent analysis of the tumour microenvironment reveals low CD8 T cell number, low stromal caveolin-1 and high tenascin-C and their combination as significant prognostic markers in non-small cell lung cancer.
Long-lived pancreatic ductal adenocarcinoma slice cultures enable precise study of the immune microenvironment.
Preferential accumulation of regulatory T cells with highly immunosuppressive characteristics in breast tumor microenvironment.
Cutting Edge: Selective Oral ROCK2 Inhibitor Reduces Clinical Scores in Patients with Psoriasis Vulgaris and Normalizes Skin Pathology via Concurrent Regulation of IL-17 and IL-10.
The immune microenvironment of breast ductal carcinoma in situ.
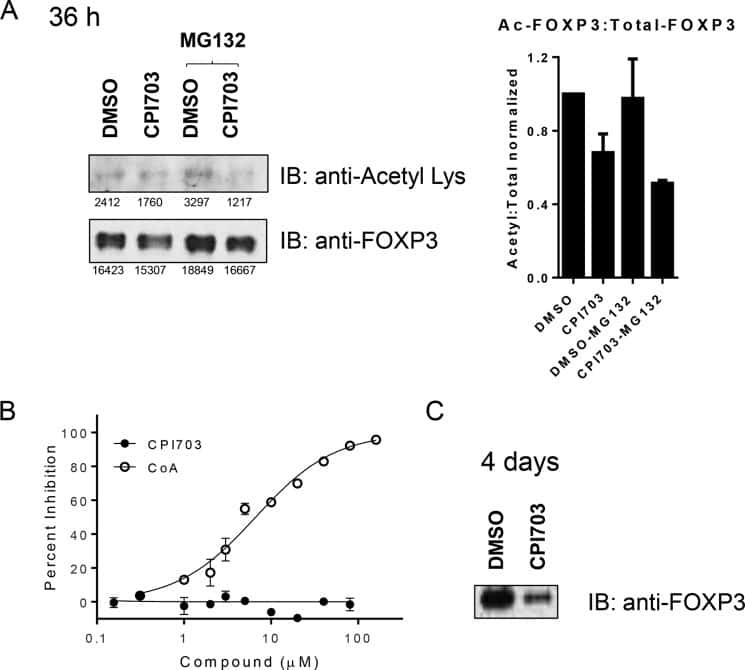
Regulatory T Cell Modulation by CBP/EP300 Bromodomain Inhibition.
Differential tumor infiltration by T-cells characterizes intrinsic molecular subtypes in breast cancer.
Follicular regulatory T cells impair follicular T helper cells in HIV and SIV infection.
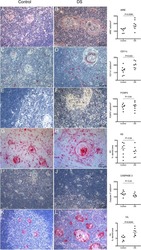
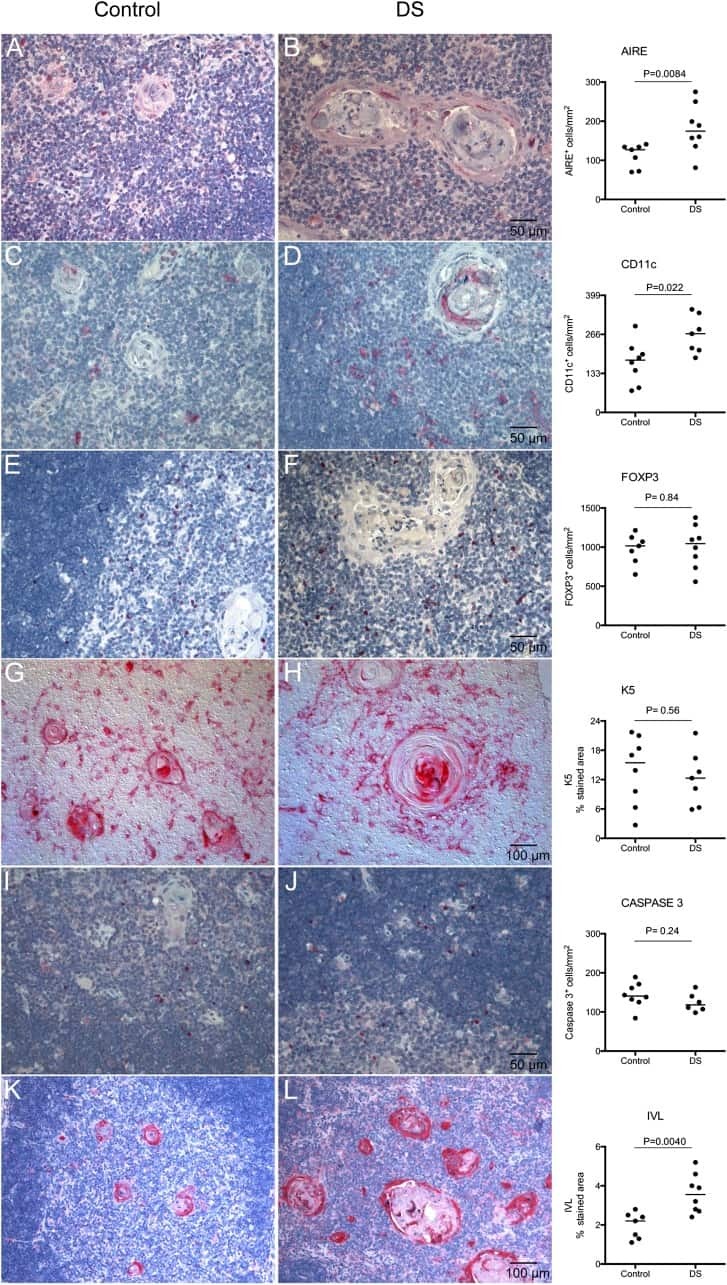
Altered expression of autoimmune regulator in infant down syndrome thymus, a possible contributor to an autoimmune phenotype.
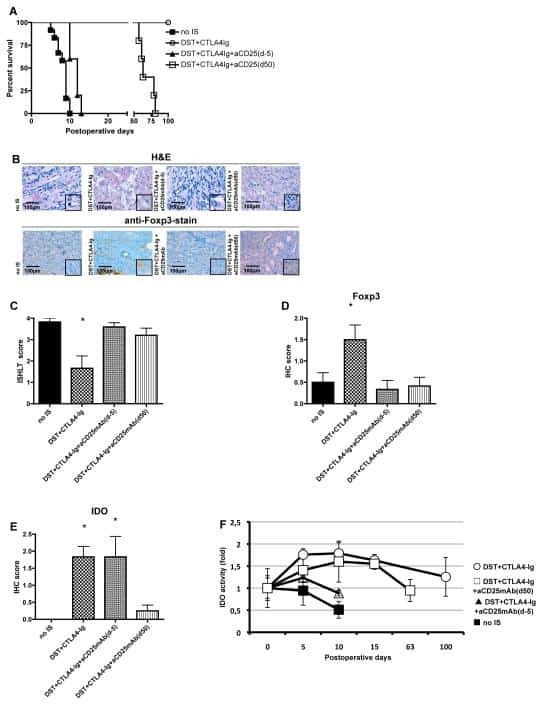
IDO and regulatory T cell support are critical for cytotoxic T lymphocyte-associated Ag-4 Ig-mediated long-term solid organ allograft survival.
CD4(+) regulatory T cells in a cynomolgus macaque model of Mycobacterium tuberculosis infection.
Early resolution of acute immune activation and induction of PD-1 in SIV-infected sooty mangabeys distinguishes nonpathogenic from pathogenic infection in rhesus macaques.
Early resolution of acute immune activation and induction of PD-1 in SIV-infected sooty mangabeys distinguishes nonpathogenic from pathogenic infection in rhesus macaques.
Gamma c-signaling cytokines induce a regulatory T cell phenotype in malignant CD4+ T lymphocytes.
Analysis of FOXP3 protein expression in human CD4+CD25+ regulatory T cells at the single-cell level.
Outcome in Hodgkin's lymphoma can be predicted from the presence of accompanying cytotoxic and regulatory T cells.
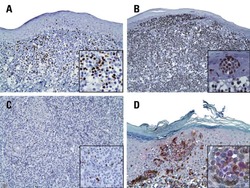
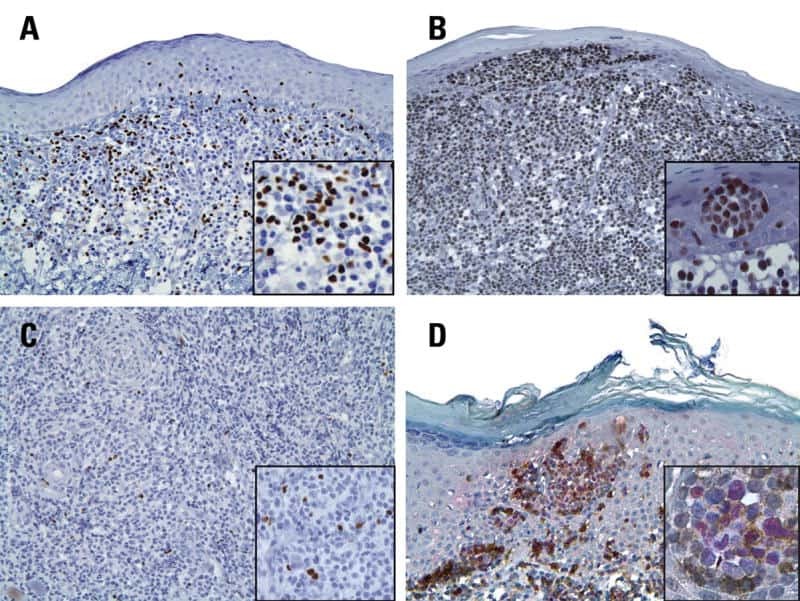
FOXP3, a selective marker for a subset of adult T-cell leukaemia/lymphoma.
The expression of the regulatory T cell-specific forkhead box transcription factor FoxP3 is associated with poor prognosis in ovarian cancer.
Xydia M, Rahbari R, Ruggiero E, Macaulay I, Tarabichi M, Lohmayer R, Wilkening S, Michels T, Brown D, Vanuytven S, Mastitskaya S, Laidlaw S, Grabe N, Pritsch M, Fronza R, Hexel K, Schmitt S, Müller-Steinhardt M, Halama N, Domschke C, Schmidt M, von Kalle C, Schütz F, Voet T, Beckhove P
Nature communications 2021 Feb 18;12(1):1119
Nature communications 2021 Feb 18;12(1):1119
Multiple Immunostainings with Different Epitope Retrievals-The FOLGAS Protocol.
von Schoenfeld A, Bronsert P, Poc M, Fuller A, Filby A, Kraft S, Kurowski K, Sörensen K, Huber J, Pfeiffer J, Proietti M, Stehl V, Werner M, Seidl M
International journal of molecular sciences 2021 Dec 25;23(1)
International journal of molecular sciences 2021 Dec 25;23(1)
Increased CD3(+), CD8(+), or FoxP3(+) T Lymphocyte Infiltrations Are Associated with the Pathogenesis of Colorectal Cancer but Not with the Overall Survival of Patients.
Barbosa AM, Martinho O, Nogueira R, Campos J, Lobo L, Pinto H, Longatto-Filho A, Castro AG, Martins SF, Torrado E
Biology 2021 Aug 20;10(8)
Biology 2021 Aug 20;10(8)
Digital Pathology Analysis Quantifies Spatial Heterogeneity of CD3, CD4, CD8, CD20, and FoxP3 Immune Markers in Triple-Negative Breast Cancer.
Mi H, Gong C, Sulam J, Fertig EJ, Szalay AS, Jaffee EM, Stearns V, Emens LA, Cimino-Mathews AM, Popel AS
Frontiers in physiology 2020;11:583333
Frontiers in physiology 2020;11:583333
Distinct Tumor Microenvironments Are a Defining Feature of Strain-Specific CRISPR/Cas9-Induced MPNSTs.
Scherer A, Stephens VR, McGivney GR, Gutierrez WR, Laverty EA, Knepper-Adrian V, Dodd RD
Genes 2020 May 23;11(5)
Genes 2020 May 23;11(5)
hESC-derived immune suppressive dendritic cells induce immune tolerance of parental hESC-derived allografts.
Todorova D, Zhang Y, Chen Q, Liu J, He J, Fu X, Xu Y
EBioMedicine 2020 Dec;62:103120
EBioMedicine 2020 Dec;62:103120
Inhibition of RANK signaling in breast cancer induces an anti-tumor immune response orchestrated by CD8+ T cells.
Gómez-Aleza C, Nguyen B, Yoldi G, Ciscar M, Barranco A, Hernández-Jiménez E, Maetens M, Salgado R, Zafeiroglou M, Pellegrini P, Venet D, Garaud S, Trinidad EM, Benítez S, Vuylsteke P, Polastro L, Wildiers H, Simon P, Lindeman G, Larsimont D, Van den Eynden G, Velghe C, Rothé F, Willard-Gallo K, Michiels S, Muñoz P, Walzer T, Planelles L, Penninger J, Azim HA Jr, Loi S, Piccart M, Sotiriou C, González-Suárez E
Nature communications 2020 Dec 10;11(1):6335
Nature communications 2020 Dec 10;11(1):6335
Biomarker recommendation for PD-1/PD-L1 immunotherapy development in pediatric cancer based on digital image analysis of PD-L1 and immune cells.
Silva MA, Triltsch N, Leis S, Kanchev I, Tan TH, Van Peel B, Van Kerckhoven M, Deschoolmeester V, Zimmermann J
The journal of pathology. Clinical research 2020 Apr;6(2):124-137
The journal of pathology. Clinical research 2020 Apr;6(2):124-137
Molecular profiling of primary uveal melanomas with tumor-infiltrating lymphocytes.
Triozzi PL, Schoenfield L, Plesec T, Saunthararajah Y, Tubbs RR, Singh AD
Oncoimmunology 2019;8(10):e947169
Oncoimmunology 2019;8(10):e947169
Highly multiplexed immunofluorescence images and single-cell data of immune markers in tonsil and lung cancer.
Rashid R, Gaglia G, Chen YA, Lin JR, Du Z, Maliga Z, Schapiro D, Yapp C, Muhlich J, Sokolov A, Sorger P, Santagata S
Scientific data 2019 Dec 17;6(1):323
Scientific data 2019 Dec 17;6(1):323
Spontaneous Regression of Ovarian Carcinoma After Septic Peritonitis; A Unique Case Report.
Roelofsen T, Wefers C, Gorris MAJ, Textor JC, Massuger LFAG, de Vries IJM, van Altena AM
Frontiers in oncology 2018;8:562
Frontiers in oncology 2018;8:562
Multicomponent analysis of the tumour microenvironment reveals low CD8 T cell number, low stromal caveolin-1 and high tenascin-C and their combination as significant prognostic markers in non-small cell lung cancer.
Onion D, Isherwood M, Shridhar N, Xenophontos M, Craze ML, Day LJ, García-Márquez MA, Pineda RG, Reece-Smith AM, Saunders JH, Duffy JP, Argent RH, Grabowska AM
Oncotarget 2018 Jan 5;9(2):1760-1771
Oncotarget 2018 Jan 5;9(2):1760-1771
Long-lived pancreatic ductal adenocarcinoma slice cultures enable precise study of the immune microenvironment.
Jiang X, Seo YD, Chang JH, Coveler A, Nigjeh EN, Pan S, Jalikis F, Yeung RS, Crispe IN, Pillarisetty VG
Oncoimmunology 2017;6(7):e1333210
Oncoimmunology 2017;6(7):e1333210
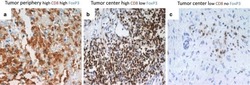
Preferential accumulation of regulatory T cells with highly immunosuppressive characteristics in breast tumor microenvironment.
Syed Khaja AS, Toor SM, El Salhat H, Faour I, Ul Haq N, Ali BR, Elkord E
Oncotarget 2017 May 16;8(20):33159-33171
Oncotarget 2017 May 16;8(20):33159-33171
Cutting Edge: Selective Oral ROCK2 Inhibitor Reduces Clinical Scores in Patients with Psoriasis Vulgaris and Normalizes Skin Pathology via Concurrent Regulation of IL-17 and IL-10.
Zanin-Zhorov A, Weiss JM, Trzeciak A, Chen W, Zhang J, Nyuydzefe MS, Arencibia C, Polimera S, Schueller O, Fuentes-Duculan J, Bonifacio KM, Kunjravia N, Cueto I, Soung J, Fleischmann RM, Kivitz A, Lebwohl M, Nunez M, Woodson J, Smith SL, West RF, Berger M, Krueger JG, Ryan JL, Waksal SD
Journal of immunology (Baltimore, Md. : 1950) 2017 May 15;198(10):3809-3814
Journal of immunology (Baltimore, Md. : 1950) 2017 May 15;198(10):3809-3814
The immune microenvironment of breast ductal carcinoma in situ.
Thompson E, Taube JM, Elwood H, Sharma R, Meeker A, Warzecha HN, Argani P, Cimino-Mathews A, Emens LA
Modern pathology : an official journal of the United States and Canadian Academy of Pathology, Inc 2016 Mar;29(3):249-58
Modern pathology : an official journal of the United States and Canadian Academy of Pathology, Inc 2016 Mar;29(3):249-58
Regulatory T Cell Modulation by CBP/EP300 Bromodomain Inhibition.
Ghosh S, Taylor A, Chin M, Huang HR, Conery AR, Mertz JA, Salmeron A, Dakle PJ, Mele D, Cote A, Jayaram H, Setser JW, Poy F, Hatzivassiliou G, DeAlmeida-Nagata D, Sandy P, Hatton C, Romero FA, Chiang E, Reimer T, Crawford T, Pardo E, Watson VG, Tsui V, Cochran AG, Zawadzke L, Harmange JC, Audia JE, Bryant BM, Cummings RT, Magnuson SR, Grogan JL, Bellon SF, Albrecht BK, Sims RJ 3rd, Lora JM
The Journal of biological chemistry 2016 Jun 17;291(25):13014-27
The Journal of biological chemistry 2016 Jun 17;291(25):13014-27
Differential tumor infiltration by T-cells characterizes intrinsic molecular subtypes in breast cancer.
Miyan M, Schmidt-Mende J, Kiessling R, Poschke I, de Boniface J
Journal of translational medicine 2016 Jul 29;14(1):227
Journal of translational medicine 2016 Jul 29;14(1):227
Follicular regulatory T cells impair follicular T helper cells in HIV and SIV infection.
Miles B, Miller SM, Folkvord JM, Kimball A, Chamanian M, Meditz AL, Arends T, McCarter MD, Levy DN, Rakasz EG, Skinner PJ, Connick E
Nature communications 2015 Oct 20;6:8608
Nature communications 2015 Oct 20;6:8608
Altered expression of autoimmune regulator in infant down syndrome thymus, a possible contributor to an autoimmune phenotype.
Skogberg G, Lundberg V, Lindgren S, Gudmundsdottir J, Sandström K, Kämpe O, Annerén G, Gustafsson J, Sunnegårdh J, van der Post S, Telemo E, Berglund M, Ekwall O
Journal of immunology (Baltimore, Md. : 1950) 2014 Sep 1;193(5):2187-95
Journal of immunology (Baltimore, Md. : 1950) 2014 Sep 1;193(5):2187-95
IDO and regulatory T cell support are critical for cytotoxic T lymphocyte-associated Ag-4 Ig-mediated long-term solid organ allograft survival.
Sucher R, Fischler K, Oberhuber R, Kronberger I, Margreiter C, Ollinger R, Schneeberger S, Fuchs D, Werner ER, Watschinger K, Zelger B, Tellides G, Pilat N, Pratschke J, Margreiter R, Wekerle T, Brandacher G
Journal of immunology (Baltimore, Md. : 1950) 2012 Jan 1;188(1):37-46
Journal of immunology (Baltimore, Md. : 1950) 2012 Jan 1;188(1):37-46
CD4(+) regulatory T cells in a cynomolgus macaque model of Mycobacterium tuberculosis infection.
Green AM, Mattila JT, Bigbee CL, Bongers KS, Lin PL, Flynn JL
The Journal of infectious diseases 2010 Aug 15;202(4):533-41
The Journal of infectious diseases 2010 Aug 15;202(4):533-41
Early resolution of acute immune activation and induction of PD-1 in SIV-infected sooty mangabeys distinguishes nonpathogenic from pathogenic infection in rhesus macaques.
Estes JD, Gordon SN, Zeng M, Chahroudi AM, Dunham RM, Staprans SI, Reilly CS, Silvestri G, Haase AT
Journal of immunology (Baltimore, Md. : 1950) 2008 May 15;180(10):6798-807
Journal of immunology (Baltimore, Md. : 1950) 2008 May 15;180(10):6798-807
Gamma c-signaling cytokines induce a regulatory T cell phenotype in malignant CD4+ T lymphocytes.
Kasprzycka M, Zhang Q, Witkiewicz A, Marzec M, Potoczek M, Liu X, Wang HY, Milone M, Basu S, Mauger J, Choi JK, Abrams JT, Hou JS, Rook AH, Vonderheid E, Woetmann A, Odum N, Wasik MA
Journal of immunology (Baltimore, Md. : 1950) 2008 Aug 15;181(4):2506-12
Journal of immunology (Baltimore, Md. : 1950) 2008 Aug 15;181(4):2506-12
Analysis of FOXP3 protein expression in human CD4+CD25+ regulatory T cells at the single-cell level.
Roncador G, Brown PJ, Maestre L, Hue S, Martínez-Torrecuadrada JL, Ling KL, Pratap S, Toms C, Fox BC, Cerundolo V, Powrie F, Banham AH
European journal of immunology 2005 Jun;35(6):1681-91
European journal of immunology 2005 Jun;35(6):1681-91
Outcome in Hodgkin's lymphoma can be predicted from the presence of accompanying cytotoxic and regulatory T cells.
Alvaro T, Lejeune M, Salvadó MT, Bosch R, García JF, Jaén J, Banham AH, Roncador G, Montalbán C, Piris MA
Clinical cancer research : an official journal of the American Association for Cancer Research 2005 Feb 15;11(4):1467-73
Clinical cancer research : an official journal of the American Association for Cancer Research 2005 Feb 15;11(4):1467-73
FOXP3, a selective marker for a subset of adult T-cell leukaemia/lymphoma.
Roncador G, Garcia JF, Garcia JF, Maestre L, Lucas E, Menarguez J, Ohshima K, Nakamura S, Banham AH, Piris MA
Leukemia 2005 Dec;19(12):2247-53
Leukemia 2005 Dec;19(12):2247-53
The expression of the regulatory T cell-specific forkhead box transcription factor FoxP3 is associated with poor prognosis in ovarian cancer.
Wolf D, Wolf AM, Rumpold H, Fiegl H, Zeimet AG, Muller-Holzner E, Deibl M, Gastl G, Gunsilius E, Marth C
Clinical cancer research : an official journal of the American Association for Cancer Research 2005 Dec 1;11(23):8326-31
Clinical cancer research : an official journal of the American Association for Cancer Research 2005 Dec 1;11(23):8326-31
No comments: Submit comment
Supportive validation
- Submitted by
- Invitrogen Antibodies (provider)
- Main image

- Experimental details
- Immunohistochemistry of formalin-fixed paraffin embedded human tonsil using 5 µg/mL of Mouse IgG1 K Isotype Control eFluor® 570 (left) or 5 µg/mL of Anti-Human Foxp3 eFluor® 570 (right). Nuclei are stained with DAPI.
- Submitted by
- Invitrogen Antibodies (provider)
- Main image
- Experimental details
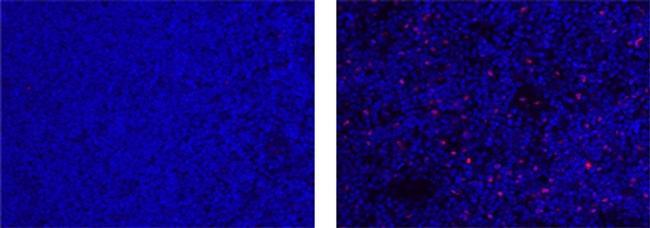
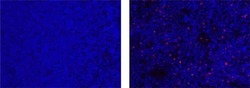
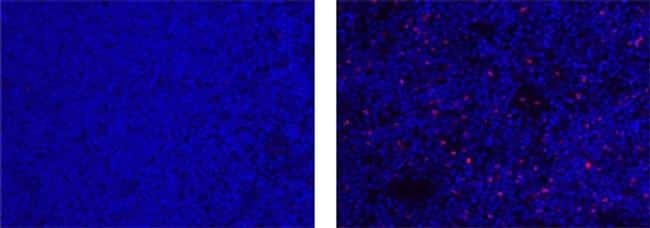
- Immunohistochemistry of formalin-fixed paraffin embedded human tonsil using 5 µg/mL of Mouse IgG1 K Isotype Control eFluor® 570 (left) or 5 µg/mL of Anti-Human Foxp3 eFluor® 570 (right). Nuclei are stained with DAPI.
Supportive validation
- Submitted by
- Invitrogen Antibodies (provider)
- Main image

- Experimental details
- NULL
- Submitted by
- Invitrogen Antibodies (provider)
- Main image

- Experimental details
- NULL
- Submitted by
- Invitrogen Antibodies (provider)
- Main image
- Experimental details
- NULL
- Submitted by
- Invitrogen Antibodies (provider)
- Main image

- Experimental details
- NULL
- Submitted by
- Invitrogen Antibodies (provider)
- Main image

- Experimental details
- NULL

- Submitted by
- Invitrogen Antibodies (provider)
- Main image
- Experimental details
- NULL
- Submitted by
- Invitrogen Antibodies (provider)
- Main image
- Experimental details
- NULL

- Submitted by
- Invitrogen Antibodies (provider)
- Main image

- Experimental details
- NULL
- Submitted by
- Invitrogen Antibodies (provider)
- Main image
- Experimental details
- NULL
- Submitted by
- Invitrogen Antibodies (provider)
- Main image
- Experimental details
- NULL
- Submitted by
- Invitrogen Antibodies (provider)
- Main image
- Experimental details
- NULL

- Submitted by
- Invitrogen Antibodies (provider)
- Main image
- Experimental details
- NULL
- Submitted by
- Invitrogen Antibodies (provider)
- Main image

- Experimental details
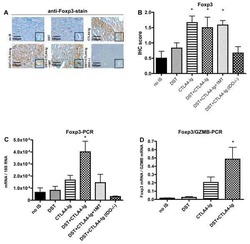
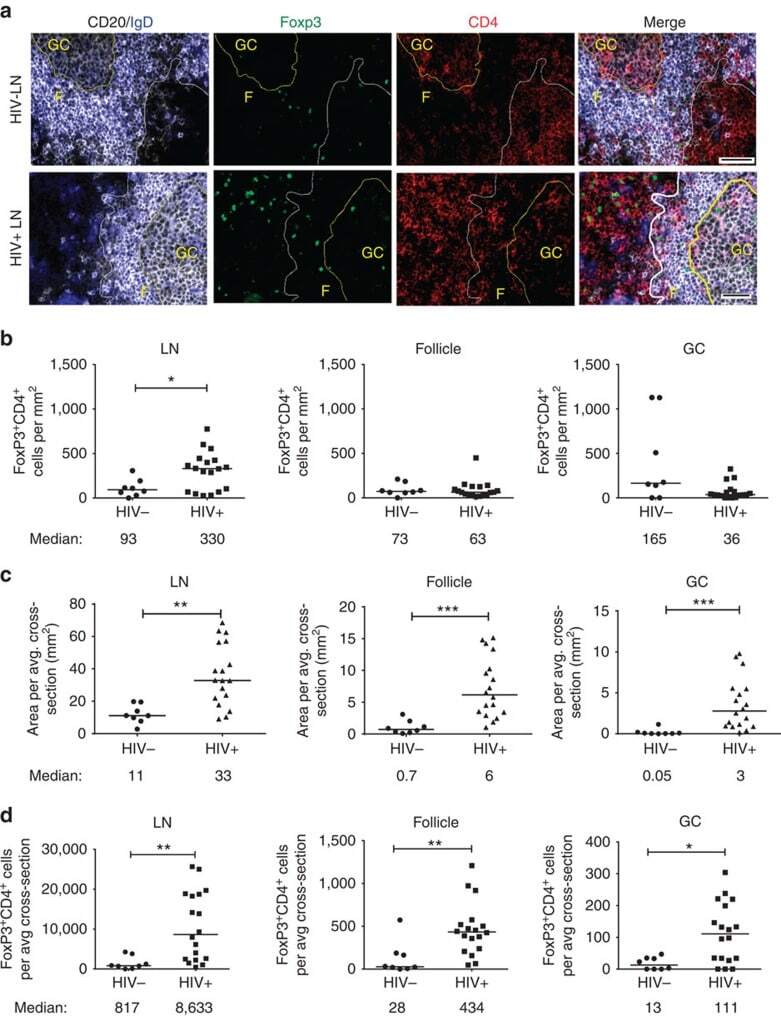
- Figure 1 T FR expansion in human lymph nodes (LNs) during HIV infection. ( a ) Representative images of immunofluorescently stained LN sections from a subject with chronic, untreated HIV infection ( n =17) and an uninfected control subject ( n =8). LNs were stained with fluorescently labelled antibodies to CD20 (white), IgD (blue), Foxp3 (green) and CD4 (red). Follicle (F) was defined as CD20 + (white line) and germinal centre (GC) was defined as CD20 + IgD - (yellow line). Images were scanned at x 60 magnification and scale bars equal 20 mum. ( b ) Foxp3 + CD4 + cells were quantified in different regions of immunofluorescently stained LN shown in a from uninfected ( n =8) and HIV-infected ( n =17) subjects using visual inspection and quantitative image analysis to determine areas. ( c ) The average areas of total (LN), follicular and GC regions per LN cross-section were determined by quantitative image analysis. ( d ) The average number of CD4 + Foxp3 + cells per LN, F and GC cross-section was calculated by multiplying the frequency of CD4 + Foxp3 + cells per mm 2 ( b ) by the average area of each region ( c ) for each subject. The horizontal bars of each graph indicate the median value and are listed where appropriate for clarity. Statistical analyses were performed by Mann-Whitney (Wilcoxon) tests to compare unpaired, nonparametric values and significance is denoted by asterisks where * P
- Submitted by
- Invitrogen Antibodies (provider)
- Main image

- Experimental details
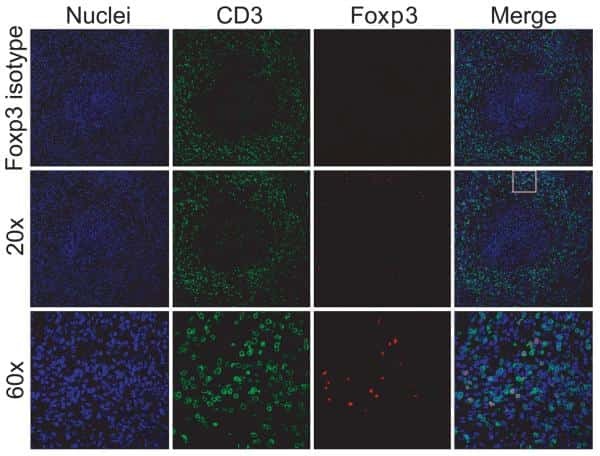
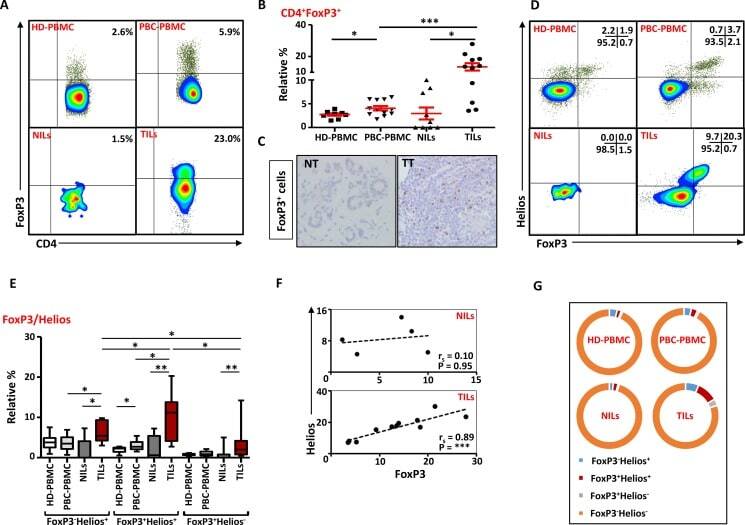
- Figure 6 FoxP3 and Helios expression in CD4 + T cells PBMC from HD and PBC patients, NILs and TILs were stained for CD3 and CD4 antibodies followed by intracellular staining for FoxP3 and Helios. Live cells were first gated using Fixable Viability Dye 660. ( A ). Representative flow cytometric plots of FoxP3 staining from one cancer patient are shown. ( B ). Scatter plot showing the differences in frequencies of FoxP3 + Tregs between different samples. ( C ). IHC staining of FoxP3 + expression in one NT and TT samples. ( D ). Flow cytometric plots of FoxP3 and Helios co-expression in CD4 + T cells from different samples and whisker plots ( E ) showing differences in various FoxP3 and Helios-expressing Treg subsets. ( F ). Non-parametric Spearman's test showing correlations between FoxP3 and Helios expressions in NILs and TILs. ( G ). Pie charts show the relative percentages of different FoxP3 and Helios Treg subsets.
- Submitted by
- Invitrogen Antibodies (provider)
- Main image

- Experimental details
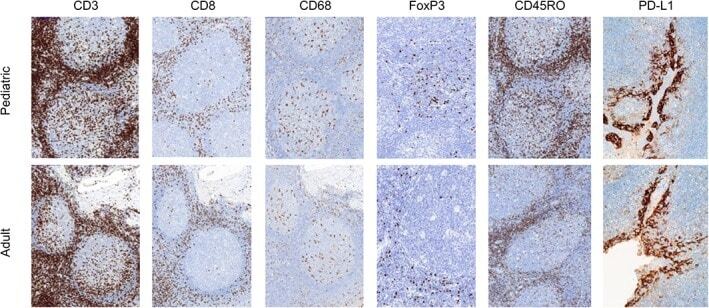
- Figure 2 Representative micrographs of CD3, CD8, CD45RO, CD68 IHC (x10) as well as FoxP3 and PD-L1 IHC (x20) in pediatric and adult tonsils, respectively, from the bridging study.
- Submitted by
- Invitrogen Antibodies (provider)
- Main image
- Experimental details
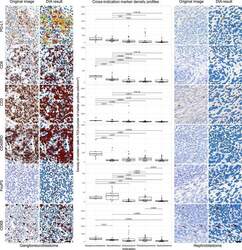
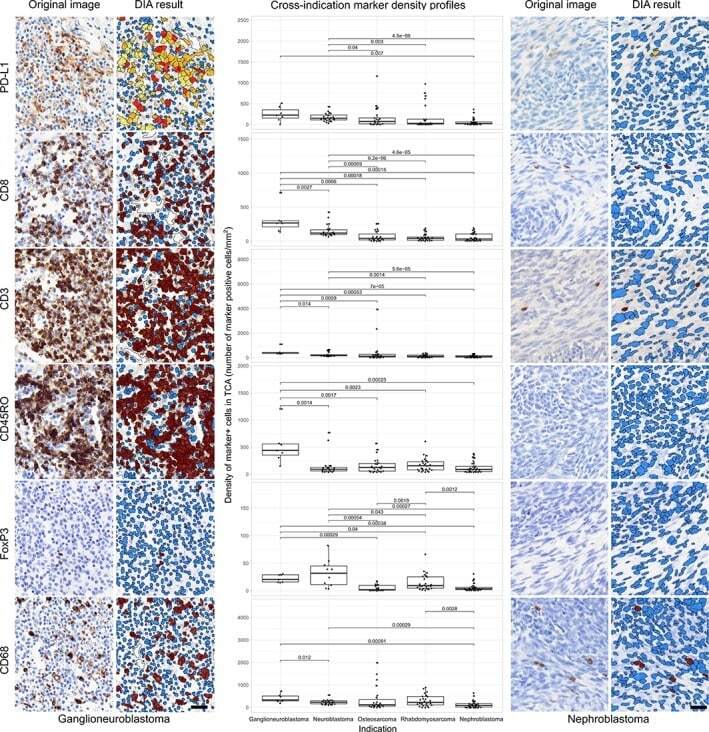
- Figure 3 DIA results from IHC. Representative IHC stained images and their corresponding DIA segmentation overlays of CD3, CD8, CD45RO, CD68, FoxP3, and PD-L1 IHC (x20) from ganglioneuroblastoma, the indication showing the highest PD-L1 expression, far left, and from nephroblastoma, the indication showing the lowest PD-L1 expression, far right. Same cases and similar regions from serial sections were selected. Classification colors indicate blue for negative nuclei, brown for CD3, CD8, CD45RO, CD68, and FoxP3 positive cells; and yellow, orange, and red for PD-L1 positive cells of increasing stain intensity. The boxplots in the middle panel show distribution profiles of investigated biomarkers across investigated indications. Indications are sorted by descending order of mean PD-L1 positive cell densities. Horizontal lines mark indication pairs where the differences in distribution are statistically significant and corresponding adjusted P values are indicated above.
- Submitted by
- Invitrogen Antibodies (provider)
- Main image

- Experimental details
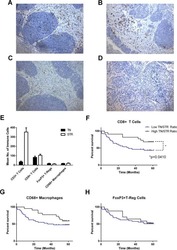
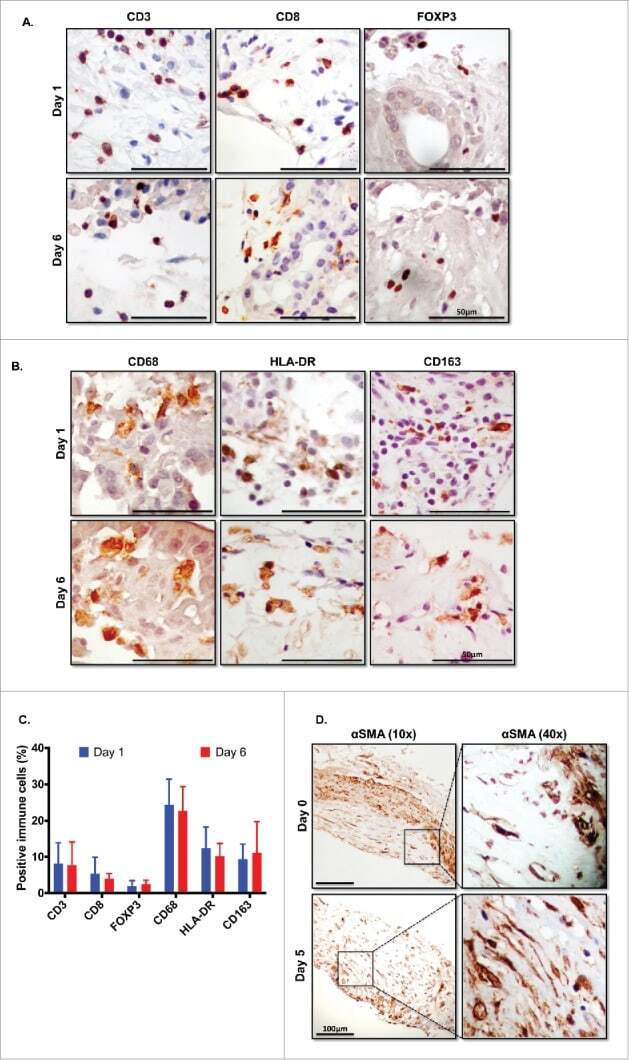
- Figure 5. Immune and stromal cells survive in slice culture. IHC for (A) T cell markers (CD3, CD8 + , and FOXP3) (N = 3) and (B) macrophage markers (CD68, HLA-DR and CD163) was performed on days 1 and 6 of PDA slice cultures (all Bar = 50 mum). (N = 3) (C) Quantitation of cells staining for each marker demonstrates stability of immune cell populations. (N = 3) Error bars represent STDEV. (D) Day 1 and 6 slices were stained with alpha smooth muscle actin (alphaSMA) (Bar = 100 mum). (N = 4) The right panels are the expanded views of the region of interest indicated by the black boxes in the left panels.
- Submitted by
- Invitrogen Antibodies (provider)
- Main image
- Experimental details
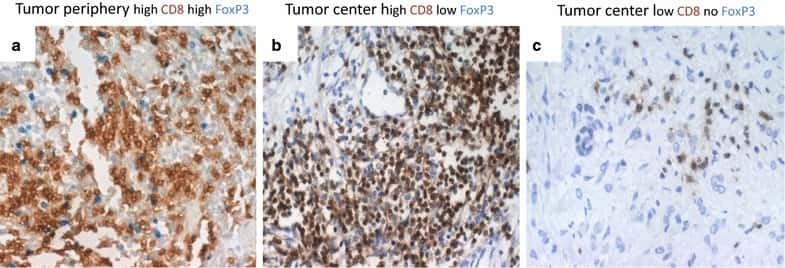
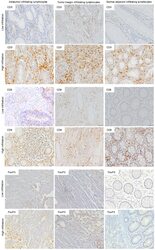
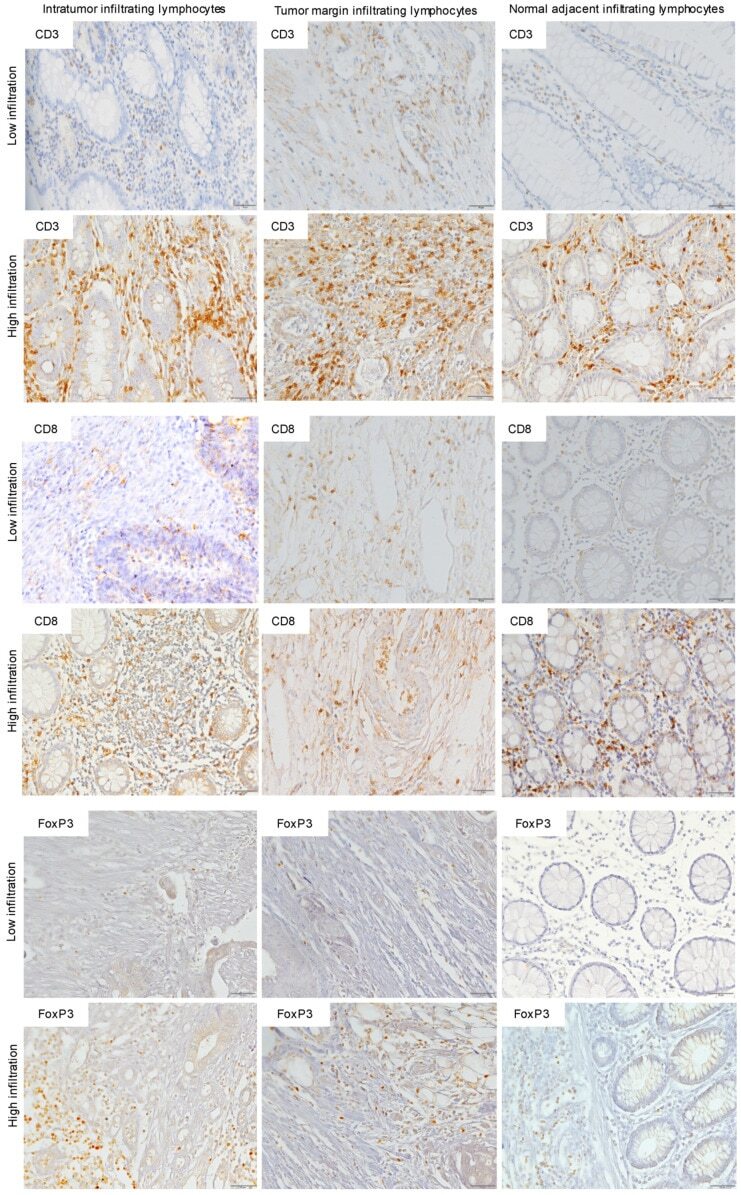
- Figure 1 Immunohistochemistry (IHC) of CD3, CD8, and FoxP3 T lymphocytes in CRC. Representative IHC showing low and high CD3 + , CD8 + , and FoxP3 + T lymphocytes densities. Magnification: 200x.
- Submitted by
- Invitrogen Antibodies (provider)
- Main image
- Experimental details
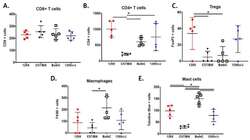
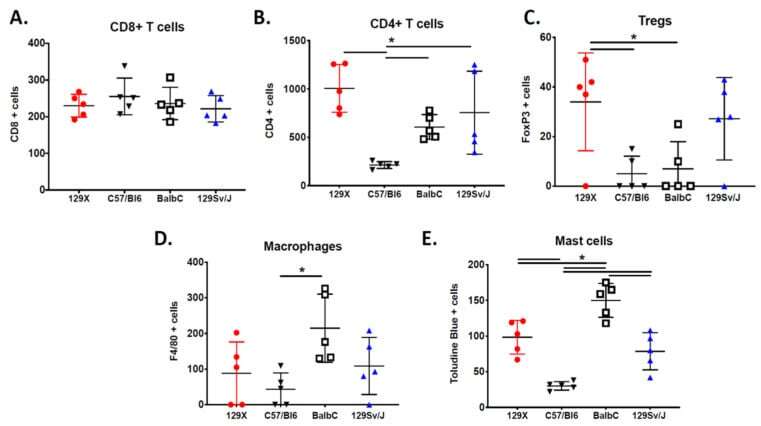
- Figure 3 The MPNST immune landscape is determined by genetic background. ( A ) Levels of CD8+ T cells in terminally-harvested MPNSTs are similar across all host strains. ( B ) Infiltration of CD4+ T cells are significantly lower in tumors from C57BL/6 mice compared to MPNSTs in mice from 129X1, BALB/c, and 129/SvJae backgrounds. ( C ) Foxp3+ Tregs are detected at higher levels in tumors from 129X1 mice compared to C57BL/6 and BALB/c mice. ( D ) MPNSTs from BALB/c mice have significantly higher levels of infiltrating F4/80+ macrophages compared to C57BL/6 mice. ( E ) Mast cell infiltration is higher in tumors from BALB/c mice compared to 129/SvJae, C57BL/6, and 129X1 mice. Mast cell levels are lowest in MPNSTs from C57BL/6 mice. 129X1 (red circles), C57BL/6 (black triangles), BABL/c (white squares), and 129/SvJae (blue triangles). Analyzed by one-way ANOVA with Tukey's multiple comparison test. A p -value of less than 0.05 is considered statistically significant and is denoted by ""*"" ( n = 5 tumors per strain).
- Submitted by
- Invitrogen Antibodies (provider)
- Main image
- Experimental details
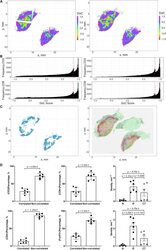
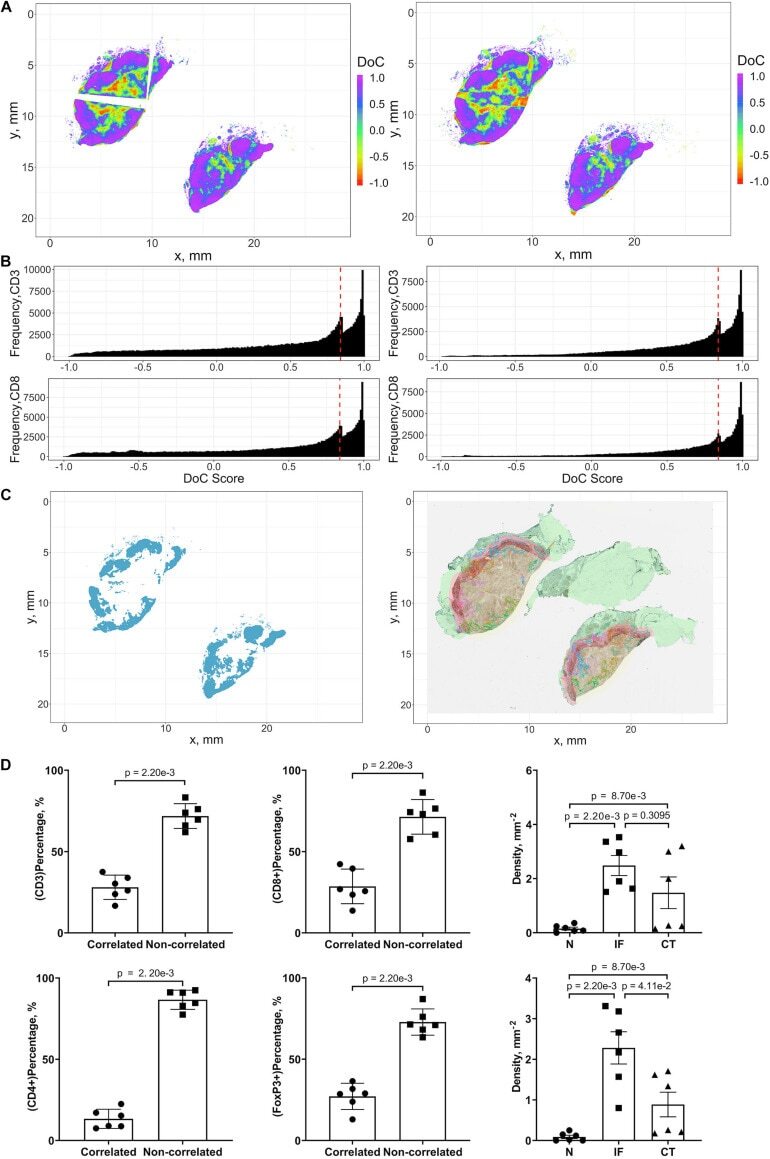
- FIGURE 9 Results of positive correlation analysis. In this study, we analyze two pairs of markers: CD3+, CD8+ and CD4+, FoxP3+. Each marker within the correlation pair is defined as a ""channel"". (A) DoC scores distributions for Cases 1A (left island) and 1B (right island). (B) Histograms of CD3+ and CD8+ DoC scores for Case 1A (left) and 1B (right). Red line is the predetermined threshold to select potential correlated cells. (C) Selected cells for both channels are mapped for clustering analysis (left) using HDBSCAN algorithm. We then define those clusters that both channels are involved as correlation hotspots (right, each cluster is represented by a colored outline). Green: normal tissue (N); Red: invasive front (IF); Yellow: central tumor (CT). (D) Statistical analysis. Top row: proportions of correlated CD3+ and CD8+ cells and density of correlated hotspots in different regions; bottom row: same metrics for CD4+ and FoxP3+.
- Submitted by
- Invitrogen Antibodies (provider)
- Main image
- Experimental details
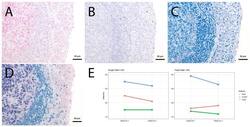
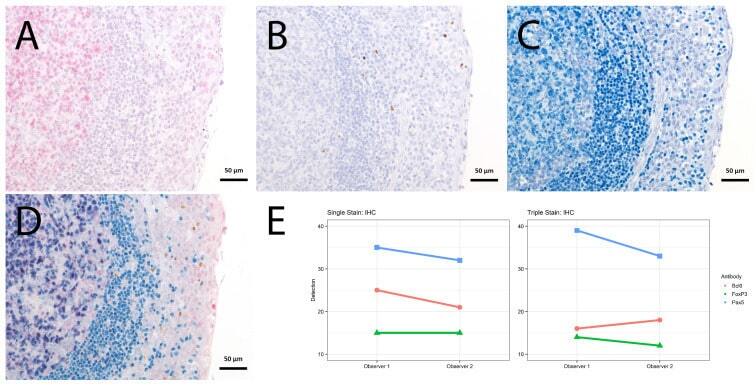
- Figure 4 Single vs. triple stainings, immunohistochemistry on tonsil sections. ( A - C ) Single stainings: ( A ) Bcl6 red after 15 min TRIS pH 9, ( B ) FoxP3 brown after 20 min TRIS pH 6.1, ( C ) PAX5 blue after 20 min TRIS pH 6.1. ( D ) Human tonsil with triple staining IHC, according to the FOLGAS protocol: Bcl6 red, FoxP3 brown, PAX5 blue; antigen retrievals equivalent to the corresponding single staining. Magnifications indicated by bar. ( E ) Sum of H-scores of the respective stainings under single and triple staining conditions, from two independent observers.
- Submitted by
- Invitrogen Antibodies (provider)
- Main image
- Experimental details
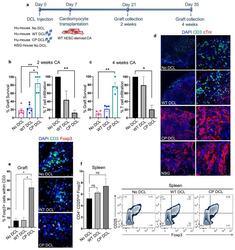
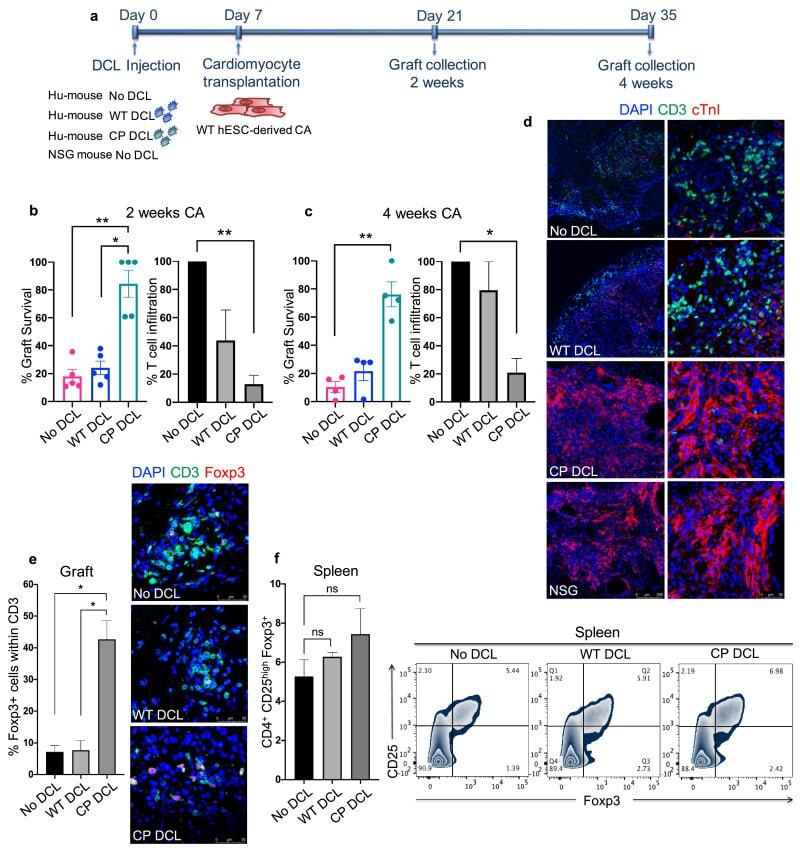
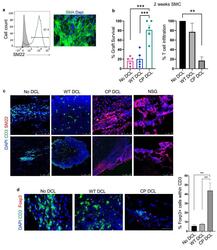
- Fig. 4 CP DCL cells inhibit the allogeneic immune rejection of the same hESC line-derived cardiomyocytes in Hu-mice. (a) Schematic description of the experiments. DCL cells derived from WT and CP hESCs were delivered via the tail vein into Hu-mice. The experiments were performed using 2 different hESCs lines, H1 and HUES3. Seven days after intravenous injection of DCLs, the same hESC line-derived cardiomyocytes were transplanted into the skeletal muscle of Hu-mice and NSG control mice. (b) Cardiomyocyte survival and T cell infiltration into the cardiomyocyte graft 2 weeks after transplantation ( n = 5, H1 n = 3, HUES3 n = 2). (c) Cardiomyocyte survival and T cell infiltration into the cardiomyocyte graft 4 weeks after transplantation ( n = 4, H1 n = 2, HUES3 n = 2). Sections were stained with anti-CD3 (shown in green) and anti-CTnI (shown in red) antibodies. For each section, the numbers of CD3 + T cells and CTnI cells were counted, 3 sections per graft were analyzed. The graft survival rate was calculated in comparison to the graft survival in NSG mice. The T cell infiltration rate was calculated in comparison to that of grafts in Hu-mice without any DCL cell injection. Data are presented as mean values +- SEM. Data from different groups were compared using one-way ANOVA test. * P
- Submitted by
- Invitrogen Antibodies (provider)
- Main image
- Experimental details
- Fig. 5 CP DCL cells inhibit the allogeneic immune rejection of the same hESC line-derived smooth muscle cells in Hu-mice. (a) Characterization of hESC-derived smooth muscle cells (SMCs). The expression of SM22 was analyzed by Flow cytometry and immunofluorescence microscopy, scale bar 50 mum. (b) SMC survival and T cell infiltration in the grafts 2 weeks after transplantation. Seven days after intravenous injection of DCLs, the same hESC line-derived SMCs were transplanted into the skeletal muscle of Hu-mice and NSG control mice ( n = 5). Data are presented as mean values +- SEM. Data from different groups were compared using one-way ANOVA test. ** p

- Submitted by
- Invitrogen Antibodies (provider)
- Main image
- Experimental details
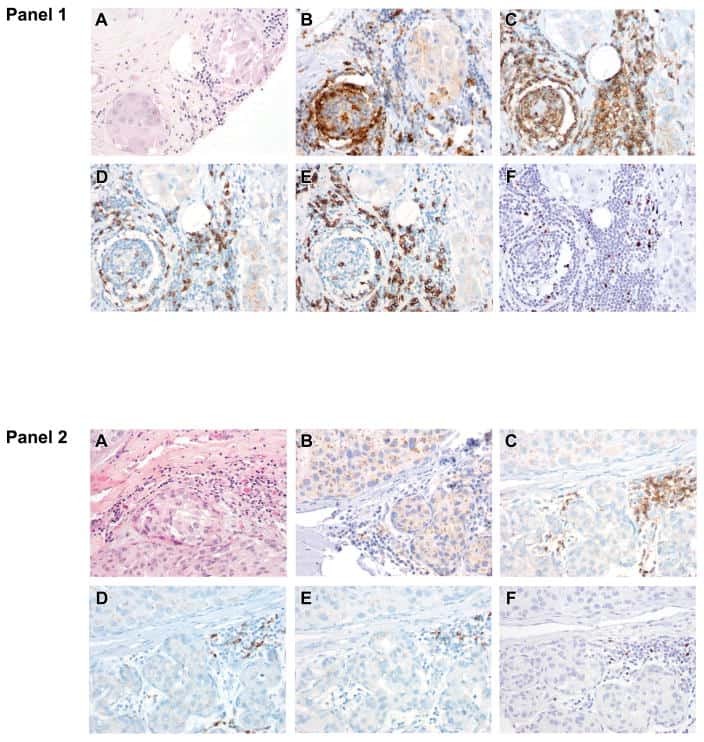
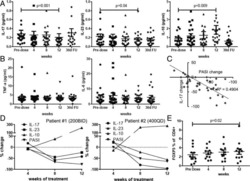
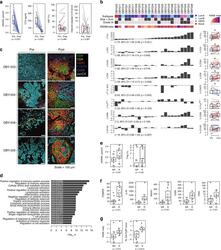
- Fig. 5 The immunomodulatory role of anti-RANKL in BC. a Change from baseline in serum levels of free-sRANKL ( n = 23, p = 2.384e-07) and CTX ( n = 17, p = 1.526e-05) (significance assessed by the two-tailed sign test), the percentage of Ki-67-positive cells ( p = 0.485) and the staining of activated caspase-3 ( p = 0.391) (H-score) ( n = 24) (significance assessed by two-tailed paired t -tests). Boxplots display median line, IQR boxes, 1.5 x IQR whiskers, and data points. b Each bar plot shows the change from baseline (Delta; post- minus pretreatment values) of the immune parameters assessed using HE (TILs) and IHC (CD3, CD20, CD8, FOXP3, proliferative TILs (TILs Ki67+ ), CD68, and CD163). Each bar represents one patient, which are ranked by their increase in stromal TIL levels. Geometric mean changes, 95% CIs, and p -values are shown below each bar plot. For each measured parameter, the corresponding boxplot is displayed on the right-hand side. Boxplots display median line, IQR boxes, 1.5 x IQR whiskers, and data points. Tumor characteristics and tumor RANK metagene expression at baseline are shown above. p; p -values derived from two-tailed paired t -tests (* p < 0.05) # . c Representative micrographs of multiplex IHC of pre- and posttreatment tumor sections from the four patients with the highest immunomodulatory response. White scale bar, 100 mum. d Top 20 significantly enriched pathways after denosumab treatment, identified by GAGE. e Comparison of baseline serum levels

- Submitted by
- Invitrogen Antibodies (provider)
- Main image

- Experimental details
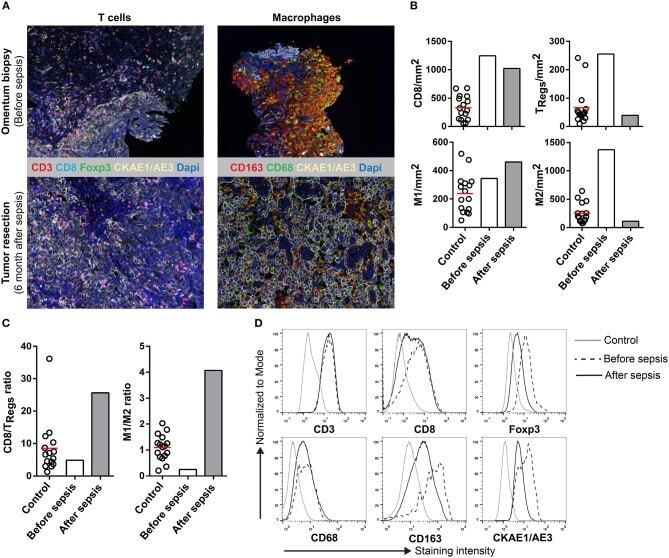
- Figure 1 Multiplex IHC on tissue before and after sepsis. (A) Images showing T cell infiltration and macrophage infiltration in tissue before (omentum biopsy) and after (tumor resection) sepsis. CKAE1/AE3 was used to visualize tumor cells. Effector T cells were characterized as CD3 + CD8 + , regulatory T cells as CD3 + Foxp3 + , M1 macrophages as CD68 + , and M2 macrophages as CD163 + . (B) CD8 T cells, T Regs , M1 and M2 macrophages per mm 2 . Immune cells were quantified in control tissue, and in tissue obtained before and after sepsis. (C) CD8 effector T cell/T Reg ratio and M1/M2 ratio before and after sepsis. (D) Average staining intensity of immune cell markers before and after sepsis. Unstained tissue was used as control. Untreated primary tumor from stage III and IV ovarian cancer patient were used as control ( n = 16). Red line indicates mean.
- Submitted by
- Invitrogen Antibodies (provider)
- Main image
- Experimental details
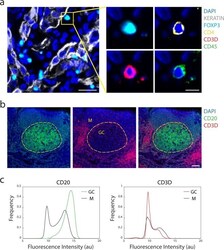
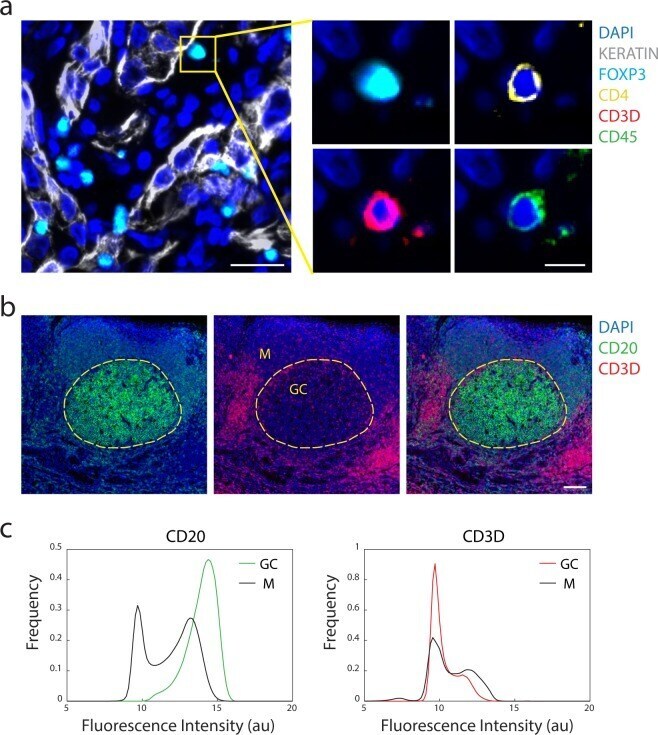
- Fig. 3 Antibody staining quality. ( a ) Immunofluorescence image from LUNG-3-PR showing epithelial tumor cells marked by Keratin (white) and a regulatory T cell marked by FOXP3 (cyan), CD4 (yellow), CD3D (red), and CD45 (green) (scale bar: 25 um; inset scale bar: 10 um). ( b ) A region of TONSIL-1 showing CD20 (green) and CD3D (red) expression. Area inside yellow dashed circle denotes germinal center (GC), and area outside denotes the mantle (M) region (scale bar: 100 um). ( c ) Probability density function of fluorescence signal intensity of every pixel in the germinal center (n = 1,446,450 pixels) and mantle (n = 4,369,358 pixels) for CD20 and CD3D within the region shown in ( b ). X-axis is fluorescence intensity (log2 au) and y-axis is frequency of pixels.
- Submitted by
- Invitrogen Antibodies (provider)
- Main image

- Experimental details
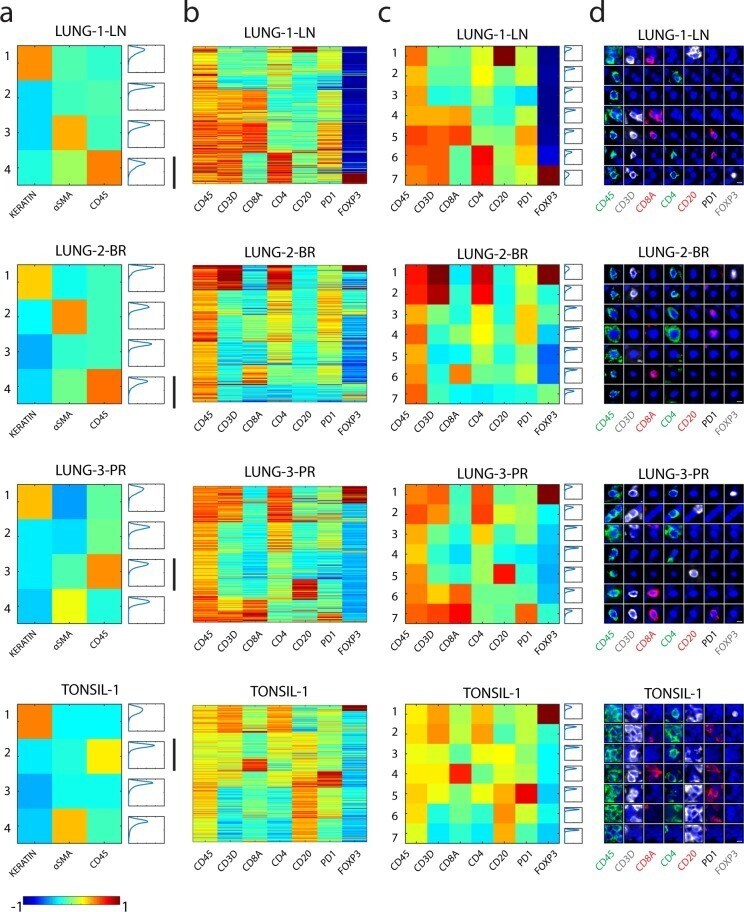
- Fig. 5 Heatmaps of cell populations from lung cancer and tonsil tissues using k-means clustering demonstrates distinct cell immune populations with expected patterns of biomarker expression. ( a ) Heatmap of the expression of Keratin, alphaSMA, and CD45 in all cells that were collected from LUNG-1-LN, LUNG-2-BR, LUNG-3-PR, and TONSIL-1 using k-means clustering. Each row is a cluster. The last column in each heat map shows the probability density function (pdf) plot showing the fit of each cell within the cluster, with the x-axis denoting the frequency of cells and y-axis denoting the Euclidean distance of the cell from the centroid of the cluster. The black vertical bars mark the immune cluster with high CD45 expression. ( b , c ) Heatmaps showing the expression of seven lymphocyte markers (CD45, CD3D, CD8A, CD4, CD20, PD1, FOXP3) from the cells within the CD45 high cluster from panel (a). ( b ) Each row represents protein marker expression data from a single cell or ( c ) each row represents a cluster. Note that fluorescence intensity values were log transformed and normalized between -1 to 1 as indicated by the color bar. ( d ) Galleries of immunofluorescence images of representative cells from each cluster in ( c ). (Scale bar: 5 um).
- Submitted by
- Invitrogen Antibodies (provider)
- Main image
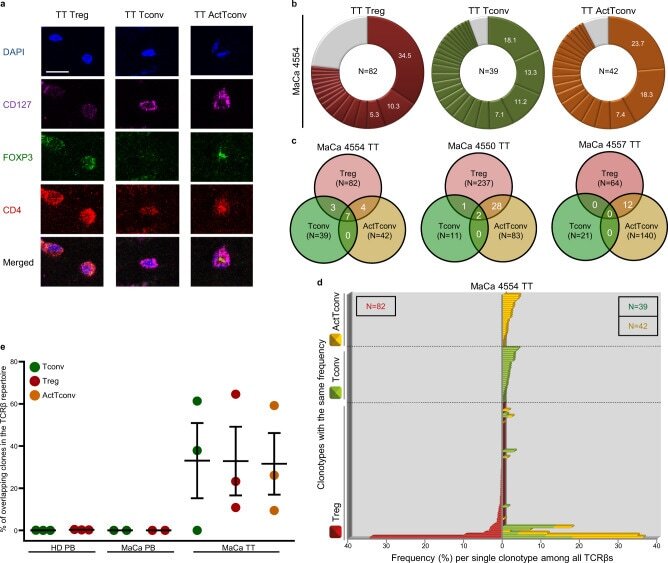
- Experimental details
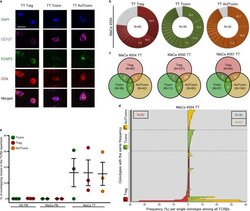
- Fig. 6 Major overlap between Treg and Tconv subsets in breast tumors. a Representative immunostaining of FFPE breast tumor tissue (TT) from n = 3 biologically independent replicates. CD4 (red), CD127 (purple), FOXP3 (green), DAPI (blue). TT Treg (CD4 + FOXP3 + CD127 - ), TT Tconv (CD4 + FOXP3 - CD127 + ), TT ActTconv (CD4 + FOXP3 + CD127 + ). Scale bar denotes 2.32 um. b Pie chart of all clonotypes (unique TCRbeta nucleotide sequences) detected among TT Treg (red), TT Tconv (green), and TT ActTconv (orange) in order of decreasing percentage (%). Gray slices correspond to the TCRbeta repertoire fraction that contains clonotypes with a frequency below 1%. Representative data from breast cancer patient with mammary gland adenocarcinoma MaCa 4554 from n = 3 biologically independent replicates. c Venn diagram of shared clonotypes (white) between TT Treg, TT Tconv, and TT ActTconv within each patient. d Frequency of common clonotypes between TT Treg, TT Tconv, and TT ActTconv in relation to the frequency distribution of all clonotypes per subset. N , total number of clonotypes recovered from TT Treg (red), TT Tconv (green), and TT ActTconv (orange). e Total frequency of Treg clonotypes overlapping with Tconv among Tconv (green), with Tconv and ActTconv among Treg (red) or with ActTconv among ActTconv (orange) either in peripheral blood (PB) or within TT in n = 3 MaCa patients and n = 3 healthy individuals (HD) (cumulative data, mean +- s.e.m.). n refers to biologically independent