Explore
 Validate
 Learn
Learn Immunocytochemistry
Antibody data
- Antibody Data
- Antigen structure
- References [1]
- Comments [0]
- Validations
- Immunocytochemistry [2]
- Immunohistochemistry [1]
- Other assay [7]
Submit
Validation data
Reference
Comment
Report error
- Product number
- PA5-59429 - Provider product page

- Provider
- Invitrogen Antibodies
- Product name
- TRAPPC8 Polyclonal Antibody
- Antibody type
- Polyclonal
- Antigen
- Recombinant protein fragment
- Description
- Immunogen sequence: DYDLNISATT PWFESYRETF LQSMPASDHE FLNHYLACML VASSSEAEPV EQFSKLSQEQ HRIQHNSDYS YPKWFIPNTL KYYVLLHDVS AGDE Highest antigen sequence identity to the following orthologs: Mouse - 95%, Rat - 96%.
- Reactivity
- Human
- Host
- Rabbit
- Isotype
- IgG
- Vial size
- 100 μL
- Concentration
- 0.4 mg/mL
- Storage
- Store at 4°C short term. For long term storage, store at -20°C, avoiding freeze/thaw cycles.
Submitted references Distinct Roles of TRAPPC8 and TRAPPC12 in Ciliogenesis via Their Interactions With OFD1.
Zhang C, Li C, Siu GKY, Luo X, Yu S
Frontiers in cell and developmental biology 2020;8:148
Frontiers in cell and developmental biology 2020;8:148
No comments: Submit comment
Supportive validation
- Submitted by
- Invitrogen Antibodies (provider)
- Main image

- Experimental details
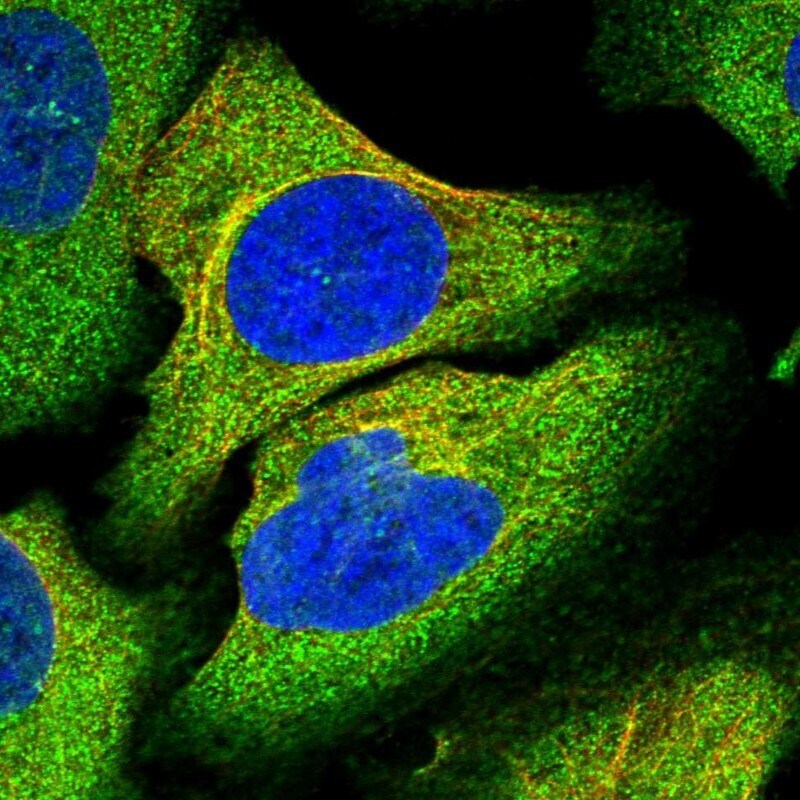
- Immunofluorescent staining of TRAPPC8 in human cell line U-2 OS shows positivity in cytoplasm & microtubules. Samples were probed using a TRAPPC8 Polyclonal Antibody (Product # PA5-59429).

- Submitted by
- Invitrogen Antibodies (provider)
- Main image

- Experimental details
- Immunofluorecent analysis of TRAPPC8 in human cell line U-2 OS using TRAPPC8 Polyclonal Antibody (Product # PA5-59429). Staining shows localization to cytosol and microtubules.
Supportive validation
- Submitted by
- Invitrogen Antibodies (provider)
- Main image
- Experimental details
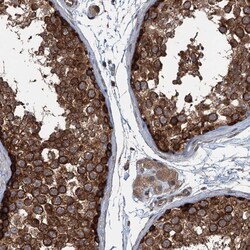
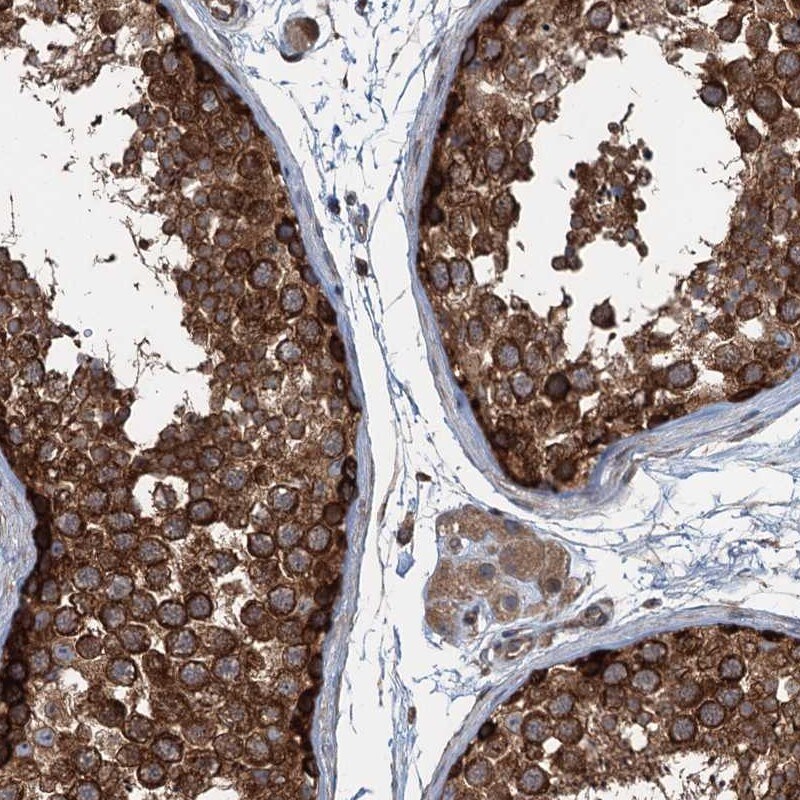
- Immunohistochemical analysis of TRAPPC8 in human testis using TRAPPC8 Polyclonal Antibody (Product # PA5-59429) shows strong cytoplasmic positivity in cells in seminiferous tubules.
Supportive validation
- Submitted by
- Invitrogen Antibodies (provider)
- Main image
- Experimental details
- NULL
- Submitted by
- Invitrogen Antibodies (provider)
- Main image
- Experimental details
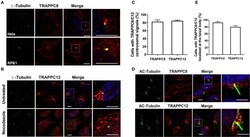
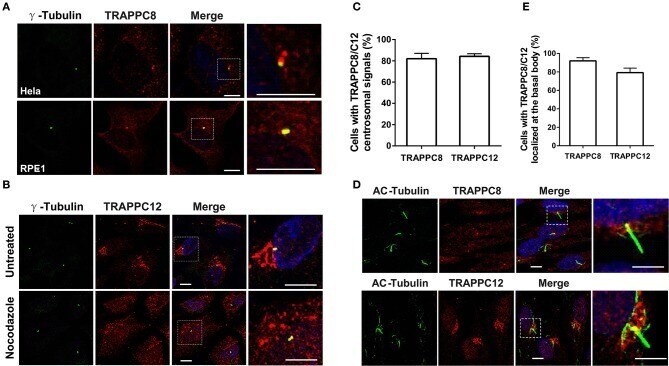
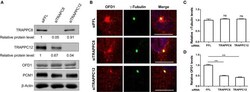
- Figure 1 TRAPPC8 and TRAPPC12 are localized to basal bodies and centrosomes. (A) TRAPPC8 was co-localized with centrosome marker gamma-tubulin in Hela and hTERT-RPE1 cells. (B) TRAPPC12 was co-localized with gamma-tubulin in hTERT-RPE1 cells that were prior treated with or without nocodazole for 1 h. (C) Quantifications of data shown in (A,B) . Percentage of cells with TRAPPC8 or TRAPPC12 centrosomal signals were scored TRAPPC8, n = 82; TRAPPC12, n = 72. Mean +- SEM. (D) TRAPPC8 and TRAPPC12 were stained with axoneme marker acetylated alpha-Tubulin (AC-tubulin) in hTERT-RPE1 cells after the cells were induced to form cilia with serum starvation for 24 h. observe (E) Percentage of cells with TRAPPC8 or TRAPPC12 signals localized at the basal body. TRAPPC8, n = 108; TRAPPC12, n = 96. Mean +- SEM. Scale bar, 10 mum. Similar results were observed in three independent experiments.
- Submitted by
- Invitrogen Antibodies (provider)
- Main image
- Experimental details
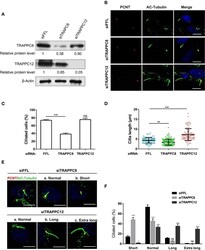
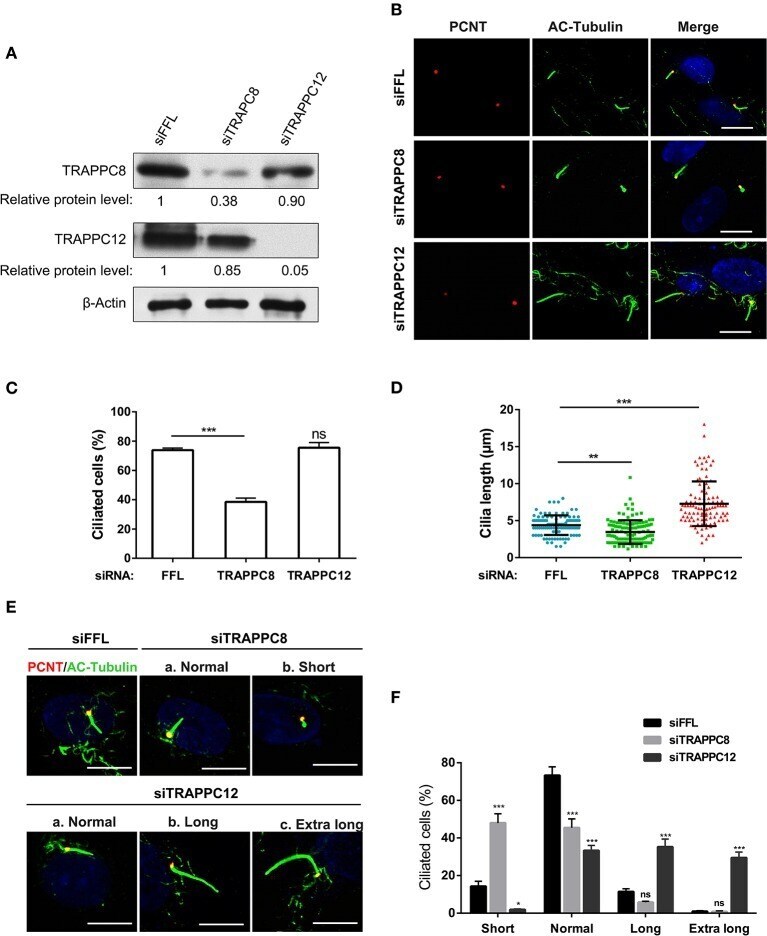
- Figure 2 TRAPPC8 and TRAPPC12 depletions change ciliary length. (A) hTERT-RPE1 cells were transfected with control (siFFL), TRAPPC8 siRNA (siTRAPPC8) or TRAPPC12 siRNA (siTRAPPC12) for 72 h. FFL siRNA targets the firefly luciferase gene sequence, which is not present in human genome, and therefore, serves as non-targeting siRNA control. The expression level of the indicated proteins was analyzed from whole cell lysates by immunoblotting using antibodies against TRAPPC8, and TRAPPC12. beta-Actin served as a loading control. (B) hTERT-RPE1 cells depleted TRAPPC8 or TRAPPC12 were induced with primary cilum formation. The approximate positions of the centrosome were indicated by PCNT (pericentrin) staining and primary cilia were indicated by AC-tubulin. (C,D) Percentage of cells with primary cilia and quantification of ciliary length in ciliated cells. Cilium length was measure by imageJ software and based on the scale bar length at 10 mum to set measurement scale. siFFL, n = 105; siTRAPPC8, n = 121; siTRAPPC12, n = 105. Mean +- SEM, * p < 0.05;** p < 0.01; *** p < 0.001, no matching or pairing one-way ANOVA. (E) TRAPPC8 depletion caused short primary cilia, while TRAPPC12 depletion caused aberrantly long primary cilia. (F) Percentage of cells with short cilia (0-3 mum); with normal cilia (3-6 mum); with long cilia (6-8 mum); with extra long cilia (>8 mum). siFFL, n = 168; siTRAPPC8, n = 185; siTRAPPC12, n = 165. no matching or pairing one-way ANOVA. Si
- Submitted by
- Invitrogen Antibodies (provider)
- Main image

- Experimental details
- Figure 4 TRAPPIII interacts with OFD1. (A) Myc-tagged OFD1 (Myc-OFD1) and NTAP-tagged TRAPPC8 (NTAP-TRAPPC8) or TRAPPC12 (NTAP-TRAPPC12) were co-transfected into the HEK293T cells, and then cell lysates were subjected to immunoprecipitation with an anti-Myc antibody. Approximately 30% of immunoprecipitants were loaded on SDS PAGE (B) hTERT-RPE1 cells were transfected with GFP-tagged OFD1 and stained for TRAPPC8 and TRAPPC12 with antibodies to determine the colocalization of TRAPPC8 or TRAPPC12 and OFD1. (C) Percentage of cells with TRAPPC8 or TRAPPC12 colocalized with GFP-OFD1. TRAPPC8, n = 34; TRAPPC12, n = 38. Mean +- SEM. Scale bar, 10 mum. Similar results were observed in three independent experiments.

- Submitted by
- Invitrogen Antibodies (provider)
- Main image

- Experimental details
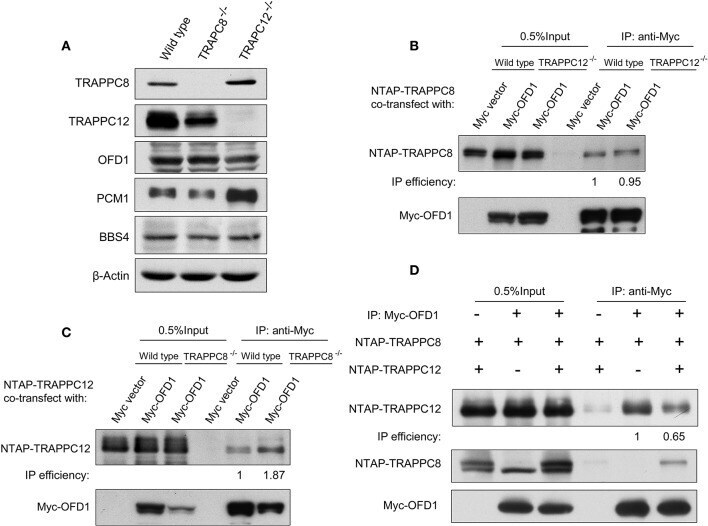
- Figure 5 TRAPPC8 binds OFD1 and inhibits TRAPPC12-OFD1 interactions. (A) Immunoblotting analysis of TRAPPC8, TRAPPC12, OFD1, PCM1, and BBS4 proteins in wildtype control, TRAPPC8- or TRAPPC12-deleted HEK293T cells. beta-Actin served as a loading control. (B) The interaction between Myc-tagged OFD1 (Myc-OFD1) and NTAP-tagged TRAPPC8 (NTAP-TRAPPC8) were determined in the wild type or TRAPPC12 -/- HEK293T cells by co-IP experiment. Approximately 30% of immunoprecipitants were loaded for analysis. (C) The interaction between Myc-tagged OFD1 (Myc-OFD1) and NTAP-tagged TRAPPC12 (NTAP-TRAPPC12) were determined in the wild type or TRAPPC8 -/- HEK293T cells by co-IP experiment. Approximately 30% of immunoprecipitants were loaded for analysis. (D) NTAP-TRAPPC8 and NTAP-TRAPPC12 were co-expressed with Myc-OFD1 to allow competition of binding. Co-IP experiment was performed to pull down Myc-OFD1 and the extent of binding by TRAPPC8 or TRAPPC12 was investigated by immunoblotting. IP efficiency is calculated as the ratio of co-immunoprecipitated OFD1 proteins in TRAPPC8 and TRAPPC12 IP samples. Similar results were observed in three independent experiments.
- Submitted by
- Invitrogen Antibodies (provider)
- Main image
- Experimental details
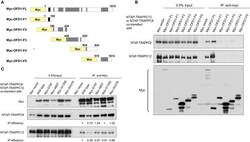
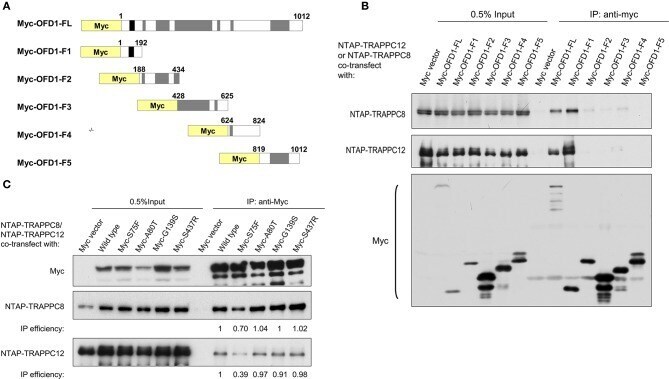
- Figure 6 TRAPPIII interacts with the LisH domain of OFD1. (A) Schematic diagram of the indicated full-length OFD1 (FL) and its truncation constructs. The LisH (black), Coiled-coil (grey) and the numbers of amino acid residues in each constructs are indicated. (B) Lysates from HEK293T cells co-transfected with various OFD1 deletion constructs and NTAP-TRAPPC8 or NTAP-TRAPPC12 were subjected to immunoprecipitation and immunoblotted for Myc and TRAPPC8 and TRAPPC12. (C) OFD1 mutant S75F reduces the interaction with TRAPPC8 and TRAPPC12. The indicated OFD1 mutants were co-expressed with TRAPPC8 or TRAPPC12 and the strength of their interactions were determined by co-IP experiment. IP efficiency is calculated as the ratio of immunoprecipitated TRAPPC8/OFD1 or TRAPPC12/OFD1. Similar results were observed in three independent experiments.
- Submitted by
- Invitrogen Antibodies (provider)
- Main image
- Experimental details
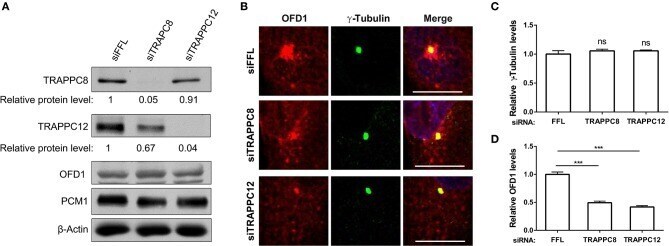
- Figure 7 TRAPPIII depletion reduces the amount of OFD1 at centriolar satellites. (A) The efficiency of depletion for TRAPPC8 and TRAPPC12. The expression level of the indicated proteins was analyzed from whole cell lysates by immunoblotting using antibodies against TRAPPC8, TRAPPC12, OFD1, and PCM1. beta-Actin served as a loading control. (B) Depletion of TRAPPC8 or TRAPPC12 reduced OFD1 puncta. Endogenous OFD1 and the centrosome were detected with OFD1 antibody and the centrosome marker gamma-Tubulin in hTERT-RPE1 cells. (C) Quantitative analysis of gamma-Tubulin puncta. (D) Quantitative analysis of OFD1 puncta was carried out by measuring the intensities of fluorescence in a 4 mum 2 circular area around the centrosome by imageJ. siFFL, n = 100; siTRAPPC8, n = 100; siTRAPPC12, n = 80. Mean +- SEM, *** p < 0.001, no matching or pairing one-way ANOVA. Scale bar, 10 mum. Similar results were observed in three independent experiments.