Explore
 Validate
 Learn
Learn Western blot
 Immunocytochemistry
Antibody data
- Antibody Data
- Antigen structure
- References [1]
- Comments [0]
- Validations
- Immunocytochemistry [1]
- Other assay [3]
Submit
Validation data
Reference
Comment
Report error
- Product number
- PA5-102893 - Provider product page

- Provider
- Invitrogen Antibodies
- Product name
- IRG1 Polyclonal Antibody
- Antibody type
- Polyclonal
- Antigen
- Synthetic peptide
- Description
- Antibody detects endogenous levels of total IRG1.
- Reactivity
- Human
- Host
- Rabbit
- Isotype
- IgG
- Vial size
- 100 μL
- Concentration
- 1 mg/mL
- Storage
- -20°C
Submitted references The Tumor Necrosis Factor Alpha and Interleukin 6 Auto-paracrine Signaling Loop Controls Mycobacterium avium Infection via Induction of IRF1/IRG1 in Human Primary Macrophages.
Gidon A, Louet C, Røst LM, Bruheim P, Flo TH
mBio 2021 Oct 26;12(5):e0212121
mBio 2021 Oct 26;12(5):e0212121
No comments: Submit comment
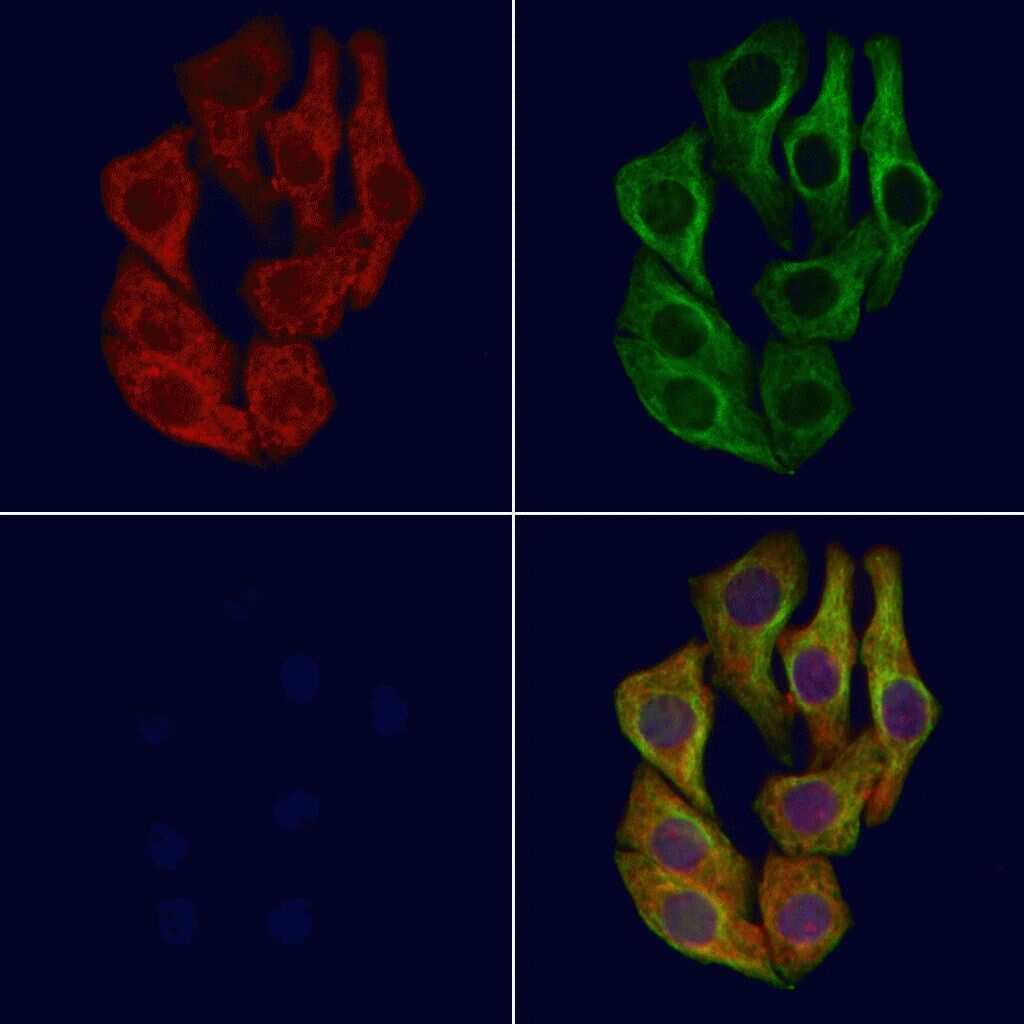
Supportive validation
- Submitted by
- Invitrogen Antibodies (provider)
- Main image
- Experimental details
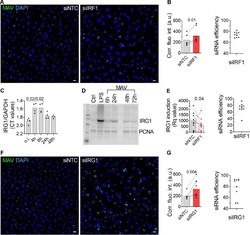
- Immunofluorescent analysis of IRG1 in HeLa cells. Samples were fixed with paraformaldehyde, permeabilized with 0.1% Triton X-100, blocked with 10% serum (45 min at 25°C), incubated with mouse anti-beta tubulin and IRG1 polyclonal antibody (Product # PA5-102893) using a dilution of 1:200 (1 hr, 37°C), and followed by goat anti-rabbit IgG Alexa Fluor 594 (red) and goat anti-mouse IgG Alexa Fluor 488 (green).
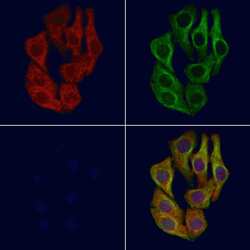
Supportive validation
- Submitted by
- Invitrogen Antibodies (provider)
- Main image
- Experimental details
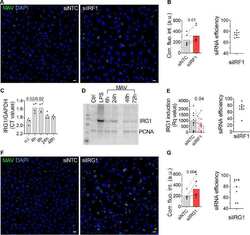
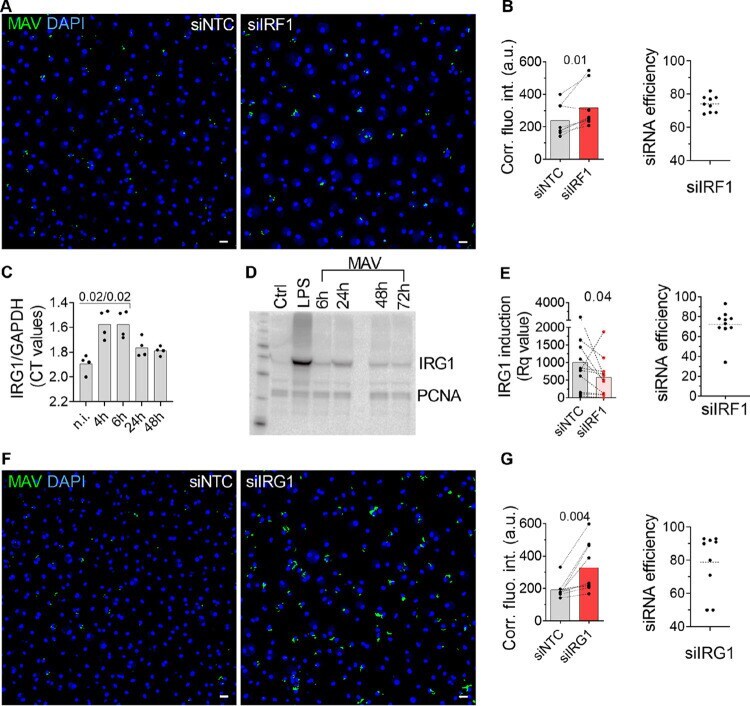
- FIG 4 IRF1 contributes to controlling M. avium infection. (A, B) Human MDMs pretreated with siRNA against IRF1 were infected with M. avium -DsRed for 10 min, followed by a chase of 72 h. M. avium intracellular growth was monitored by confocal microscopy. (A) Merged images showing Hoechst stain (blue) and M. avium (green). (B) Quantification of mycobacterial loads. Dots represent the average corrected fluorescence intensity (arbitrary unit) per individual donor (>500 cells per donor and per time point), and bar charts represent averages of results for 9 individual donors for the nontargeting control siRNA (siNTC, gray) and siIRF1 (red). siRNA efficiency for each individual donor was tested by real-time PCR and plotted as a percentage decrease from the level for the siNTC (B, right). The P value between the siNTC and siIRF1 conditions was calculated using the nonparametric Wilcoxon paired signed-rank test. (C) IRG1 mRNA expression in human MDMs 4 h, 6 h, 24 h, 48 h, and 72 h postinfection was assessed by real-time PCR. Bar charts represent averages of IRG1 CT values normalized to that for GAPDH of 4 donors per time point. IRG1 was not detected in uninfected control cells and set arbitrarily at 40 CT to point out the increase in IRG1 (D). Western blot analysis shows IRG1 protein expression 4 h, 6 h, 24 h, 48 h, and 72 h postinfection. Uninfected human MDMs were challenged with 100 ng/ml LPS for 24 h as a positive control for IRG1 production. The blot is representative of 2 indep

- Submitted by
- Invitrogen Antibodies (provider)
- Main image
- Experimental details
- FIG 4 IRF1 contributes to controlling M. avium infection. (A, B) Human MDMs pretreated with siRNA against IRF1 were infected with M. avium -DsRed for 10 min, followed by a chase of 72 h. M. avium intracellular growth was monitored by confocal microscopy. (A) Merged images showing Hoechst stain (blue) and M. avium (green). (B) Quantification of mycobacterial loads. Dots represent the average corrected fluorescence intensity (arbitrary unit) per individual donor (>500 cells per donor and per time point), and bar charts represent averages of results for 9 individual donors for the nontargeting control siRNA (siNTC, gray) and siIRF1 (red). siRNA efficiency for each individual donor was tested by real-time PCR and plotted as a percentage decrease from the level for the siNTC (B, right). The P value between the siNTC and siIRF1 conditions was calculated using the nonparametric Wilcoxon paired signed-rank test. (C) IRG1 mRNA expression in human MDMs 4 h, 6 h, 24 h, 48 h, and 72 h postinfection was assessed by real-time PCR. Bar charts represent averages of IRG1 CT values normalized to that for GAPDH of 4 donors per time point. IRG1 was not detected in uninfected control cells and set arbitrarily at 40 CT to point out the increase in IRG1 (D). Western blot analysis shows IRG1 protein expression 4 h, 6 h, 24 h, 48 h, and 72 h postinfection. Uninfected human MDMs were challenged with 100 ng/ml LPS for 24 h as a positive control for IRG1 production. The blot is representative of 2 indep
- Submitted by
- Invitrogen Antibodies (provider)
- Main image
- Experimental details
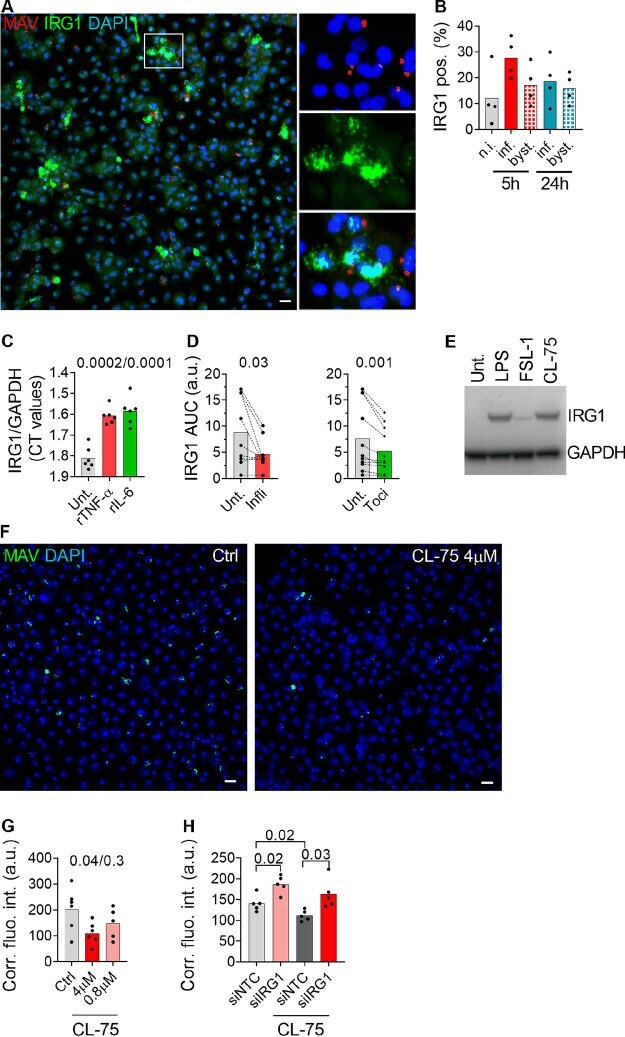
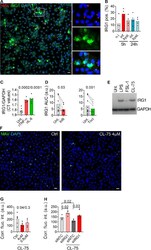
- FIG 5 TNF-alpha and IL-6 contribute to IRG1 induction. Human MDMs were infected with M. avium -CFP for 10 min, followed by chase of 5 h and 24 h. IRG1 mRNA was revealed using RNAscope. (A) Merged images showing nuclei (blue), M. avium -CFP (red), and IRG1 (green). The magnified panels of the inset show single and merged channels. (B) Contributions of the infected and uninfected bystander populations at 5 h and 24 h postinfection. Filled bars represent infected cells, and patterned bars represent bystander cells. Dots represent the average cell count per individual donor (the total cell number was at least 500 per donor and per time point), and bar charts represent averages of results for 4 individual donors. pos., positive. (C) Human MDMs were treated with 25 nM rTNF-alpha or rIL-6 (red or green, respectively) for 4 h. IRG1 expression was probed by real-time PCR. Bar charts represent average IRG1 CT values normalized to the value for GAPDH for rTNF-alpha and rIL-6 from 6 independent donors. (D) Human MDMs were infected with M. avium -CFP for 10 min, followed by a chase of 4 h, 6 h, or 24 h and cotreated with infliximab or tocilizumab (red and green, respectively). IRG1 expression was probed by real-time PCR and quantified by calculating the area under the curve of relative expression values (arbitrary units). Bar charts represent average area under the curve values for infliximab and tocilizumab from 7 independent donors (red and green, respectively). P values between the con