Explore
 Validate
 Learn
Learn Western blot
 Immunocytochemistry
Antibody data
- Antibody Data
- Antigen structure
- References [1]
- Comments [0]
- Validations
- Immunocytochemistry [2]
- Other assay [1]
Submit
Validation data
Reference
Comment
Report error
- Product number
- MA5-27704 - Provider product page

- Provider
- Invitrogen Antibodies
- Product name
- GABBR1 Monoclonal Antibody (N93A/49)
- Antibody type
- Monoclonal
- Antigen
- Other
- Description
- 1 µg/mL of MA5-27704 was sufficient for detection of GABA(B)R1 in 20 µg of rat brain membrane lysate and assayed by colorimetric immunoblot analysis using goat anti-mouse IgG:HRP as the secondary antibody.|Detects approximately 115kDa. No cross-reactivity against GABA(B)R2. This antibody was formerly sold as clone S93A-49.
- Reactivity
- Human, Mouse, Rat
- Host
- Mouse
- Isotype
- IgG
- Antibody clone number
- N93A/49
- Vial size
- 100 μg
- Concentration
- 1 mg/mL
- Storage
- -20°C
Submitted references Vascular amyloid accumulation alters the gabaergic synapse and induces hyperactivity in a model of cerebral amyloid angiopathy.
Cisternas P, Taylor X, Perkins A, Maldonado O, Allman E, Cordova R, Marambio Y, Munoz B, Pennington T, Xiang S, Zhang J, Vidal R, Atwood B, Lasagna-Reeves CA
Aging cell 2020 Oct;19(10):e13233
Aging cell 2020 Oct;19(10):e13233
No comments: Submit comment
Supportive validation
- Submitted by
- Invitrogen Antibodies (provider)
- Main image
- Experimental details
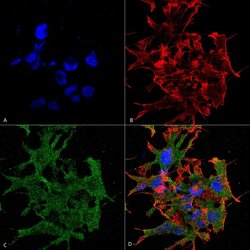
- Immunofluorescent analysis of GABBR1 in human neuroblastoma cell line (SK-N-BE). Sample was fixed with 4% formaldehyde (15 min at RT), incubated with GABBR1 monoclonal antibody (Product # MA5-27704) using a dilution of 1:100 (1 hour at RT), and followed by Goat Anti-Mouse 488, Phalloidin Texas Red and DAPI secondary antibody at a dilution of 1:100, 1:1000 (60 min at RT) and 1:5000 (5 min at RT). Images are shown as follows: (A) DAPI (blue) nuclear stain, B) Phalloidin Texas Red F-Actin stain, C) GABA-B Receptor 1 Antibody, D) Merged image. Magnification: 60x.

- Submitted by
- Invitrogen Antibodies (provider)
- Main image

- Experimental details
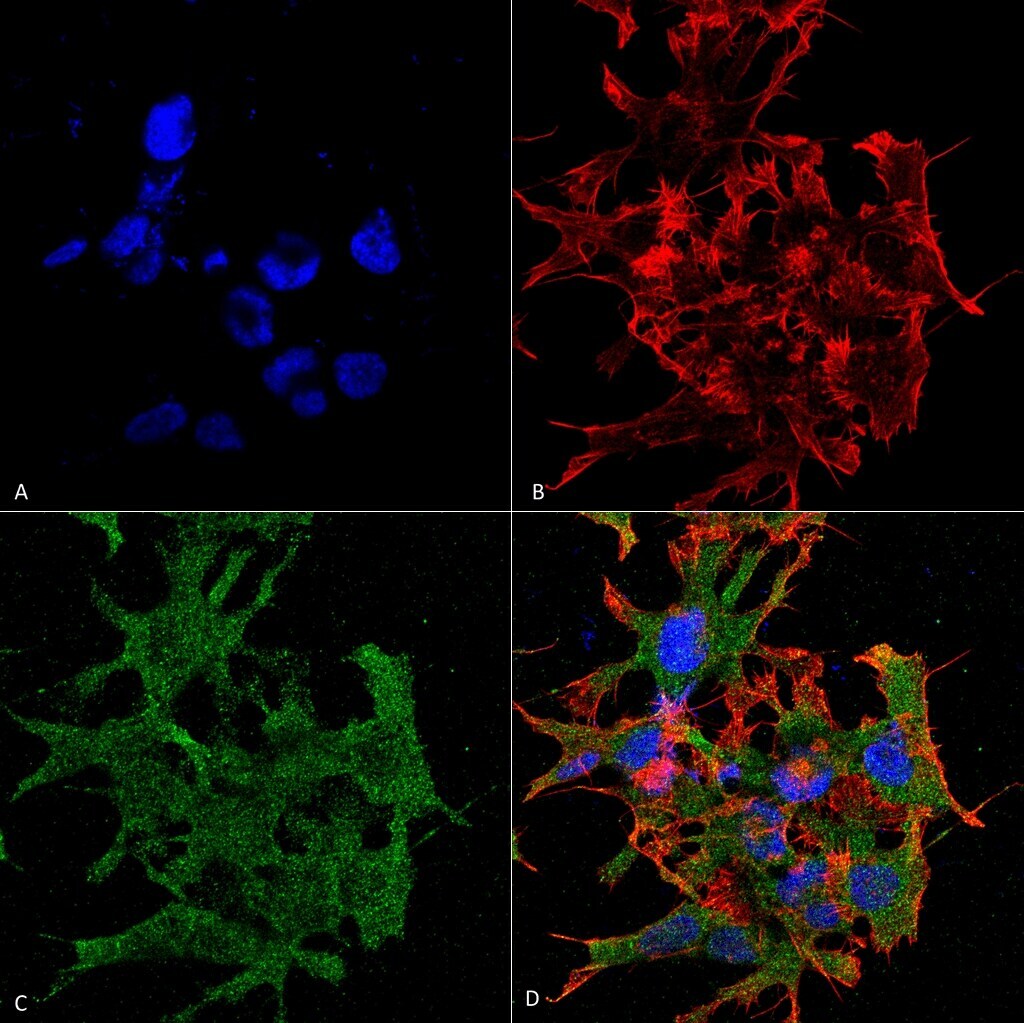
- Immunofluorescent analysis of GABBR1 in human neuroblastoma cell line (SK-N-BE). Sample was fixed with 4% formaldehyde (15 min at RT), incubated with GABBR1 monoclonal antibody (Product # MA5-27704) using a dilution of 1:100 (1 hour at RT), and followed by Goat Anti-Mouse 488, Phalloidin Texas Red and DAPI secondary antibody at a dilution of 1:100, 1:1000 (60 min at RT) and 1:5000 (5 min at RT). Images are shown as follows: (A) DAPI (blue) nuclear stain, B) Phalloidin Texas Red F-Actin stain, C) GABA-B Receptor 1 Antibody, D) Merged image. Magnification: 60x.
Supportive validation
- Submitted by
- Invitrogen Antibodies (provider)
- Main image
- Experimental details
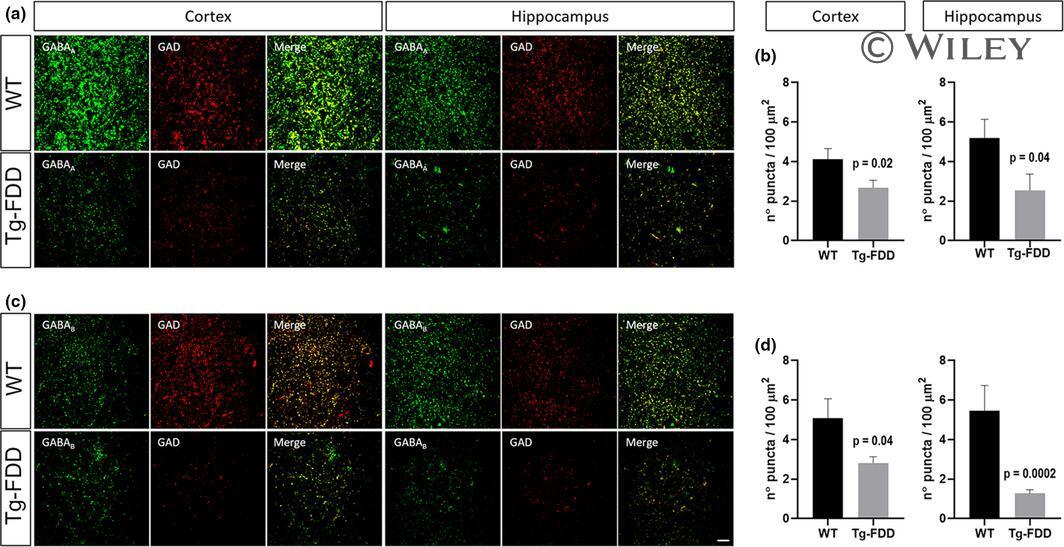
- 4 FIGURE Decrease in the synaptic localization of inhibitory synaptic markers in Tg-FDD mice. (A) Immunofluorescence for GABA A receptor (green) and GAD (red) on cortex and hippocampus. (B) Quantification of the number of merge puncta for both markers on A. (C) Double staining for GABA B receptor (green) and GAD (red). (D) Quantification of the number of merged puncta for both markers on C. p < 0.05 indicated on each graph, Mann-Whitney test, n = 9 photographs from 3 different animals per genotype. Data represented as mean +- SEM. Scale bar 10 mum.