Explore
 Validate
 Learn
Learn16-9500-38
antibody from Invitrogen Antibodies
Targeting: TIGIT
DKFZp667A205, FLJ39873, VSIG9, VSTM3
 Immunohistochemistry
 Flow cytometry
 Other assay
Antibody data
- Antibody Data
- Antigen structure
- References [22]
- Comments [0]
- Validations
- Other assay [27]
Submit
Validation data
Reference
Comment
Report error
- Product number
- 16-9500-38 - Provider product page

- Provider
- Invitrogen Antibodies
- Product name
- TIGIT Monoclonal Antibody (MBSA43), Functional Grade, eBioscience™
- Antibody type
- Monoclonal
- Antigen
- Other
- Description
- Description: The MBSA43 monoclonal antibody reacts with human T cell immunoreceptor with Ig and ITIM domains (TIGIT), which is also known as VSTM3 or WUCAM. This 26 kDa protein is a member of the poliovirus receptor (PVR) family. The expression of TIGIT has been reported on NK cells, regulatory T cells, follicular T helper cells, memory CD4+ T cells, and CD8+ T cells, but it is not expressed on B cells or naive CD4+ T cells. TIGIT may be upregulated on naive CD4+ T cells upon activation. TIGIT can interact with certain members of the PVR and PVR-like families, including CD155, and also mediates the interaction of NK and T cells with antigen presenting cells, fibroblasts, and endothelial cells that express PVR and PVR-like proteins. MBSA43 is reported to crossreact with Rhesus macaque. Applications Reported: This MBSA43 antibody has been reported for use in flow cytometric analysis. In a functional assay, MBSA43 enhances IFN gamma secretion following TCR activation. Applications Tested: This MBSA43 antibody has been tested by flow cytometric analysis. This can be used at less than or equal to 0.25 µg per test. A test is defined as the amount (µg) of antibody that will stain a cell sample in a final volume of 100 µL. Cell number should be determined empirically but can range from 10^5 to 10^8 cells/test. It is recommended that the antibody be carefully titrated for optimal performance in the assay of interest. Storage and handling: Use in a sterile environment. Filtration: 0.2 µm post-manufacturing filtered. Purity: Greater than 90%, as determined by SDS-PAGE. Endotoxin Level: Less than 0.001 ng/µg antibody, as determined by LAL assay. Aggregation: Less than 10%, as determined by HPLC.
- Reactivity
- Human
- Host
- Mouse
- Isotype
- IgG
- Antibody clone number
- MBSA43
- Vial size
- 5 mg
- Concentration
- 1 mg/mL
- Storage
- 4°C
Submitted references TIGIT(+) TIM-3(+) NK cells are correlated with NK cell exhaustion and disease progression in patients with hepatitis B virus‑related hepatocellular carcinoma.
Single-cell RNA sequencing reveals cell heterogeneity and transcriptome profile of breast cancer lymph node metastasis.
SARS-CoV-2-specific T cell memory is sustained in COVID-19 convalescent patients for 10 months with successful development of stem cell-like memory T cells.
Deep spatial profiling of human COVID-19 brains reveals neuroinflammation with distinct microanatomical microglia-T-cell interactions.
Correlations of the expression of γδ T cells and their co-stimulatory molecules TIGIT, PD-1, ICOS and BTLA with PR and PIBF in the peripheral blood and decidual tissues of women with unexplained recurrent spontaneous abortion.
Mycophenolate mofetil enhances the effects of tacrolimus on the inhibitory function of regulatory T cells in patients after liver transplantation via PD-1 and TIGIT receptors.
Imbalance of the CD226/TIGIT Immune Checkpoint Is Involved in the Pathogenesis of Primary Biliary Cholangitis.
TIGIT is upregulated by HIV-1 infection and marks a highly functional adaptive and mature subset of natural killer cells.
Methylome-based cell-of-origin modeling (Methyl-COOM) identifies aberrant expression of immune regulatory molecules in CLL.
Risk-associated alterations in marrow T cells in pediatric leukemia.
A Comprehensive Analysis of Key Immune Checkpoint Receptors on Tumor-Infiltrating T Cells From Multiple Types of Cancer.
TIGIT signaling restores suppressor function of Th1 Tregs.
Optimized RNP transfection for highly efficient CRISPR/Cas9-mediated gene knockout in primary T cells.
PD-1 Blockade Promotes Emerging Checkpoint Inhibitors in Enhancing T Cell Responses to Allogeneic Dendritic Cells.
TIGIT expressing CD4+T cells represent a tumor-supportive T cell subset in chronic lymphocytic leukemia.
Atorvastatin downregulates co-inhibitory receptor expression by targeting Ras-activated mTOR signalling.
HTLV-1 bZIP Factor Enhances T-Cell Proliferation by Impeding the Suppressive Signaling of Co-inhibitory Receptors.
OMIP-037: 16-color panel to measure inhibitory receptor signatures from multiple human immune cell subsets.
TIGIT Marks Exhausted T Cells, Correlates with Disease Progression, and Serves as a Target for Immune Restoration in HIV and SIV Infection.
Effect of chorioamnionitis on regulatory T cells in moderate/late preterm neonates.
Nitric oxide donors increase PVR/CD155 DNAM-1 ligand expression in multiple myeloma cells: role of DNA damage response activation.
The TIGIT/CD226 axis regulates human T cell function.
Yu L, Liu X, Wang X, Yan F, Wang P, Jiang Y, Du J, Yang Z
Oncoimmunology 2021;10(1):1942673
Oncoimmunology 2021;10(1):1942673
Single-cell RNA sequencing reveals cell heterogeneity and transcriptome profile of breast cancer lymph node metastasis.
Xu K, Wang R, Xie H, Hu L, Wang C, Xu J, Zhu C, Liu Y, Gao F, Li X, Wang C, Huang J, Zhou W, Zhou G, Shu Y, Guan X
Oncogenesis 2021 Oct 5;10(10):66
Oncogenesis 2021 Oct 5;10(10):66
SARS-CoV-2-specific T cell memory is sustained in COVID-19 convalescent patients for 10 months with successful development of stem cell-like memory T cells.
Jung JH, Rha MS, Sa M, Choi HK, Jeon JH, Seok H, Park DW, Park SH, Jeong HW, Choi WS, Shin EC
Nature communications 2021 Jun 30;12(1):4043
Nature communications 2021 Jun 30;12(1):4043
Deep spatial profiling of human COVID-19 brains reveals neuroinflammation with distinct microanatomical microglia-T-cell interactions.
Schwabenland M, Salié H, Tanevski J, Killmer S, Lago MS, Schlaak AE, Mayer L, Matschke J, Püschel K, Fitzek A, Ondruschka B, Mei HE, Boettler T, Neumann-Haefelin C, Hofmann M, Breithaupt A, Genc N, Stadelmann C, Saez-Rodriguez J, Bronsert P, Knobeloch KP, Blank T, Thimme R, Glatzel M, Prinz M, Bengsch B
Immunity 2021 Jul 13;54(7):1594-1610.e11
Immunity 2021 Jul 13;54(7):1594-1610.e11
Correlations of the expression of γδ T cells and their co-stimulatory molecules TIGIT, PD-1, ICOS and BTLA with PR and PIBF in the peripheral blood and decidual tissues of women with unexplained recurrent spontaneous abortion.
Liang Q, Tong L, Xiang L, Shen S, Pan C, Liu C, Zhang H
Clinical and experimental immunology 2021 Jan;203(1):55-65
Clinical and experimental immunology 2021 Jan;203(1):55-65
Mycophenolate mofetil enhances the effects of tacrolimus on the inhibitory function of regulatory T cells in patients after liver transplantation via PD-1 and TIGIT receptors.
Zeng Q, Yuan X, Cao J, Zhao X, Wang Y, Liu B, Liu W, Zhu Z, Dou J
Immunopharmacology and immunotoxicology 2021 Apr;43(2):239-246
Immunopharmacology and immunotoxicology 2021 Apr;43(2):239-246
Imbalance of the CD226/TIGIT Immune Checkpoint Is Involved in the Pathogenesis of Primary Biliary Cholangitis.
Deng C, Li W, Fei Y, Wang L, Chen Y, Zeng X, Zhang F, Li Y
Frontiers in immunology 2020;11:1619
Frontiers in immunology 2020;11:1619
TIGIT is upregulated by HIV-1 infection and marks a highly functional adaptive and mature subset of natural killer cells.
Vendrame E, Seiler C, Ranganath T, Zhao NQ, Vergara R, Alary M, Labbé AC, Guédou F, Poudrier J, Holmes S, Roger M, Blish CA
AIDS (London, England) 2020 May 1;34(6):801-813
AIDS (London, England) 2020 May 1;34(6):801-813
Methylome-based cell-of-origin modeling (Methyl-COOM) identifies aberrant expression of immune regulatory molecules in CLL.
Wierzbinska JA, Toth R, Ishaque N, Rippe K, Mallm JP, Klett LC, Mertens D, Zenz T, Hielscher T, Seifert M, Küppers R, Assenov Y, Lutsik P, Stilgenbauer S, Roessner PM, Seiffert M, Byrd J, Oakes CC, Plass C, Lipka DB
Genome medicine 2020 Mar 18;12(1):29
Genome medicine 2020 Mar 18;12(1):29
Risk-associated alterations in marrow T cells in pediatric leukemia.
Bailur JK, McCachren SS, Pendleton K, Vasquez JC, Lim HS, Duffy A, Doxie DB, Kaushal A, Foster C, DeRyckere D, Castellino S, Kemp ML, Qiu P, Dhodapkar MV, Dhodapkar KM
JCI insight 2020 Aug 20;5(16)
JCI insight 2020 Aug 20;5(16)
A Comprehensive Analysis of Key Immune Checkpoint Receptors on Tumor-Infiltrating T Cells From Multiple Types of Cancer.
Li X, Wang R, Fan P, Yao X, Qin L, Peng Y, Ma M, Asley N, Chang X, Feng Y, Hu Y, Zhang Y, Li C, Fanning G, Jones S, Verrill C, Maldonado-Perez D, Sopp P, Waugh C, Taylor S, Mcgowan S, Cerundolo V, Conlon C, McMichael A, Lu S, Wang X, Li N, Dong T
Frontiers in oncology 2019;9:1066
Frontiers in oncology 2019;9:1066
TIGIT signaling restores suppressor function of Th1 Tregs.
Lucca LE, Axisa PP, Singer ER, Nolan NM, Dominguez-Villar M, Hafler DA
JCI insight 2019 Feb 7;4(3)
JCI insight 2019 Feb 7;4(3)
Optimized RNP transfection for highly efficient CRISPR/Cas9-mediated gene knockout in primary T cells.
Seki A, Rutz S
The Journal of experimental medicine 2018 Mar 5;215(3):985-997
The Journal of experimental medicine 2018 Mar 5;215(3):985-997
PD-1 Blockade Promotes Emerging Checkpoint Inhibitors in Enhancing T Cell Responses to Allogeneic Dendritic Cells.
Stecher C, Battin C, Leitner J, Zettl M, Grabmeier-Pfistershammer K, Höller C, Zlabinger GJ, Steinberger P
Frontiers in immunology 2017;8:572
Frontiers in immunology 2017;8:572
TIGIT expressing CD4+T cells represent a tumor-supportive T cell subset in chronic lymphocytic leukemia.
Catakovic K, Gassner FJ, Ratswohl C, Zaborsky N, Rebhandl S, Schubert M, Steiner M, Gutjahr JC, Pleyer L, Egle A, Hartmann TN, Greil R, Geisberger R
Oncoimmunology 2017;7(1):e1371399
Oncoimmunology 2017;7(1):e1371399
Atorvastatin downregulates co-inhibitory receptor expression by targeting Ras-activated mTOR signalling.
Okoye I, Namdar A, Xu L, Crux N, Elahi S
Oncotarget 2017 Nov 17;8(58):98215-98232
Oncotarget 2017 Nov 17;8(58):98215-98232
HTLV-1 bZIP Factor Enhances T-Cell Proliferation by Impeding the Suppressive Signaling of Co-inhibitory Receptors.
Kinosada H, Yasunaga JI, Shimura K, Miyazato P, Onishi C, Iyoda T, Inaba K, Matsuoka M
PLoS pathogens 2017 Jan;13(1):e1006120
PLoS pathogens 2017 Jan;13(1):e1006120
OMIP-037: 16-color panel to measure inhibitory receptor signatures from multiple human immune cell subsets.
Belkina AC, Snyder-Cappione JE
Cytometry. Part A : the journal of the International Society for Analytical Cytology 2017 Feb;91(2):175-179
Cytometry. Part A : the journal of the International Society for Analytical Cytology 2017 Feb;91(2):175-179
TIGIT Marks Exhausted T Cells, Correlates with Disease Progression, and Serves as a Target for Immune Restoration in HIV and SIV Infection.
Chew GM, Fujita T, Webb GM, Burwitz BJ, Wu HL, Reed JS, Hammond KB, Clayton KL, Ishii N, Abdel-Mohsen M, Liegler T, Mitchell BI, Hecht FM, Ostrowski M, Shikuma CM, Hansen SG, Maurer M, Korman AJ, Deeks SG, Sacha JB, Ndhlovu LC
PLoS pathogens 2016 Jan;12(1):e1005349
PLoS pathogens 2016 Jan;12(1):e1005349
Effect of chorioamnionitis on regulatory T cells in moderate/late preterm neonates.
Rueda CM, Wells CB, Gisslen T, Jobe AH, Kallapur SG, Chougnet CA
Human immunology 2015 Jan;76(1):65-73
Human immunology 2015 Jan;76(1):65-73
Nitric oxide donors increase PVR/CD155 DNAM-1 ligand expression in multiple myeloma cells: role of DNA damage response activation.
Fionda C, Abruzzese MP, Zingoni A, Soriani A, Ricci B, Molfetta R, Paolini R, Santoni A, Cippitelli M
BMC cancer 2015 Jan 22;15:17
BMC cancer 2015 Jan 22;15:17
The TIGIT/CD226 axis regulates human T cell function.
Lozano E, Dominguez-Villar M, Kuchroo V, Hafler DA
Journal of immunology (Baltimore, Md. : 1950) 2012 Apr 15;188(8):3869-75
Journal of immunology (Baltimore, Md. : 1950) 2012 Apr 15;188(8):3869-75
No comments: Submit comment
Supportive validation
- Submitted by
- Invitrogen Antibodies (provider)
- Main image
- Experimental details
- NULL
- Submitted by
- Invitrogen Antibodies (provider)
- Main image

- Experimental details
- NULL
- Submitted by
- Invitrogen Antibodies (provider)
- Main image
- Experimental details
- NULL

- Submitted by
- Invitrogen Antibodies (provider)
- Main image
- Experimental details
- NULL

- Submitted by
- Invitrogen Antibodies (provider)
- Main image
- Experimental details
- NULL
- Submitted by
- Invitrogen Antibodies (provider)
- Main image
- Experimental details
- NULL
- Submitted by
- Invitrogen Antibodies (provider)
- Main image
- Experimental details
- NULL

- Submitted by
- Invitrogen Antibodies (provider)
- Main image

- Experimental details
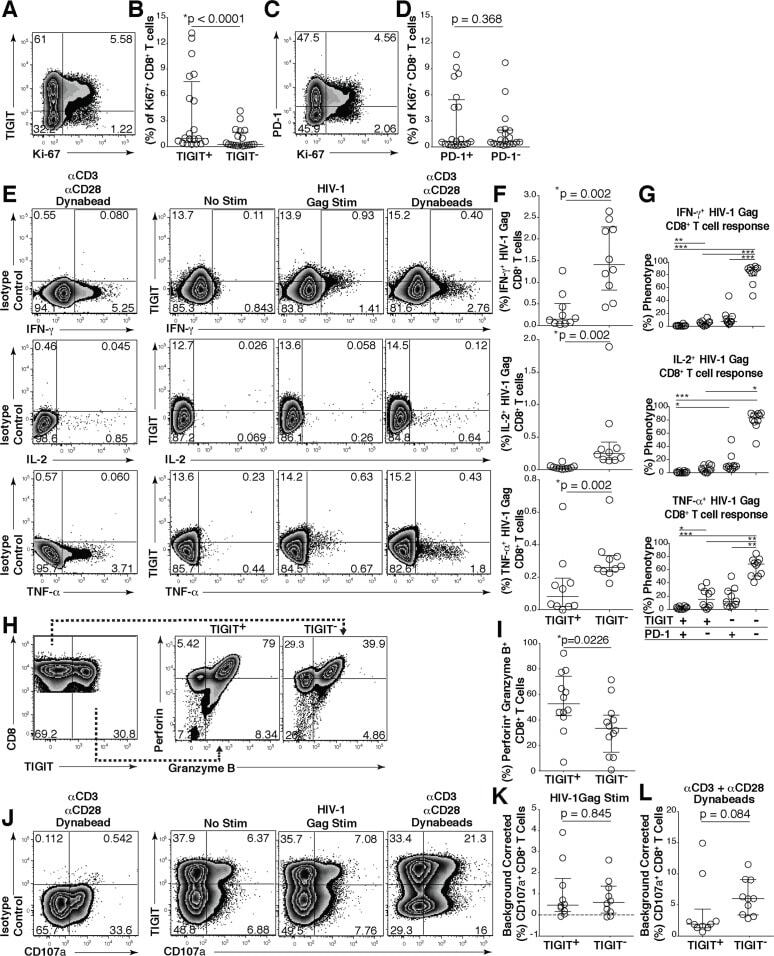
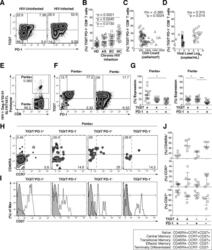
- Fig 4 TIGIT expressing CD8 + T cells have impaired cytokine responses. Representative flow cytometry plots gated on CD8 + T cells showing (A) TIGIT or (C) PD-1 expression against Ki-67 from a chronically HIV-infected individual. Compiled data of Ki-67 + CD8 + T cell frequency (%) separated into (B) TIGIT + and TIGIT - or (D) PD-1 + and PD-1 - ( n = 20). P values were calculated by Wilcoxon matched-pairs signed ranked test. Ex vivo PBMCs from chronically HIV-infected individuals were stimulated with HIV Gag peptide pool and assessed for cytokine production. (E) Representative flow cytometry plots gated on CD8 + T cells showing TIGIT expression and either IFN-gamma, IL-2, or TNF-alpha content after no stimulation, stimulation with an HIV-1 Gag peptide pool, or a positive control stimulation with anti-CD3 + anti-CD28 Dynabeads. (F) Compiled data of IFN-gamma, IL-2, or TNF-alpha CD8 + T cell frequency (%) from TIGIT + or TIGIT - CD8 + T cell compartments after HIV-1 Gag peptide pool stimulation (sample group includes; AS n = 4, EC n = 3, NC n = 3). P values were calculated by Wilcoxon matched-pairs signed ranked test. (G) Compiled data of TIGIT and PD-1 expression on HIV-1 Gag responding cells (sample group includes; AS n = 4, EC n = 3, NC n = 3). P values were calculated with repeated-measures one-way ANOVA, followed by Tukey's multiple comparisons test (*p < 0.05; **p < 0.01; ***p < 0.001). (H) Representative flow cytometry plots of intracellular perforin and granzyme B fr
- Submitted by
- Invitrogen Antibodies (provider)
- Main image

- Experimental details
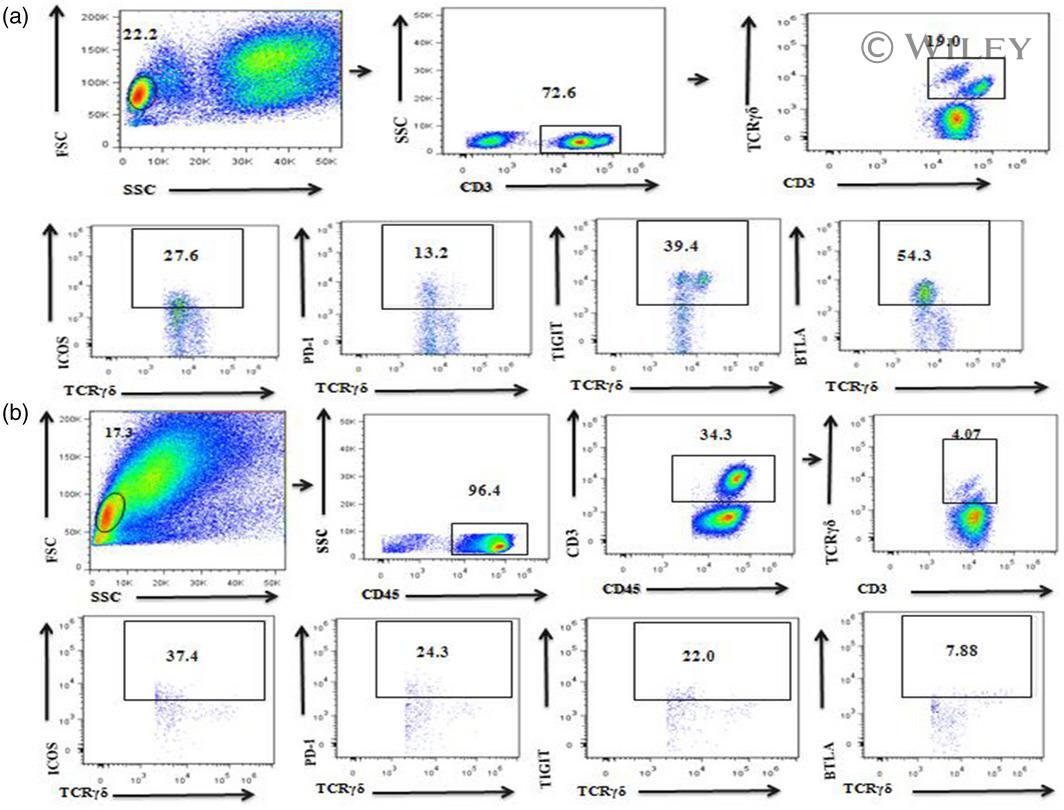
- 2 Fig. The expression of gammadelta T cells and their co-stimulatory molecules T cell immunoglobulin and ITIM domain (TIGIT), programmed cell death 1 (PD-1), B and T lymphocyte attenuator (BTLA) and inducible co-stimulator (ICOS) as measured by flow cytometry and FlowJo software. (a) gammadelta T cell receptor (CD3 + gammadelta TCR + ) gating strategy in peripheral blood. (b) gammadelta T cell (CD45 + CD3 + gammadelta TCR + ) gating strategy in decidual tissue.
- Submitted by
- Invitrogen Antibodies (provider)
- Main image
- Experimental details
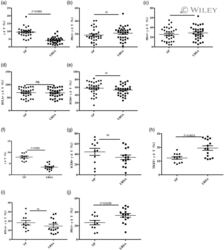
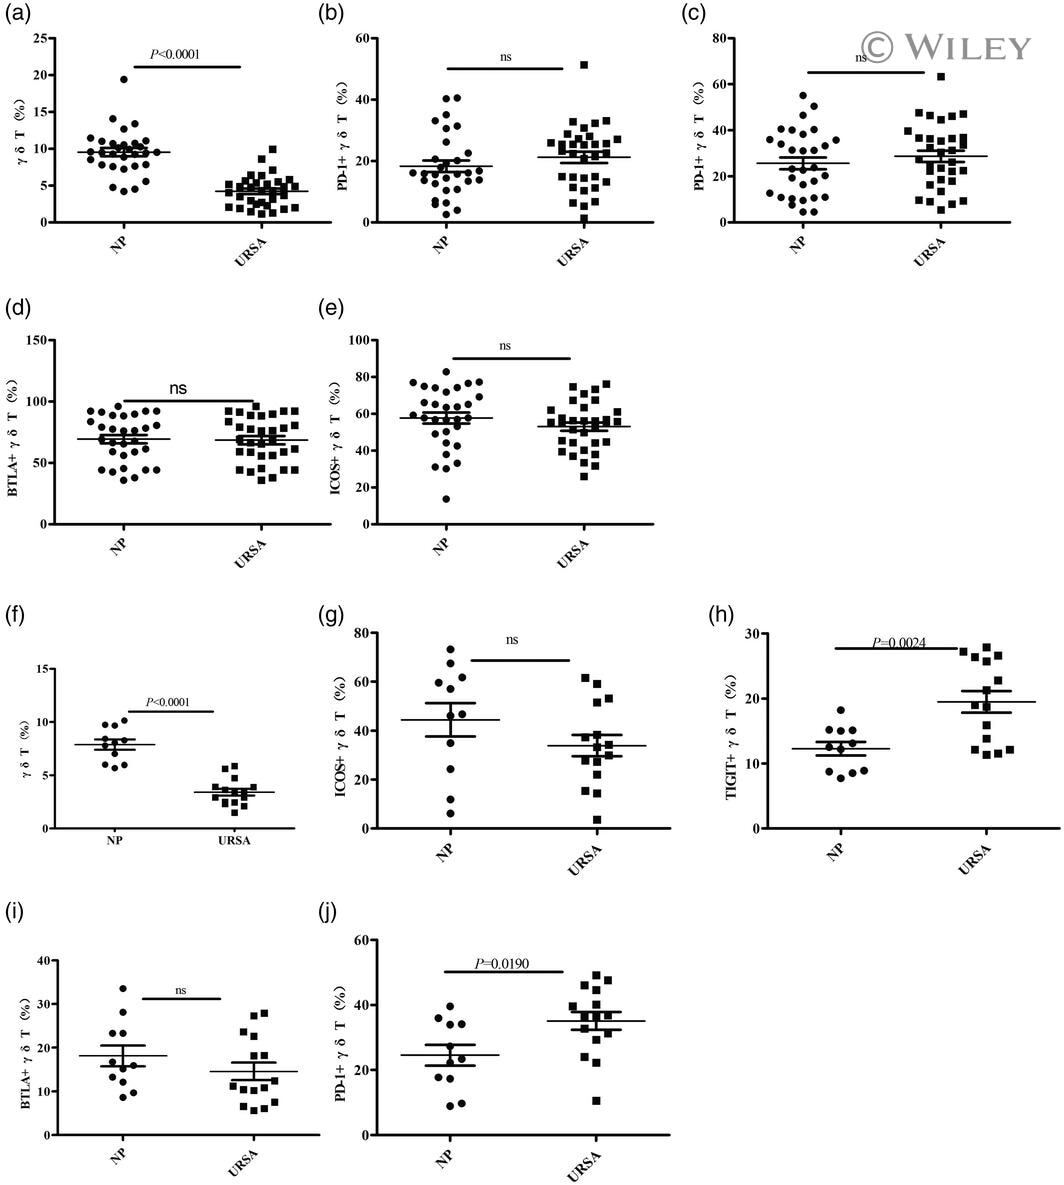
- 3 Fig. The proportion of gammadelta T cells and the expression of their co-stimulatory molecules T cell immunoglobulin and ITIM domain (TIGIT), inducible co-stimulator (ICOS), B and T lymphocyte attenuator (BTLA) and programmed cell death 1 (PD-1) as determined by flow cytometry. The data are expressed as the mean +- standard error of the mean (s.e.m.). (a-e) Peripheral blood; normal pregnant (NP) group, n = 30; unexplained recurrent spontaneous abortion (URSA) group, n = 32; n.s. = not significant. (f-j) Decidual tissue; NP group, n = 11; URSA group, n = 15.
- Submitted by
- Invitrogen Antibodies (provider)
- Main image
- Experimental details
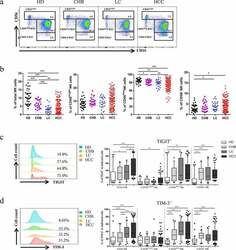
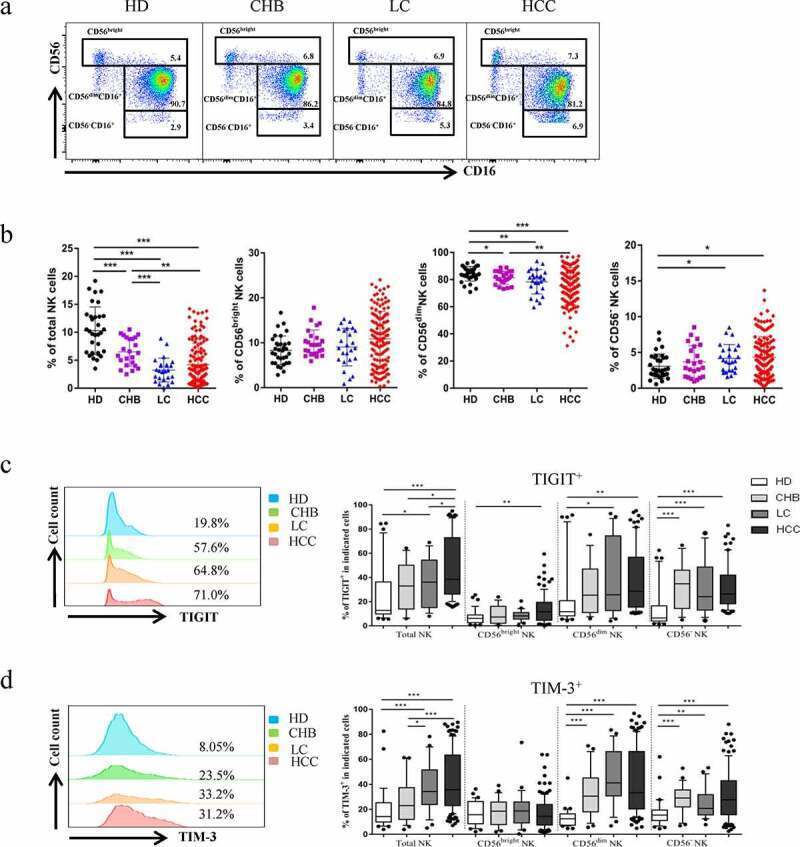
- Figure1. Co-expression of TIGIT and TIM-3 is upregulated on NK cells in HBV-HCC patients. a-b The Proportion of total NK cells and NK cell subsets(CD56 bright NK cells,CD56 dim NK cells, and CD56 - NK cells) from HBV-HCC (n = 133), compared with HDs (n = 32), CHB (n = 23),and HBV-LC patients (n = 25) by flow cytometry analysis. c-d The expression of TIGIT (c) and TIM-3 (d) on total NK cells and NK cell subsets(CD56 bright NK cells,CD56 dim NK cells, and CD56 - NK cells) from HBV-HCC, HDs, CHB and HBV-LC patients. P values were calculated by using the Kruskal-Wallis nonparametric H test. * P < .05, ** P < .01, *** P < .001, **** P < .0001
- Submitted by
- Invitrogen Antibodies (provider)
- Main image
- Experimental details
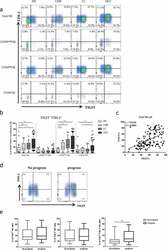
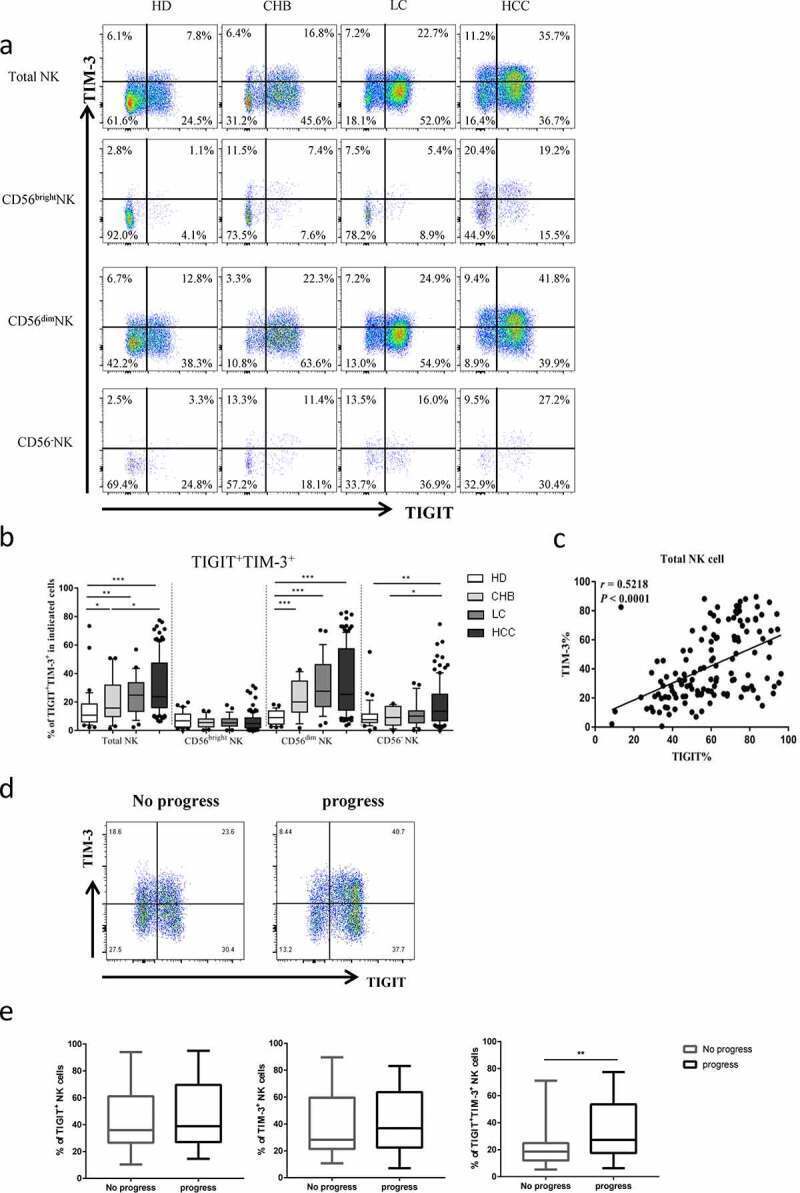
- Figure2. The co-expression of TIGIT and TIM-3 is elevated on NK cells of progression patients with HBV-HCC. a-b Percentages of TIGIT + TIM-3 + NK cells on total NK cells and NK cell subsets(CD56 bright NK cells,CD56 dim NK cells, and CD56 - NK cells) from HBV-HCC, HDs, CHB and HBV-LC patients by flow cytometry analysis. c Correlation analysis of TIGIT and TIM-3 on NK cells from patients with HBV-HCC. d-e Flow-cytometry analyses (d) of TIGIT and TIM-3 were performed on PBMCs collected from HBV-HCC patients. Representative plots (e) display the expression of TIGIT + NK cells, TIM-3 + NK cells and total TIGIT + TIM-3 + NK cells from patients with progression (n = 61) and no progression (n = 72). P values were calculated by using the Kruskal-Wallis nonparametric H test (a-c). P values were obtained by the unpaired t test (d-e). * P < .05, ** P < .01, *** P < .001, **** P < .0001
- Submitted by
- Invitrogen Antibodies (provider)
- Main image
- Experimental details
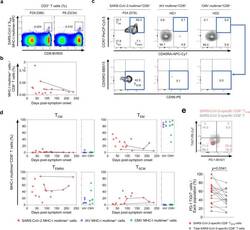
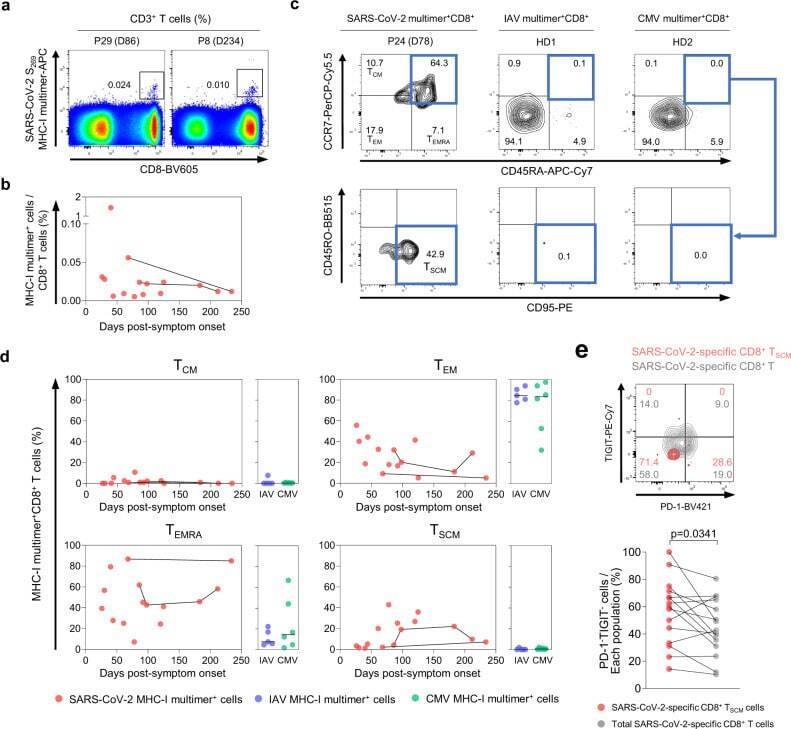
- Fig. 4 Frequency and differentiation status of SARS-CoV-2-specific MHC-I multimer + T cells. PBMC samples ( n = 15) from individuals with SARS-CoV-2 infection ( n = 11) were analyzed by flow cytometry. a Representative flow cytometry plots showing the ex vivo detection of SARS-CoV-2 S 269 multimer + CD8 + T cells in the gate of CD3 + T cells. b Scatter plot showing the relationship between DPSO and the frequency of SARS-CoV-2 S 269 multimer + cells among total CD8 + T cells. Samples from the same patient are connected by solid lines. The expression of CCR7, CD45RA, and CD95 was analyzed in SARS-CoV-2 S 269 multimer + CD8 + T cells. IAV MP 58 multimer + ( n = 5) and CMV pp65 495 multimer + ( n = 6) cells from the PBMCs of healthy donors were also analyzed. Representative flow cytometry plots ( c ) show the proportion of the indicated subsets among multimer + cells, and scatter plots ( d ) show the relationship between DPSO and the proportion of the indicated subsets among SARS-CoV-2 S 269 multimer + cells. Samples from the same patient are connected by solid lines. Summary data showing the proportion of the indicated subsets among IAV multimer + and CMV multimer + cells are also presented ( d ). Horizontal lines represent median. e A representative flow cytometry plot (upper) and summary data (lower) showing the percentage of PD-1 - TIGIT - cells among SARS-CoV-2 S 269 multimer + CD8 + T SCM cells and total SARS-CoV-2 S 269 multimer + CD8 + T cells. Statistical analysis was pe
- Submitted by
- Invitrogen Antibodies (provider)
- Main image
- Experimental details
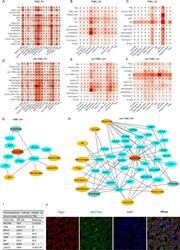
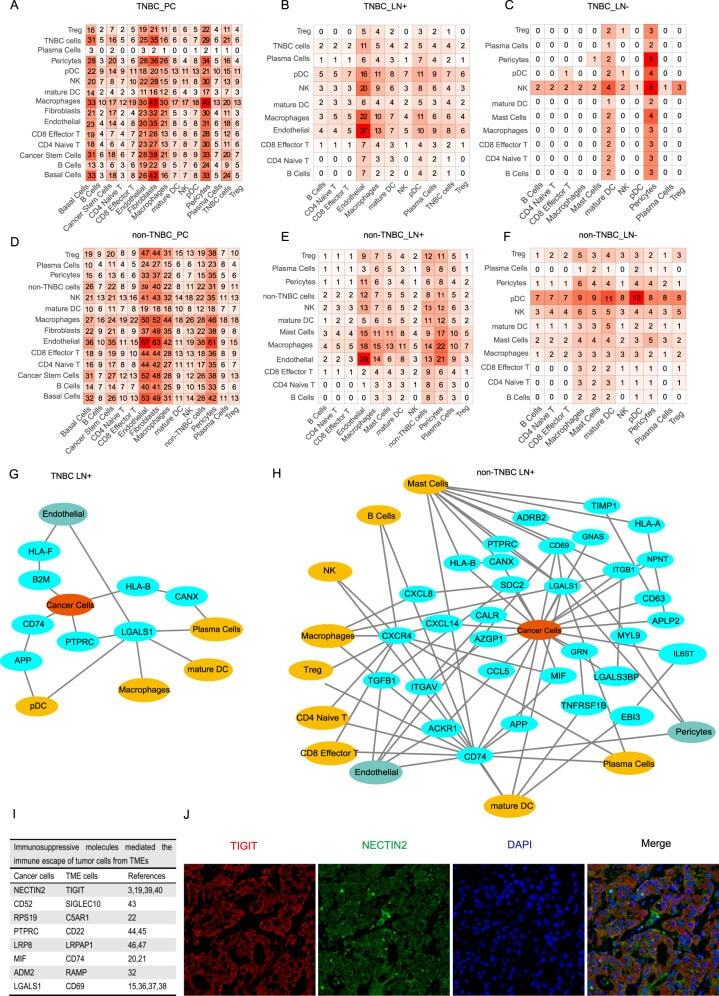
- Fig. 6 Cell-to-cell communications between cancer cells and immune cells. A - F Heatmaps showing numbers of cell-cell interactions across cell types from variant sample origins. G, H NATMI networks showing ligand-receptor pairs among cells in lymph nodes with TNBC ( G ) and non-TNBC ( H ) cells. I Table showing impressive molecules and corresponding ligand-receptor pairs associated with breast cancer metastasis and the respective references. J Immunofluorescence staining of NECTIN2-TIGIT pair in lymph nodes with cancer cells.
- Submitted by
- Invitrogen Antibodies (provider)
- Main image

- Experimental details
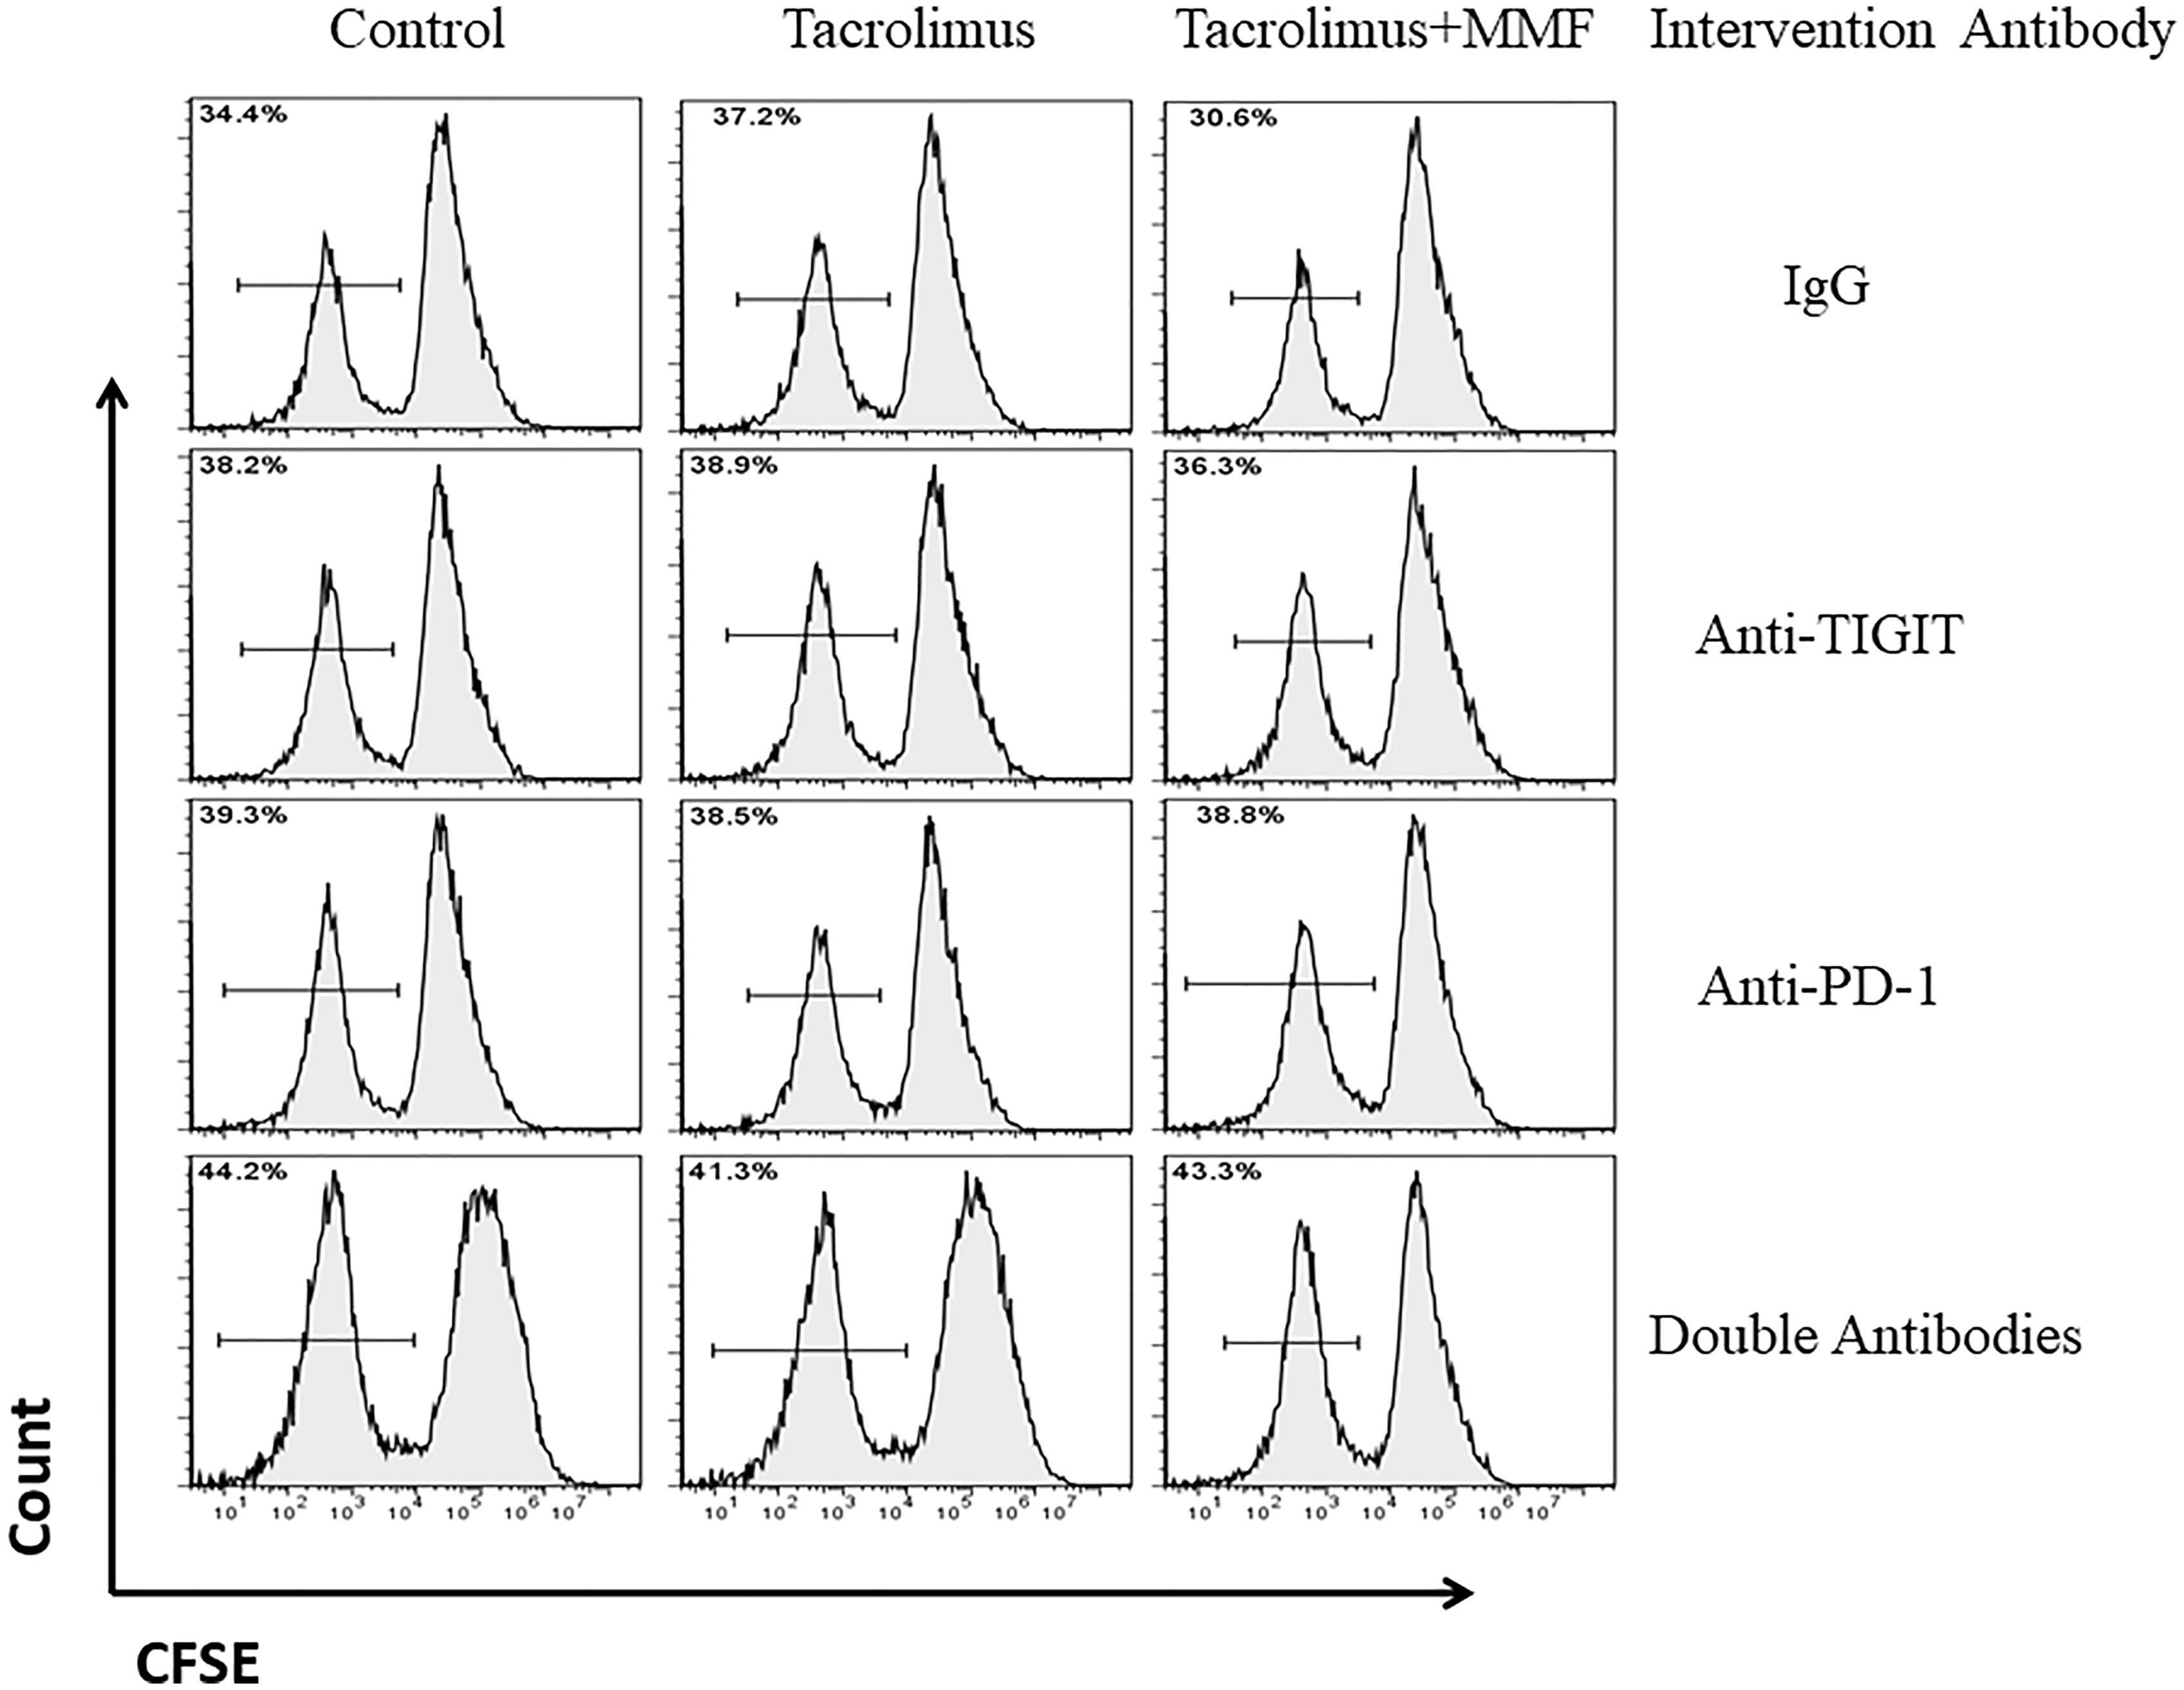
- Figure 3. Representative flow cytometry histograms of the Teffs proliferation rate with the ratio of Tregs to Teffs was 1:1 after addition of double antibodies or anti-PD-1 and anti-TIGIT respectively among the different groups. Treg cells and Teff cells were isolated using magnetic beads and were mixed at the ratio of 1:1. Then, the Teffs proliferation rate was calculated by flow cytometry and analyzed by FlowJo Software.
- Submitted by
- Invitrogen Antibodies (provider)
- Main image
- Experimental details
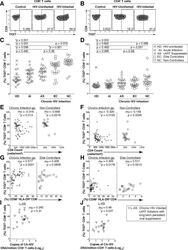
- Fig 1 Expression of TIGIT on T cells during HIV infection. Cryopreserved PBMCs were thawed and surface phenotyped for TIGIT expression. Representative flow cytometry flow plots showing TIGIT expression on (A) CD8 + or (B) CD4 + T cells compared to fluorescence minus one (FMO) control. Graphs show compiled data of TIGIT expression on (C) CD8 + and (D) CD4 + T cells stratified by disease: HIV-uninfected healthy donors (HD, X; n = 20), acute HIV-infection (AI, open diamond; n = 24), aviremic cART suppressed (AS, open triangles; n = 20), aviremic elite controllers (EC, open squares; n = 20), and chronic HIV viremic non-controllers (NC, open circles; n = 20). P values were calculated using one-way ANOVA, followed by Tukey's multiple comparisons test. Graphs show correlation of total chronic infected (+: AS, EC, and NC; left panel, n = 60) and non-controllers (right panel, n = 20) frequency (%) of (E) TIGIT + CD8 + and (F) TIGIT + CD4 + T cells against clinical CD4 Count (cells/mm 3 ). Graphs show correlation of total chronic infected (+: AS, EC, and NC; left panel, n = 60) and elite controllers (right panel, n = 20) frequency (%) of (G) TIGIT + CD8 + and (H) TIGIT + CD4 + T cells against frequency (%) of T cell activation (CD38 + HLA-DR + ). Graphs show correlation of frequency (%) of (I) TIGIT + CD8 + and (J) TIGIT + CD4 + T cell among aviremic HIV infected ""ART initiators"" with known duration of long-term viral suppression from the SCOPE cohort (L-AS, n = 19, open inverte

- Submitted by
- Invitrogen Antibodies (provider)
- Main image

- Experimental details
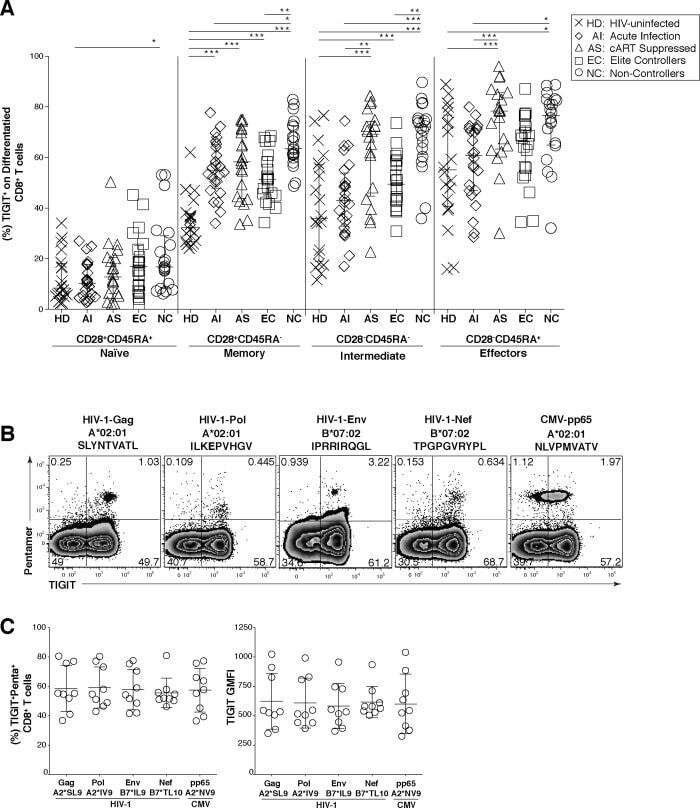
- Fig 2 TIGIT expression on CD8 + terminal effector T cells and HIV-specific CD8 + T cells. Cryopreserved PBMCs were thawed and surface phenotyped for TIGIT expression on CD8 + T cell compartments. (A) Graph shows compiled frequency (%) of TIGIT + CD8 + T cell expression in differentiated compartments stratified by disease status. HIV-uninfected healthy donors (HD, X; n = 20), acute infected (AI, open diamond; n = 24), cART suppressed (AS, open triangle; n = 20), elite controller (EC, open square; n = 20), non-controllers (NC, open circle; n = 20). P values were calculated using one-way ANOVA, followed by Tukey's multiple comparisons test (*p < 0.05; **p < 0.01; ***p < 0.001). PBMCs from HLA-A*02:01 or HLA-B*07:02 HIV chronically infected individuals were stained with matched HLA pentamers presenting HIV-1 and CMV epitopes and anti-TIGIT. (B) Representative flow cytometry plots of pentamer-specific CD8 + T cells using HLA-A*02:01 HIV-1 Gag SLYNTVATL (A2*SL9), HLA-A*02:01 HIV-1 Pol ILKEPVHGV (A2*IV9), HLA-B*07:02 HIV-1 Env IPRRIRQGL (B7*IL9), HLA-B*07:02 HIV-1 Nef TPGPGVRYPL (B7*TL10), and HLA-A*02:01 CMV pp65 NLVPMVATV (A2*NV9) (C) Compiled data of TIGIT expression frequency (%) on pentamer specific CD8 + T cells which was recalculated to 100% (left panel, n = 9) compiled data of TIGIT geometric mean fluorescence intensity (GMFI) on pentamer specific CD8 + T cells (right panel, n = 9).
- Submitted by
- Invitrogen Antibodies (provider)
- Main image
- Experimental details
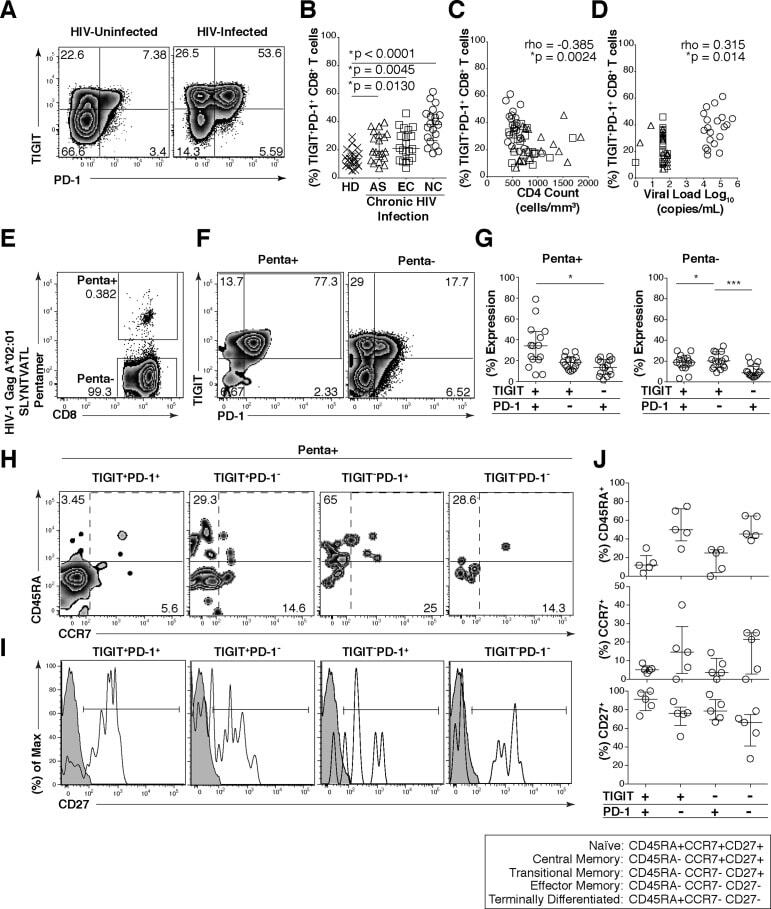
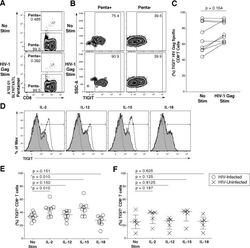
- Fig 3 HIV-Gag specific CD8 + T cells co-express TIGIT and PD-1 and exhibit a transitional memory phenotype. Cryopreserved PBMCs were thawed and surface phenotyped for TIGIT and PD-1 expression on CD8 + T cells. (A) Representative flow cytometry plots showing TIGIT and PD-1 expression on CD8 + T cells from one HIV-uninfected individual (left panel) and one HIV-infected individual (right panel). (B) Graph shows compiled frequency (%) of co-expressing TIGIT + PD-1 + CD8 + T cells from HIV-uninfected (HD, n = 20), chronic HIV-infected (AS, n = 20; EC, n = 20; NC, n = 20). P values were calculated using one-way ANOVA, followed by Tukey's multiple comparisons test. (C) Graph shows correlation of TIGIT + PD-1 + CD8 + T cells frequency (%) from chronic HIV-infected individuals against CD4 count (cells/mm 3 ) or (D) viral load (copies/ml). Spearman's rho tests were performed for correlations. TIGIT and PD-1 expression on HIV-1 Gag specific CD8 + T cells were evaluated. (E) Representative flow cytometry plot of HIV-specific CD8 + T cells using HLA-A*02:01 HIV-1 Gag SLYNTVATL. (F) Representative flow cytometry plots of TIGIT and PD-1 expression on HIV-1 Gag specific CD8 + T cells (Penta+, left panel; Penta-, right panel). (G) Graphs show compiled frequency (%) of TIGIT and PD-1 on Penta+ (left panel) and Penta- (right panel) (sample group contains; AS n = 11, EC n = 2, NC n = 2). P values were calculated using repeated-measures one-way ANOVA, followed by Tukey's multiple
- Submitted by
- Invitrogen Antibodies (provider)
- Main image
- Experimental details
- Fig 5 Common gamma-chain cytokines regulate TIGIT expression on CD8 + T cells. Ex vivo PBMCs from chronically HIV-1 infected individuals were stimulated with HIV-1 Gag peptide pool for 12 hours. (A) Representative flow cytometry plot gated on CD8 + T cells showing HIV-1 Gag pentamer with no stimulation (top panel) or HIV-1 Gag stimulation (bottom panel). (B) Representative flow cytometry plot of TIGIT expression on Penta+ and Penta- cells with no stimulation or HIV-1 Gag stimulation. (C) Graph shows compiled frequency (%) of TIGIT on Penta+ cells with no stimulation and HIV-1 Gag stimulation ( n = 9). P values calculated with Wilcoxon matched-pairs signed-rank test. (D) Representative flow cytometry histograms gated on CD8 + T cells overlaid with TIGIT expression frequency before and after cytokine stimulation. Dashed line indicates TIGIT isotype control, shaded histogram indicates TIGIT expression with no stimulation, and the solid line indicates TIGIT expression with cytokine stimulation after six days. Compiled data of TIGIT frequency (%) on CD8 + T cells (E) HIV-Infected participant (open circle; n = 8) (F) HIV-Uninfected participant (X; n = 5). P values were calculated with repeated-measures one-way ANOVA, followed by Tukey's multiple comparisons test.

- Submitted by
- Invitrogen Antibodies (provider)
- Main image

- Experimental details
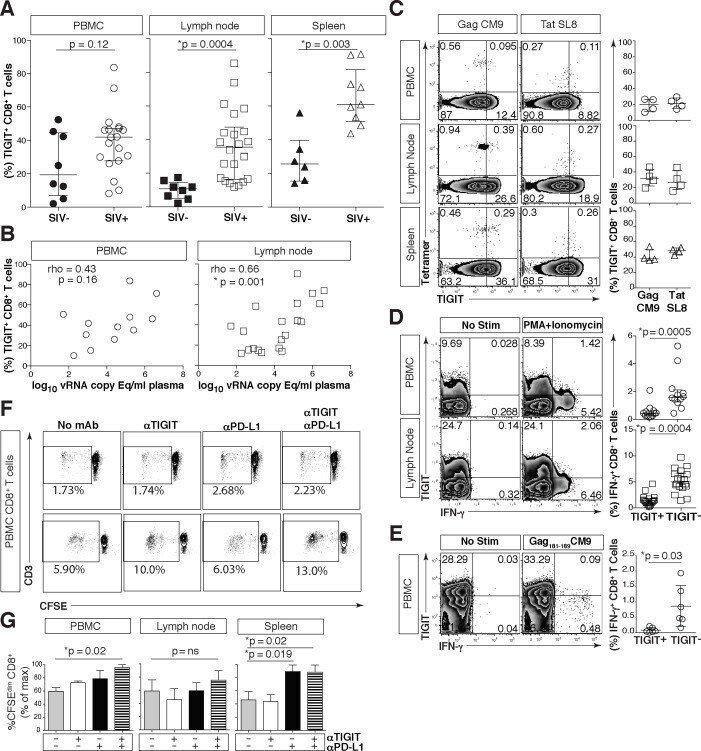
- Fig 7 Phenotypic and functional assessment of rhTIGIT expression on CD8 + T cells. Cryopreserved rhesus macaque PBMCs were thawed, phenotyped and assessed for function. (A) Graphs show frequency (%) of rhTIGIT + CD8 + T cells from PBMCs (circle), LNs (square), and spleen (triangle) in SIV-uninfected (filled) and SIV-infected (open) animals (SIV-uninfected PBMCs, n = 8; SIV-infected PBMCs, n = 19; SIV-uninfected LNs, n = 8; SIV-infected LNs, n = 22; SIV-uninfected spleen, n = 6; SIV infected spleen, n = 9). P values were calculated with Mann-Whitney U tests. (B) Graphs show correlation of frequency (%) of rhTIGIT + CD8 + T cells in PBMCs (circle) and lymph nodes (square) from SIV-infected animal against plasma SIV viral load log 10 vRNA copy Eq/ml (PBMCs, n = 12; LNs, n = 20). vRNA copy Eq, viral RNA copy equivalents. Spearman''s rho tests were performed for correlations. (C) Representative flow cytometry plots of tetramer stains for Mamu-A*01 restricted SIV-Gag CM9 and SIV-Tat SL8 specific CD8 + T cells from PBMC, LNs, and spleen, in a representative Mamu-A*01 animal with full cART suppression. Compiled data of rhTIGIT expression frequency (%) on tetramer specific CD8 + T cells ( n = 4) from PBMCs (circle), LNs (square), and spleen (triangle) from Mamu-A*01 + macaques with full cART suppression. (D) Representative flow cytometry plots of PBMCs ( n = 12) or lymph nodes ( n = 18) stimulated without or with PMA + Ionomycin. Graphs show frequency (%) of IFN-gamma from CD8 + T cel
- Submitted by
- Invitrogen Antibodies (provider)
- Main image
- Experimental details
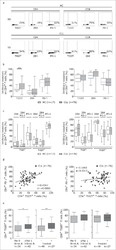
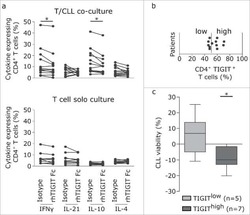
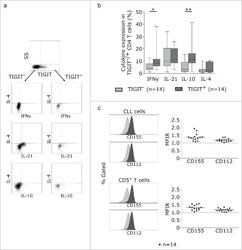
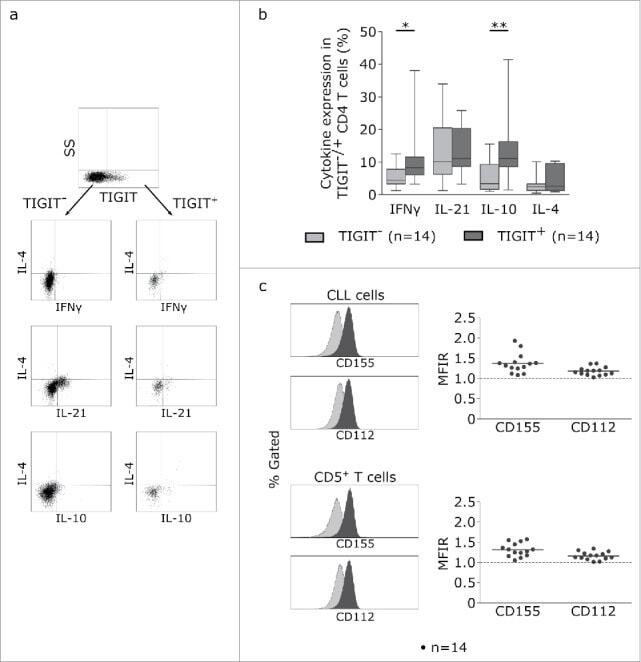
- Figure 5. TIGIT+ cells display a distinct cytokine profile. (a) Representative dot plots showing intracellular cytokine production after cultivating CLL PBMCs for 24 h with CD3/CD28 activating beads. (b) Cytokine production of TIGIT- or TIGIT+CD4+ T cells in 14 samples. (c) Mean fluorescence intensity ratio (MFIR) of CD155 and CD112 on CD5+CD19+ CLL (top) or CD5+ T cells (bottom). The histograms show representative FACS plots of CLL cells (gated for CD5+CD19+cells) and T cells (CD5+ cells) stained with isotype controls (in gray) and CD112/CD155 specific antibodies (in black). The dot plots show results from n = 14 samples.
- Submitted by
- Invitrogen Antibodies (provider)
- Main image

- Experimental details
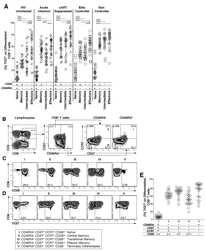
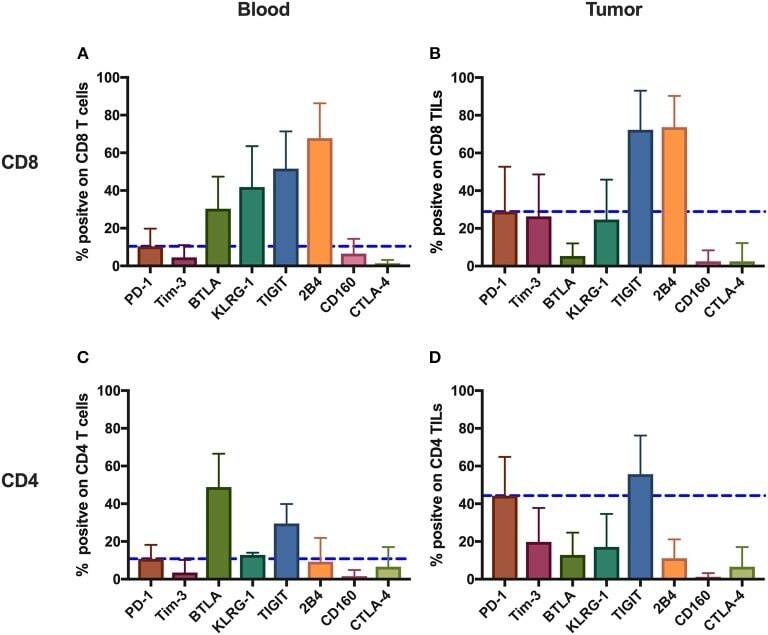
- Figure 1 Inhibitory receptors have distinct frequencies in T-cell populations from peripheral blood and tumor tissues from eight types of cancer patients. FACS analysis reveals the frequency of PD-1+, Tim-3+, BTLA+, TIGIT+, 2B4+, CD160+, and CTLA-4+ cells in peripheral CD8 T cells (A) , CD8 TILs (B) , peripheral CD4 T cells (C) , and CD4 TILs (D) . T cells were obtained from 131 primary cancer patients, including 38 with breast cancer, 10 with liver cancer, 11 with lung cancer, 9 with esophageal cancer, 14 with gastric cancer, 15 with colorectal cancer, 14 with kidney cancer, and 20 with cervical cancer. The blue dotted line is the mean frequency of PD-1+ cells on each graph. The abovementioned IRs were investigated in three different panels (details are shown in Supplementary Table 2 ). 131 cancer patients were used for the analysis of PD-1, Tim-3, KLRG-1, and 2B4; 74 cancer patients were used for the analysis of BTLA and CD160; and 67 cancer patients were investigated for the analysis of TIGIT. Details of the overlapping patients and the number of the patients in each cancer cohort are listed in Supplementary Table 4 . FACS, fluorescence-activated cell sorting; TILs, tumor-infiltrating lymphocytes; PD-1, programmed cell death protein 1; Tim-3, T-cell immunoglobulin and mucin-domain containing-3; KLRG-1, killer cell lectin like receptor G1; 2B4, CD244; BTLA, B- and T-lymphocyte attenuator.
- Submitted by
- Invitrogen Antibodies (provider)
- Main image
- Experimental details
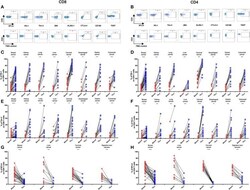
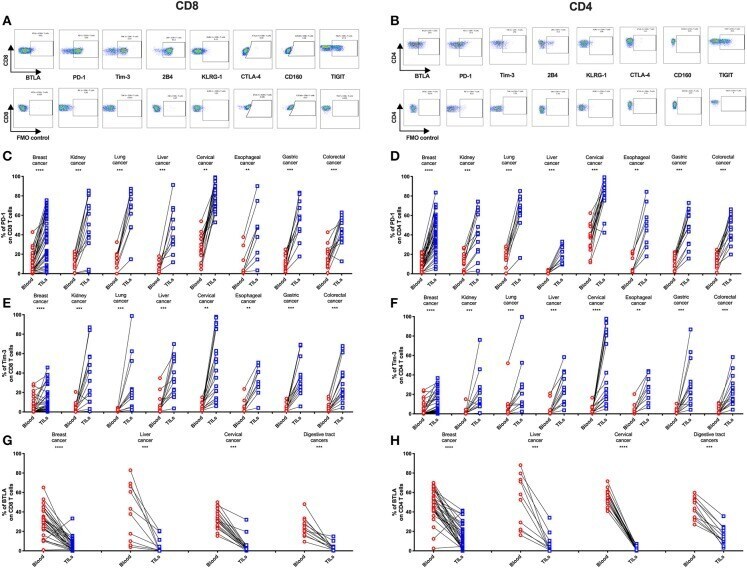
- Figure 2 Higher frequencies of PD-1 and Tim-3 but lower frequencies of BTLA in T cells from tumors compared with peripheral blood in matched patient samples. Representative dot plots of eight inhibitory receptors on CD8 (A) and CD4 (B) TILs with FMO controls are shown. The exemplary plots are combined from two 8-color panels of two breast cancer patients. Full gating strategy of two 8-color panels and the 14-color panel is shown in Supplementary Figures 4 - 8 . FACS analysis of PD-1 (C,D) and Tim-3 (E,F) in CD8 (left) and CD4 (right) T cells was performed for 131 blood-tumor-matched primary cancer patients (see Figure 1 for details). Analysis of BTLA+ cells in CD8 (G) and CD4 (H) T cells was performed for 74 blood-tumor-matched cancer patients: 32 breast cancer, 10 liver cancer, 20 cervical cancer, and 12 digestive tract cancer (five esophageal cancer, four gastric cancer, and three colorectal cancer). Wilcoxon paired t -test was performed to detect the statistical significance ( * P < 0.0332, ** P < 0.0021, *** P < 0.0002, and **** P < 0.0001). The fraction of cells expressing PD-1, Tim-3, or BTLA on the surface of T cells in peripheral blood vs. tumor is shown as %. PD-1, programmed cell death protein 1; Tim-3, T-cell immunoglobulin, and mucin-domain containing-3; BTLA, B-, and T-lymphocyte attenuator; TILs, tumor-infiltrating lymphocytes; FMO, fluorescence minus one; FACS, fluorescence-activated cell sorting.
- Submitted by
- Invitrogen Antibodies (provider)
- Main image
- Experimental details
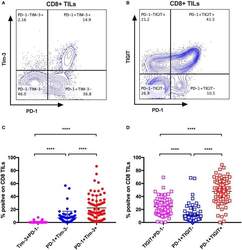
- Figure 4 Tim-3 and TIGIT are preferentially expressed on PD-1+ CD8 TILs across multiple types of cancer. Representative dot plots of the co-expression of PD-1 and Tim-3 on CD8 TILs (A) and the co-expression of PD-1 and TIGIT on CD8 TILs (B) from a breast cancer patient are shown. Data were collected utilizing the 14-color panel as mentioned above, with full gating strategy shown in Supplementary Figure 8 . (C) FACS analysis of the frequencies of Tim-3+PD-1-, PD-1+Tim-3-, and PD-1+Tim-3+ cells among CD8 TILs from 69 cancer patients (see Figure 3 for details). (D) FACS analysis of the frequencies of TIGIT+PD-1-, PD-1+TIGIT-, and PD-1+TIGIT+ cells among CD8 TILs from the same 69 cancer patients. Wilcoxon paired t -test was performed to detect the statistical significance ( * P < 0.0332, ** P < 0.0021, *** P < 0.0002, and **** P < 0.0001). Tim-3, T-cell immunoglobulin and mucin-domain containing-3; TIGIT, T-cell immunoglobulin and ITIM; TILs, tumor-infiltrating lymphocytes; PD-1, programmed cell death protein 1; FACS, fluorescence-activated cell sorting.

- Submitted by
- Invitrogen Antibodies (provider)
- Main image
- Experimental details
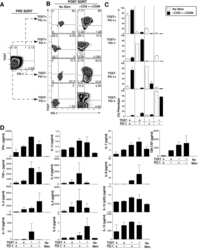
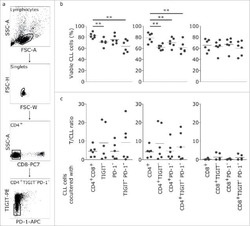
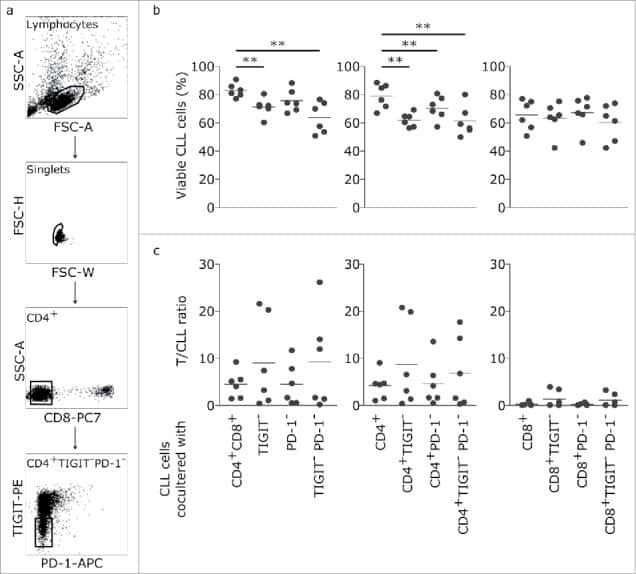
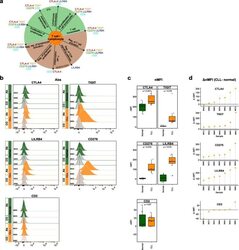
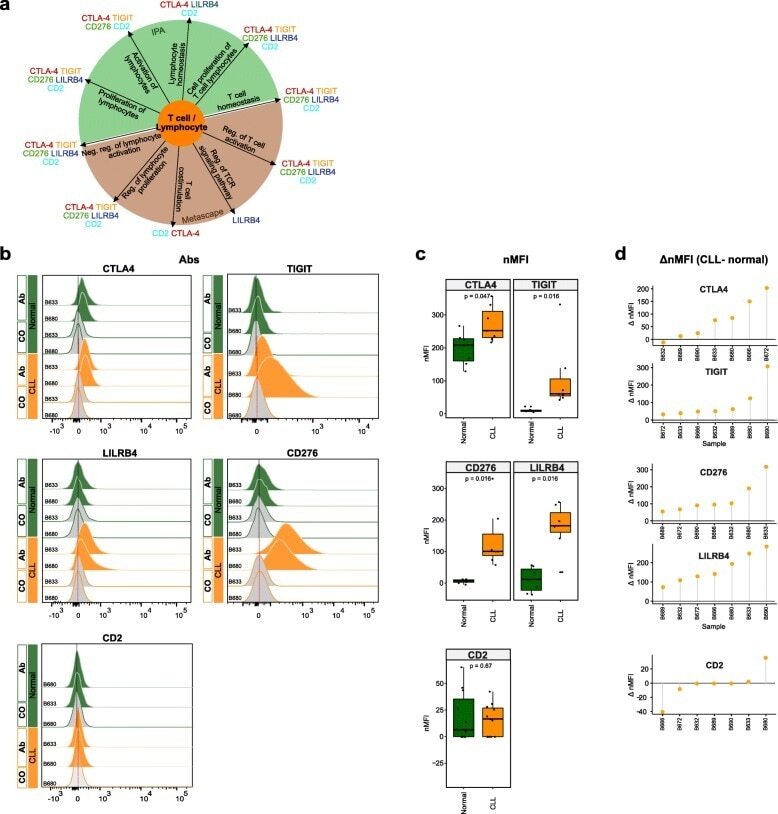
- Fig. 6 Flow cytometry analysis of T cell-/lymphocyte-specific markers on normal and malignant B cells from CLL patients. a Summary scheme representing functional implications of CLL-specific candidate genes selected for flow cytometric analysis. b Flow cytometric analysis of expression of CTLA-4, TIGIT, CD276, LILRB4, and CD2 on peripheral blood B cells of CLL patients. The expression was determined for non-malignant B cells (""Normal""; CD19 + CD5 - B cells, represented in green) and neoplastic B cells (""CLL"", CD19 + CD5 + B cells, represented in orange) detected in the same samples. ""Co,"" no antibody staining control; ""Ab,"" staining with the antibody of interest as indicated. c Normalized median fluorescence intensities (target MFI - MFI of negative control [Co]; nMFI). d Delta normalized median fluorescence intensities between CLL cells and normal B cells (DeltanMFI (CLL-normal)) for each patient tested
- Submitted by
- Invitrogen Antibodies (provider)
- Main image
- Experimental details
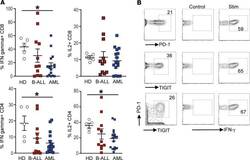
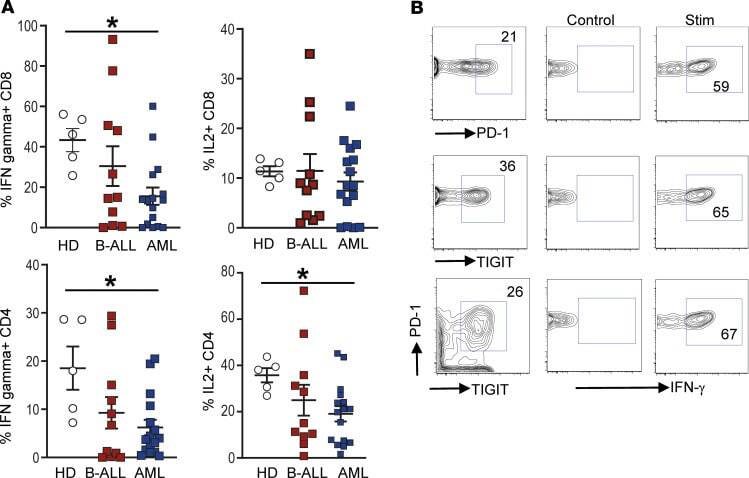
- Figure 2 Changes in BM T cell function in children with B-ALL and AML at diagnosis. BMMNCs from B-ALL ( n = 13), AML ( n = 17), or HD ( n = 5) were cultured alone or with PMA/ionomycin in the presence of GolgiStop. After 4 hours of culture, cells were stained with dead cell exclusion dye as well as antibodies to detect surface CD3, CD4, CD8, PD-1, TIGIT, intracellular IFN-gamma, and IL-2 and analyzed using flow cytometry. ( A ) Proportion of CD8 + and CD4 + T cells secreting IFN-gamma and IL-2. ( B ) IFN-gamma secretion by cells expressing PD-1 and/or TIGIT. Figure shows a representative plot from patient with AML. All graphs show mean +- SEM. * P < 0.05 by Mann-Whitney U test with Bonferroni''s correction for multiple comparisons.
- Submitted by
- Invitrogen Antibodies (provider)
- Main image
- Experimental details
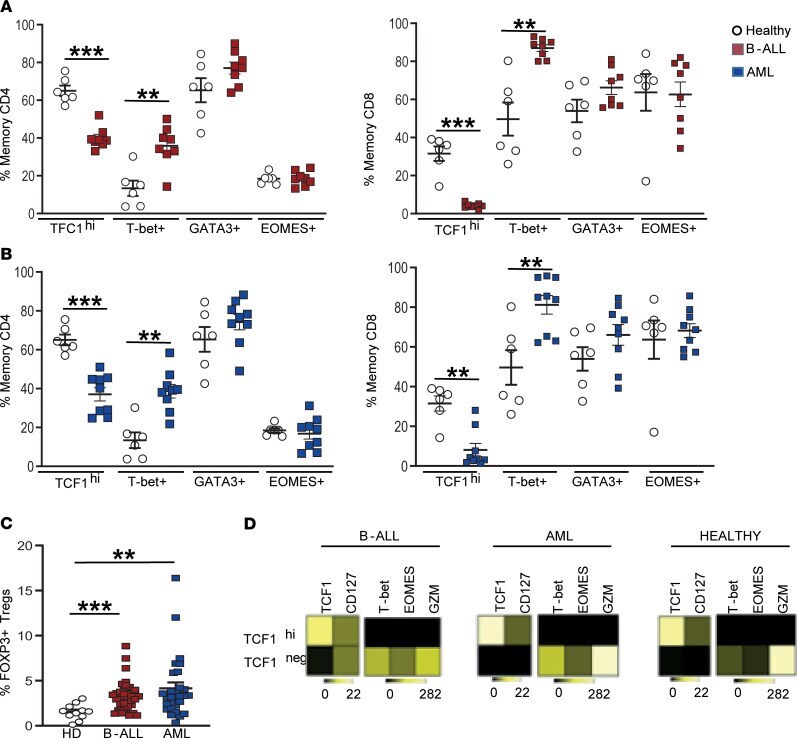
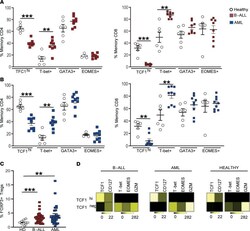
- Figure 3 Changes in BM T cell transcription factors in children with B-ALL and AML at diagnosis. BMMNCs from B-ALL ( n = 13), AML ( n = 17), or HD ( n = 5) were cultured alone or with PMA/ionomycin in the presence of GolgiStop. After 4 hours of culture, cells were stained with dead cell exclusion dye as well as antibodies to detect surface CD3, CD4, CD8, PD-1, TIGIT, intracellular IFN-gamma, and IL-2 and analyzed using flow cytometry. ( A ) Expression of TCF1, T-bet, GATA3, and EOMES transcription factors in memory CD4 + (left) and CD8 + (right) T cells in BMMNCs from HD and patients with B-ALL. ( B ) Expression of TCF1, T-bet, GATA3, and EOMES transcription factors in memory CD4 + (left) and CD8 + (right) T cells in BMMNCs from HD and patients with AML. ( C ) Tregs (CD3 + CD4 + CD25 + CD127 - FOXP3 hi ) as percentage of total T cells in BM from HD ( n = 11) and patients with B-ALL ( n = 36) and AML ( n = 28). ( D ) Heatmaps showing characteristics of the TCF1 hi and TCF1 - CD8 + memory T cells from HD, B-ALL, and AML. All graphs show mean +- SEM. ** P < 0.01, *** P < 0.001 by Mann-Whitney U test with Bonferroni''s correction for multiple comparisons.