Explore
 Validate
 Learn
Learn Western blot
 ELISA
ELISAAntibody data
- Antibody Data
- Antigen structure
- References [0]
- Comments [0]
- Validations
- Western blot [1]
- Immunocytochemistry [1]
- Flow cytometry [2]
Submit
Validation data
Reference
Comment
Report error
- Product number
- DM1230 - Provider product page

- Provider
- OriGene
- Product name
- CEACAM19 mouse monoclonal antibody, clone HY8H10, Purified
- Antibody type
- Monoclonal
- Description
- CEACAM19 mouse monoclonal antibody, clone HY8H10, Purified
- Host
- Mouse
- Conjugate
- Unconjugated
- Epitope
- CEACAM19
- Isotype
- IgG
- Antibody clone number
- HY8H10
- Vial size
- 100 µg
- Concentration
- 1.0 mg/ml
No comments: Submit comment
Supportive validation
- Submitted by
- OriGene (provider)
- Main image

- Experimental details
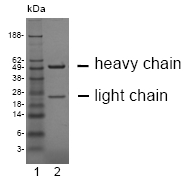
- Figure.4: SDS-PAGE analysis of purified HY-8H10 monoclonal antibody. Lane 1: Molecular weight marker, Lane 2: 2 ug of purified HY-8H10 antibody. Proteins were separated by SDS-PAGE and stained with RAPID StainTM Reagent.
- Validation comment
- WB
Supportive validation
- Submitted by
- OriGene (provider)
- Main image
- Experimental details
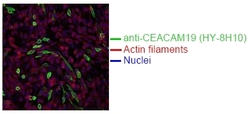
- Figure.2: Spectral Confocal Microscopy of CHO cells using HY-8H10 antibody . CHO cells were transiently transfected with an expression vector encoding CEACAM19. Binding of HY-8H10 was visualized with a FITC-conjugated secondary antibody (green). Actin filaments are labeled with Alexa Fluor-555 Phalloidin (red). Cell nuclei are stained with DAPI (blue).
- Validation comment
- IF

Supportive validation
- Submitted by
- OriGene (provider)
- Main image
- Experimental details
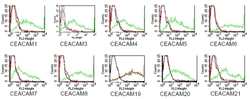
- Figure.3: BOSC23 cells were transiently transfected with expression vectors containing either the cDNA of CEACAM1, CEACAM3-8 or CEACAM19-21. Expression of the constructs was tested with monoclonal antibodies known to recognize the corresponding proteins (CEACAM1,3,4,5 and 6: D14HD11; CEACAM7: BAC2; CEACAM8:Tet2; green curves). An irrelevant monoclonal antibody served as a negative control (black curves). For specificity testing, protein G-purified HY-8H10 was tested on all CEACAM transfectants. A positive signal was obtained only with CEACAM19 transfected cells (red curve).
- Validation comment
- FC

- Submitted by
- OriGene (provider)
- Main image

- Experimental details
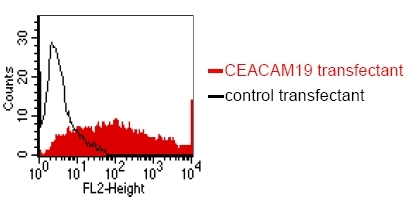
- Figure.1: FACS analysis of BOSC23 cells using HY-8H10 antibody . BOSC23 cells were transiently transfected with an expression vector encoding either CEACAM19 (Red curve) or an irrelevant protein (control transfectant). Binding of HY-8H10 was detected with a PE conjugated secondary antibody. A positive signal was obtained only with CEACAM19 transfected cells.
- Validation comment
- FC