 Explore
 Validate
 Learn
Learn Western blot
 Immunocytochemistry
Antibody data
- Antibody Data
- Antigen structure
- References [18]
- Comments [0]
- Validations
- Immunocytochemistry [8]
- Immunoprecipitation [1]
- Immunohistochemistry [6]
- Flow cytometry [2]
- Other assay [12]
Submit
Validation data
Reference
Comment
Report error
- Product number
- MA1-118 - Provider product page

- Provider
- Invitrogen Antibodies
- Product name
- beta-3 Tubulin Monoclonal Antibody (2G10)
- Antibody type
- Monoclonal
- Antigen
- Synthetic peptide
- Description
- MA1-118 was successfully used to detect E18 Sparague Dawley primary cortical neurons. MA1-118 can be used for immunofluorescence analysis of beta III tubulin in the ectoderm derived from human embryonic stem cells. Western blot analysis of MA1-118 detects an ~50 kDa protein in neuronal-type cells. In bovine, a unknown band at ~32 kDa is also detected. MA1-118 shows specificity to beta-3 Tubulin and is non-reactive to lysates from non-neuronal cell types (e.g. HeLa cell lysate).
- Reactivity
- Human, Mouse, Rat, Bovine, Guinea Pig, Hamster, Porcine, Rabbit
- Host
- Mouse
- Isotype
- IgG
- Antibody clone number
- 2G10
- Vial size
- 100 μg
- Concentration
- 1 mg/mL
- Storage
- -20°C
Submitted references Deposition chamber technology as building blocks for a standardized brain-on-chip framework.
Modulation of Amyloid β-Induced Microglia Activation and Neuronal Cell Death by Curcumin and Analogues.
Inhibition of TGF-β repairs spinal cord injury by attenuating EphrinB2 expressing through inducing miR-484 from fibroblast.
Neuron and astrocyte aggregation and sorting in three-dimensional neuronal constructs.
COVID-19-related anosmia is associated with viral persistence and inflammation in human olfactory epithelium and brain infection in hamsters.
P-Glycoprotein Inhibition Exacerbates Paclitaxel Neurotoxicity in Neurons and Patients With Cancer.
TFAP2C facilitates somatic cell reprogramming by inhibiting c-Myc-dependent apoptosis and promoting mesenchymal-to-epithelial transition.
Modeling medulloblastoma in vivo and with human cerebellar organoids.
Zika Virus Targets Glioblastoma Stem Cells through a SOX2-Integrin α(v)β(5) Axis.
Induced Pluripotent Stem Cell Derivation and Ex Vivo Gene Correction Using a Mucopolysaccharidosis Type 1 Disease Mouse Model.
Altered Gut Microbiome in Parkinson's Disease and the Influence of Lipopolysaccharide in a Human α-Synuclein Over-Expressing Mouse Model.
Investigating Nrg1 Signaling in the Regenerating Axolotl Spinal Cord Using Multiplexed FISH.
Enhancement of BDNF Expression and Memory by HDAC Inhibition Requires BET Bromodomain Reader Proteins.
Growth Cone Tctp Is Dynamically Regulated by Guidance Cues.
Mesenchymal Stem Cells (MSCs) Coculture Protects [Ca(2+)](i) Orchestrated Oxidant Mediated Damage in Differentiated Neurons In Vitro.
Tubulin Beta-3 Chain as a New Candidate Protein Biomarker of Human Skin Aging: A Preliminary Study.
Mycolactone displays anti-inflammatory effects on the nervous system.
Sustained Subconjunctival Delivery of Infliximab Protects the Cornea and Retina Following Alkali Burn to the Eye.
Maisonneuve BGC, Libralesso L, Miny L, Batut A, Rontard J, Gleyzes M, Boudra B, Viera J, Debis D, Larramendy F, Jost V, Honegger T
Microsystems & nanoengineering 2022;8:86
Microsystems & nanoengineering 2022;8:86
Modulation of Amyloid β-Induced Microglia Activation and Neuronal Cell Death by Curcumin and Analogues.
De Lorenzi E, Franceschini D, Contardi C, Di Martino RMC, Seghetti F, Serra M, Bisceglia F, Pagetta A, Zusso M, Belluti F
International journal of molecular sciences 2022 Apr 15;23(8)
International journal of molecular sciences 2022 Apr 15;23(8)
Inhibition of TGF-β repairs spinal cord injury by attenuating EphrinB2 expressing through inducing miR-484 from fibroblast.
Pan D, Yang F, Zhu S, Li Y, Ning G, Feng S
Cell death discovery 2021 Oct 28;7(1):319
Cell death discovery 2021 Oct 28;7(1):319
Neuron and astrocyte aggregation and sorting in three-dimensional neuronal constructs.
Hasan MF, Berdichevsky Y
Communications biology 2021 May 17;4(1):587
Communications biology 2021 May 17;4(1):587
COVID-19-related anosmia is associated with viral persistence and inflammation in human olfactory epithelium and brain infection in hamsters.
de Melo GD, Lazarini F, Levallois S, Hautefort C, Michel V, Larrous F, Verillaud B, Aparicio C, Wagner S, Gheusi G, Kergoat L, Kornobis E, Donati F, Cokelaer T, Hervochon R, Madec Y, Roze E, Salmon D, Bourhy H, Lecuit M, Lledo PM
Science translational medicine 2021 Jun 2;13(596)
Science translational medicine 2021 Jun 2;13(596)
P-Glycoprotein Inhibition Exacerbates Paclitaxel Neurotoxicity in Neurons and Patients With Cancer.
Stage TB, Mortensen C, Khalaf S, Steffensen V, Hammer HS, Xiong C, Nielsen F, Poetz O, Svenningsen ÅF, Rodriguez-Antona C, Kroetz DL
Clinical pharmacology and therapeutics 2020 Sep;108(3):671-680
Clinical pharmacology and therapeutics 2020 Sep;108(3):671-680
TFAP2C facilitates somatic cell reprogramming by inhibiting c-Myc-dependent apoptosis and promoting mesenchymal-to-epithelial transition.
Wang Y, Chen S, Jiang Q, Deng J, Cheng F, Lin Y, Cheng L, Ye Y, Chen X, Yao Y, Zhang X, Shi G, Dai L, Su X, Peng Y, Deng H
Cell death & disease 2020 Jun 25;11(6):482
Cell death & disease 2020 Jun 25;11(6):482
Modeling medulloblastoma in vivo and with human cerebellar organoids.
Ballabio C, Anderle M, Gianesello M, Lago C, Miele E, Cardano M, Aiello G, Piazza S, Caron D, Gianno F, Ciolfi A, Pedace L, Mastronuzzi A, Tartaglia M, Locatelli F, Ferretti E, Giangaspero F, Tiberi L
Nature communications 2020 Jan 29;11(1):583
Nature communications 2020 Jan 29;11(1):583
Zika Virus Targets Glioblastoma Stem Cells through a SOX2-Integrin α(v)β(5) Axis.
Zhu Z, Mesci P, Bernatchez JA, Gimple RC, Wang X, Schafer ST, Wettersten HI, Beck S, Clark AE, Wu Q, Prager BC, Kim LJY, Dhanwani R, Sharma S, Garancher A, Weis SM, Mack SC, Negraes PD, Trujillo CA, Penalva LO, Feng J, Lan Z, Zhang R, Wessel AW, Dhawan S, Diamond MS, Chen CC, Wechsler-Reya RJ, Gage FH, Hu H, Siqueira-Neto JL, Muotri AR, Cheresh DA, Rich JN
Cell stem cell 2020 Feb 6;26(2):187-204.e10
Cell stem cell 2020 Feb 6;26(2):187-204.e10
Induced Pluripotent Stem Cell Derivation and Ex Vivo Gene Correction Using a Mucopolysaccharidosis Type 1 Disease Mouse Model.
Miki T, Vazquez L, Yanuaria L, Lopez O, Garcia IM, Ohashi K, Rodriguez NS
Stem cells international 2019;2019:6978303
Stem cells international 2019;2019:6978303
Altered Gut Microbiome in Parkinson's Disease and the Influence of Lipopolysaccharide in a Human α-Synuclein Over-Expressing Mouse Model.
Gorecki AM, Preskey L, Bakeberg MC, Kenna JE, Gildenhuys C, MacDougall G, Dunlop SA, Mastaglia FL, Akkari PA, Koengten F, Anderton RS
Frontiers in neuroscience 2019;13:839
Frontiers in neuroscience 2019;13:839
Investigating Nrg1 Signaling in the Regenerating Axolotl Spinal Cord Using Multiplexed FISH.
Freitas PD, Lovely AM, Monaghan JR
Developmental neurobiology 2019 May;79(5):453-467
Developmental neurobiology 2019 May;79(5):453-467
Enhancement of BDNF Expression and Memory by HDAC Inhibition Requires BET Bromodomain Reader Proteins.
Sartor GC, Malvezzi AM, Kumar A, Andrade NS, Wiedner HJ, Vilca SJ, Janczura KJ, Bagheri A, Al-Ali H, Powell SK, Brown PT, Volmar CH, Foster TC, Zeier Z, Wahlestedt C
The Journal of neuroscience : the official journal of the Society for Neuroscience 2019 Jan 23;39(4):612-626
The Journal of neuroscience : the official journal of the Society for Neuroscience 2019 Jan 23;39(4):612-626
Growth Cone Tctp Is Dynamically Regulated by Guidance Cues.
Gouveia Roque C, Holt CE
Frontiers in molecular neuroscience 2018;11:399
Frontiers in molecular neuroscience 2018;11:399
Mesenchymal Stem Cells (MSCs) Coculture Protects [Ca(2+)](i) Orchestrated Oxidant Mediated Damage in Differentiated Neurons In Vitro.
Alhazzani A, Rajagopalan P, Albarqi Z, Devaraj A, Mohamed MH, Al-Hakami A, Chandramoorthy HC
Cells 2018 Dec 6;7(12)
Cells 2018 Dec 6;7(12)
Tubulin Beta-3 Chain as a New Candidate Protein Biomarker of Human Skin Aging: A Preliminary Study.
Lehmann SG, Bourgoin-Voillard S, Seve M, Rachidi W
Oxidative medicine and cellular longevity 2017;2017:5140360
Oxidative medicine and cellular longevity 2017;2017:5140360
Mycolactone displays anti-inflammatory effects on the nervous system.
Isaac C, Mauborgne A, Grimaldi A, Ade K, Pohl M, Limatola C, Boucher Y, Demangel C, Guenin-Macé L
PLoS neglected tropical diseases 2017 Nov;11(11):e0006058
PLoS neglected tropical diseases 2017 Nov;11(11):e0006058
Sustained Subconjunctival Delivery of Infliximab Protects the Cornea and Retina Following Alkali Burn to the Eye.
Zhou C, Robert MC, Kapoulea V, Lei F, Stagner AM, Jakobiec FA, Dohlman CH, Paschalis EI
Investigative ophthalmology & visual science 2017 Jan 1;58(1):96-105
Investigative ophthalmology & visual science 2017 Jan 1;58(1):96-105
No comments: Submit comment
Supportive validation
- Submitted by
- Invitrogen Antibodies (provider)
- Main image
- Experimental details
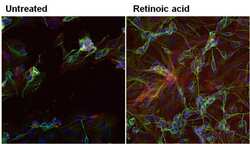
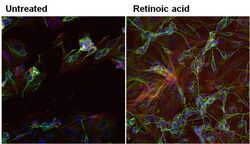
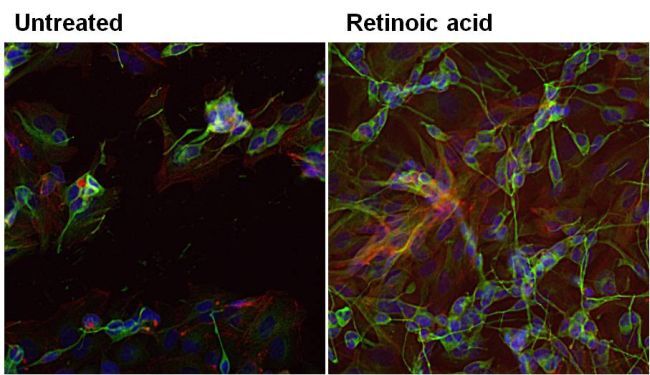
- Immunofluorescent analysis of beta-3 Tubulin in SHSY5Y cells (human neuroblast) either left untreated (left panel) or treated with 10uM retinoic acid (right panel) for 72 hours. Formalin-fixed cells were permeabilized with 0.1% Triton X-100 in TBS for 10 minutes at room temperature. Cells were blocked with 1% Blocker BSA (Product # 37525) for 15 minutes at room temperature. Cells were probed without (left panel) or with (right panel) a beta-3 Tubulin monoclonal antibody (Product # MA1-118) at a dilution of 1:100 for at least 1 hour at room temperature, washed with PBS, and incubated with a DyLight 488-conjugated goat anti-mouse IgG secondary antibody (Product # 35502). F-Actin (red) was stained with DyLight-554 Phalloidin (Product # 21834) and nuclei (blue) were stained with Hoechst 33342 dye (Product # 62249). Images were taken on a Thermo Scientific ToxInsight at 20X magnification.
- Submitted by
- Invitrogen Antibodies (provider)
- Main image
- Experimental details
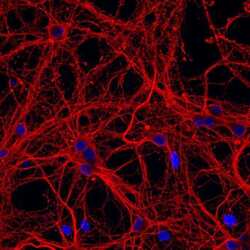
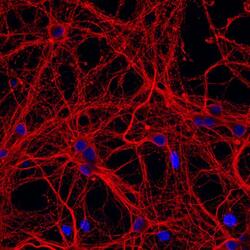
- Immunofluorescent analysis of β-III tubulin in E18 Sparague Dawley primary cortical neuronal cells. The cells were fixed with 4% formaldehyde for 15 mins, permeabilized with 0.25% Triton X-100 in PBS for 10 mins, and blocked with 3% BSA in PBS for 30 mins at RT. Cells were stained with a β-III tubulin mouse monoclonal antibody (Product # MA1-118) at a dilution of 1:200 in 3% BSA in PBS for 1 hr at RT, and then incubated with Invitrogen™ AlexaFluor™ 555 Plus goat anti-mouse IgG secondary antibody (Product # A32727) at a dilution of 1:1000 for 1 hr at RT. Nuclei were stained with Hoechst 33342 (product # H3570). The image contains overlay of neuronal tubulin (orange) and nuclei (blue). Images were taken on a Zeiss LSM 710 confocal microscope at 40X magnification.
- Submitted by
- Invitrogen Antibodies (provider)
- Main image
- Experimental details
- Immunofluorescence analysis of beta III tubulin (green) in the ectoderm derived from human ES cells. Embryoid bodies (EBs) were generated from the H9 embryonic stem cell line (WiCell Research Institute, WA09) using Gibco® KnockOut Serum Replacement. After four days in suspension culture, EBs were plated on Geltrex-coated tissue culture-treated polystyrene and continuously cultured for 21 days. EB cultures were then fixed and permeabilized according to the 3-Germ Layer Immunocytochemistry Kit (Product # A25538) and stained with anti-beta III-tubulin monoclonal antibody (Product # MA1-118, 1:200 dilution, 5 uL/mL final) at 4°C overnight. Secondary staining was completed using Alexa Fluor 488-conjugated anti-mouse IgG (Product # A-11001) and DAPI (Product # D1306) for nuclear DNA (blue) for 1 h at room temperature. Images were taken on EVOS® FL Auto Imaging System at 10X magnification.

- Submitted by
- Invitrogen Antibodies (provider)
- Main image
- Experimental details
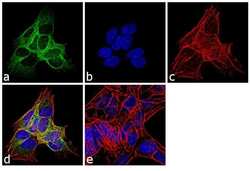
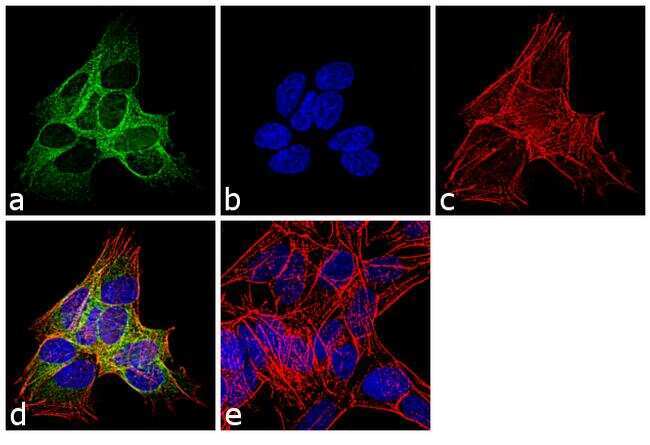
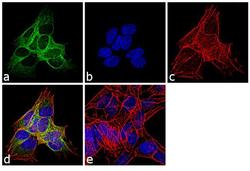
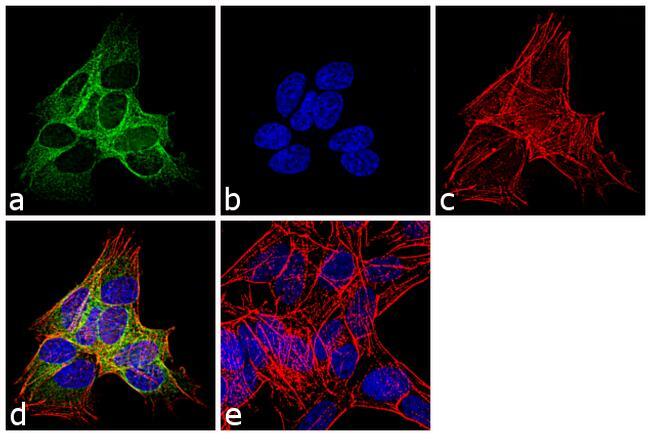
- Immunofluorescence analysis of beta-3 Tubulin was performed using 70% confluent log phase SH-SY5Y cells. The cells were fixed with 4% paraformaldehyde for 10 minutes, permeabilized with 0.1% Triton™ X-100 for 10 minutes, and blocked with 1% BSA for 1 hour at room temperature. The cells were labeled with beta-3 Tubulin (2G10) Mouse Monoclonal Antibody (Product # MA1-118X) at 2µg/mL in 0.1% BSA and incubated for 3 hours at room temperature and then labeled with Goat anti-Mouse IgG (H+L) Superclonal™ Secondary Antibody, Alexa Fluor® 488 conjugate (Product # A28175) at a dilution of 1:2000 for 45 minutes at room temperature (Panel a: green). Nuclei (Panel b: blue) were stained with SlowFade® Gold Antifade Mountant with DAPI (Product # S36938). F-actin (Panel c: red) was stained with Rhodamine Phalloidin (Product # R415, 1:300). Panel d represents the merged image showing cytoplasmic localization. Panel e shows the no primary antibody control. The images were captured at 60X magnification.
- Submitted by
- Invitrogen Antibodies (provider)
- Main image
- Experimental details
- Immunofluorescence analysis of beta III tubulin (green) in the ectoderm derived from human ES cells. Embryoid bodies (EBs) were generated from the H9 embryonic stem cell line (WiCell Research Institute, WA09) using Gibco® KnockOut Serum Replacement. After four days in suspension culture, EBs were plated on Geltrex-coated tissue culture-treated polystyrene and continuously cultured for 21 days. EB cultures were then fixed and permeabilized according to the 3-Germ Layer Immunocytochemistry Kit (Product # A25538) and stained with anti-beta III-tubulin monoclonal antibody (Product # MA1-118, 1:200 dilution, 5 uL/mL final) at 4°C overnight. Secondary staining was completed using Alexa Fluor 488-conjugated anti-mouse IgG (Product # A-11001) and DAPI (Product # D1306) for nuclear DNA (blue) for 1 h at room temperature. Images were taken on EVOS® FL Auto Imaging System at 10X magnification.

- Submitted by
- Invitrogen Antibodies (provider)
- Main image
- Experimental details
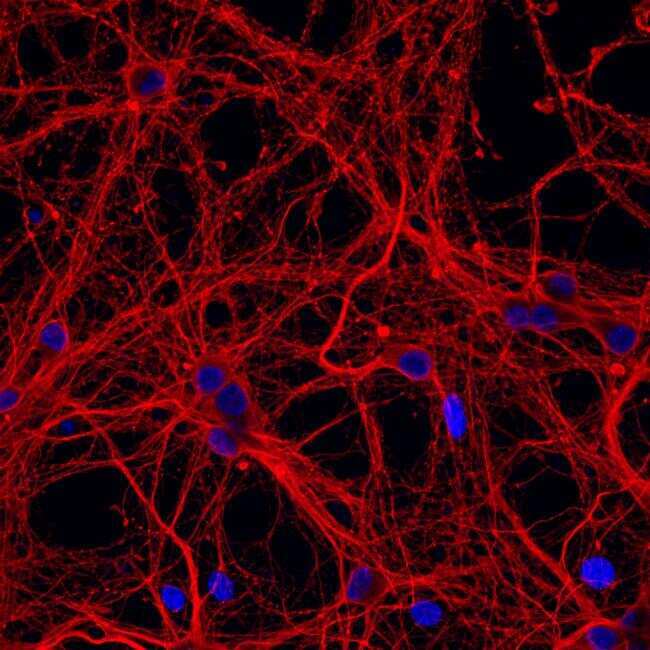
- Immunofluorescent analysis of β-III tubulin in E18 Sparague Dawley primary cortical neuronal cells. The cells were fixed with 4% formaldehyde for 15 mins, permeabilized with 0.25% Triton X-100 in PBS for 10 mins, and blocked with 3% BSA in PBS for 30 mins at RT. Cells were stained with a β-III tubulin mouse monoclonal antibody (Product # MA1-118) at a dilution of 1:200 in 3% BSA in PBS for 1 hr at RT, and then incubated with Invitrogen™ AlexaFluor™ 555 Plus goat anti-mouse IgG secondary antibody (Product # A32727) at a dilution of 1:1000 for 1 hr at RT. Nuclei were stained with Hoechst 33342 (product # H3570). The image contains overlay of neuronal tubulin (orange) and nuclei (blue). Images were taken on a Zeiss LSM 710 confocal microscope at 40X magnification.

- Submitted by
- Invitrogen Antibodies (provider)
- Main image
- Experimental details
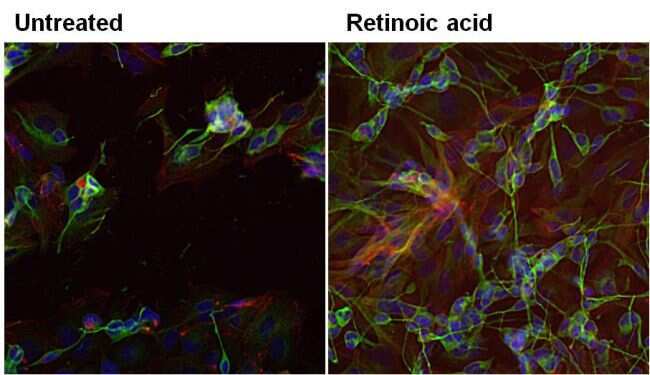
- Immunofluorescent analysis of beta-3 Tubulin in SHSY5Y cells (human neuroblast) either left untreated (left panel) or treated with 10uM retinoic acid (right panel) for 72 hours. Formalin-fixed cells were permeabilized with 0.1% Triton X-100 in TBS for 10 minutes at room temperature. Cells were blocked with 1% Blocker BSA (Product # 37525) for 15 minutes at room temperature. Cells were probed without (left panel) or with (right panel) a beta-3 Tubulin monoclonal antibody (Product # MA1-118) at a dilution of 1:100 for at least 1 hour at room temperature, washed with PBS, and incubated with a DyLight 488-conjugated goat anti-mouse IgG secondary antibody (Product # 35502). F-Actin (red) was stained with DyLight-554 Phalloidin (Product # 21834) and nuclei (blue) were stained with Hoechst 33342 dye (Product # 62249). Images were taken on a Thermo Scientific ToxInsight at 20X magnification.
- Submitted by
- Invitrogen Antibodies (provider)
- Main image
- Experimental details
- Immunofluorescence analysis of beta-3 Tubulin was performed using 70% confluent log phase SH-SY5Y cells. The cells were fixed with 4% paraformaldehyde for 10 minutes, permeabilized with 0.1% Triton™ X-100 for 10 minutes, and blocked with 1% BSA for 1 hour at room temperature. The cells were labeled with beta-3 Tubulin (2G10) Mouse Monoclonal Antibody (Product # MA1-118X) at 2µg/mL in 0.1% BSA and incubated for 3 hours at room temperature and then labeled with Goat anti-Mouse IgG (H+L) Superclonal™ Secondary Antibody, Alexa Fluor® 488 conjugate (Product # A28175) at a dilution of 1:2000 for 45 minutes at room temperature (Panel a: green). Nuclei (Panel b: blue) were stained with SlowFade® Gold Antifade Mountant with DAPI (Product # S36938). F-actin (Panel c: red) was stained with Rhodamine Phalloidin (Product # R415, 1:300). Panel d represents the merged image showing cytoplasmic localization. Panel e shows the no primary antibody control. The images were captured at 60X magnification.
Supportive validation
- Submitted by
- Invitrogen Antibodies (provider)
- Main image

- Experimental details
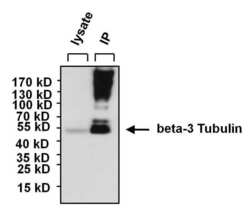
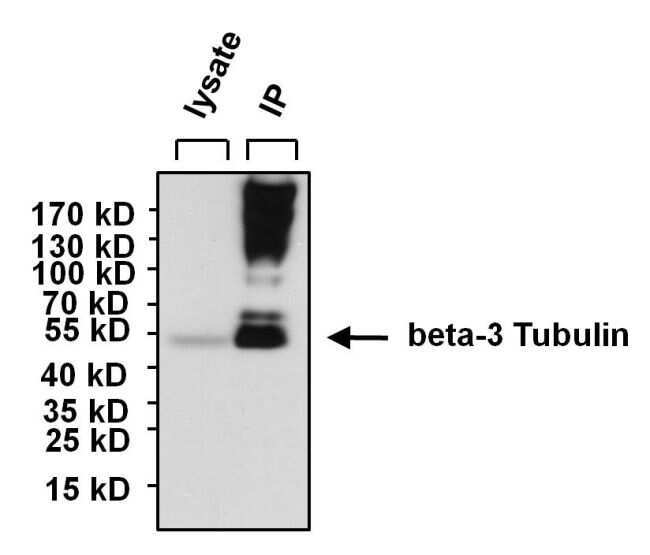
- Immunoprecipitation of beta-3 Tubulin was performed using SHSY5Y whole cell lysate. Antigen-antibody complexes were formed by incubating 300 µg of lysate with 5 µg of a beta-3 Tubulin monoclonal antibody (Product # MA1-118) overnight on a rocking platform at 4°C. The immune complexes were captured on 50 µL Protein A/G Agarose (Product # 20421), washed extensively, and eluted with 5X Lane Marker Reducing Sample Buffer (Product # 39000). SHSY5Y cell lysate (30 µg) was loaded as a positive control (left lane). The sample was resolved on a 4-20% Tris-HCl polyacrylamide gel, transferred to a PVDF membrane, and blocked with 5% BSA/TBS-0.1%Tween for at least 1 hour. The membrane was probed with a beta-3 Tubulin monoclonal antibody (Product # MA1-118) at a dilution of 1:1000 overnight rotating at 4°C, washed in TBST, and probed with Clean-blot IP Detection Reagent (Product # 21230) at a dilution of 1:1000 for at least 1 hour. Chemiluminescent detection was performed using SuperSignal West Pico (Product # 34080).

Supportive validation
- Submitted by
- Invitrogen Antibodies (provider)
- Main image
- Experimental details
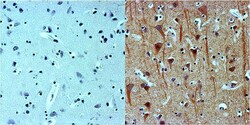
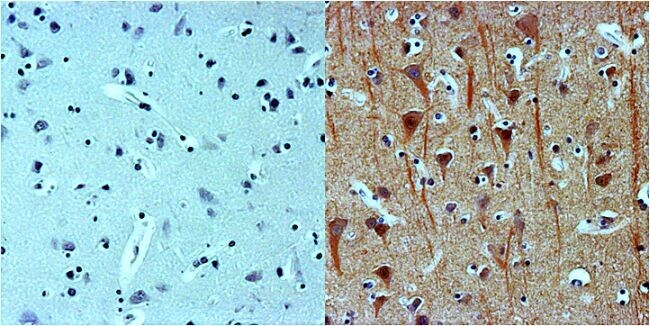
- Immunohistochemistry was performed on normal biopsies of deparaffinized human brain tissues. To expose target proteins, heat induced antigen retrieval was performed using 10mM sodium citrate (pH 6.0) buffer for 20 minutes at 95°C. Following antigen retrieval, tissues were blocked in 2% Blocker BSA (Product # 37525) in PBST for 1 hour at room temperature and then probed without (left panel) or with (right panel) a beta-3 Tubulin monoclonal antibody (Product # MA1-118) at a dilution of 1:100 for 1 hour at room temperature in a humidified chamber. Tissues were washed extensively with PBST and endogenous peroxidase activity quenched with Peroxidase Suppressor (Product # 35000) for 30 minutes at room temperature. Detection was performed using an HRP-conjugated goat anti-mouse IgG secondary antibody at a dilution of 1:500 followed by colorimetric detection using metal enhanced DAB. Tissues were counterstained with hematoxylin and prepped for mounting. Images were taken on a Zeiss Axiovision microscope at 32X magnification.
- Submitted by
- Invitrogen Antibodies (provider)
- Main image
- Experimental details
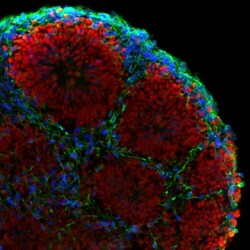
- Immunofluorescent analysis of beta-3 Tubulin (green), PAX6 (red), and CTIP2 (blue) in human iPSC-derived forebrain organoids derived at Day 40. The organoids were fixed with 4% PFA for 1 hour at room temperature, followed by incubation with 30% sucrose solution overnight at 4°C. The organoids were then embedded in OCT and cryosectioned at 5 µm, permeabilized with 0.2% Triton X-100 for 20 min, and blocked with 10% donkey serum in PBS for 30 min at room temperature. Organoid slices were stained with a Mouse beta-3 Tubulin monoclonal antibody (green; Product # MA1-118) at a dilution of 1:500, a Rabbit PAX6 polyclonal antibody (red; Product # 42-6600) at a dilution of 1:500, and a Rat CTIP2 polyclonal antibody (blue) at a dilution of 1:300 in blocking buffer overnight at 4°C, and then incubated with Donkey anti-Mouse Alexa Fluor 488 (Product # R37114), Donkey anti-Rabbit Alexa Fluor 568 (Product # A10042), and Goat anti-Rat Alexa Fluor 350 (Product # A-21093) at a dilution of 1:1000 in blocking solution at room temperature for 1 hour. Images were taken at 20X magnification. Data courtesy of Dr. Zhexing Wen at Emory University.

- Submitted by
- Invitrogen Antibodies (provider)
- Main image
- Experimental details
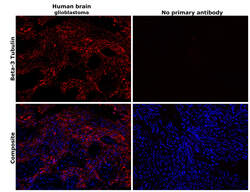
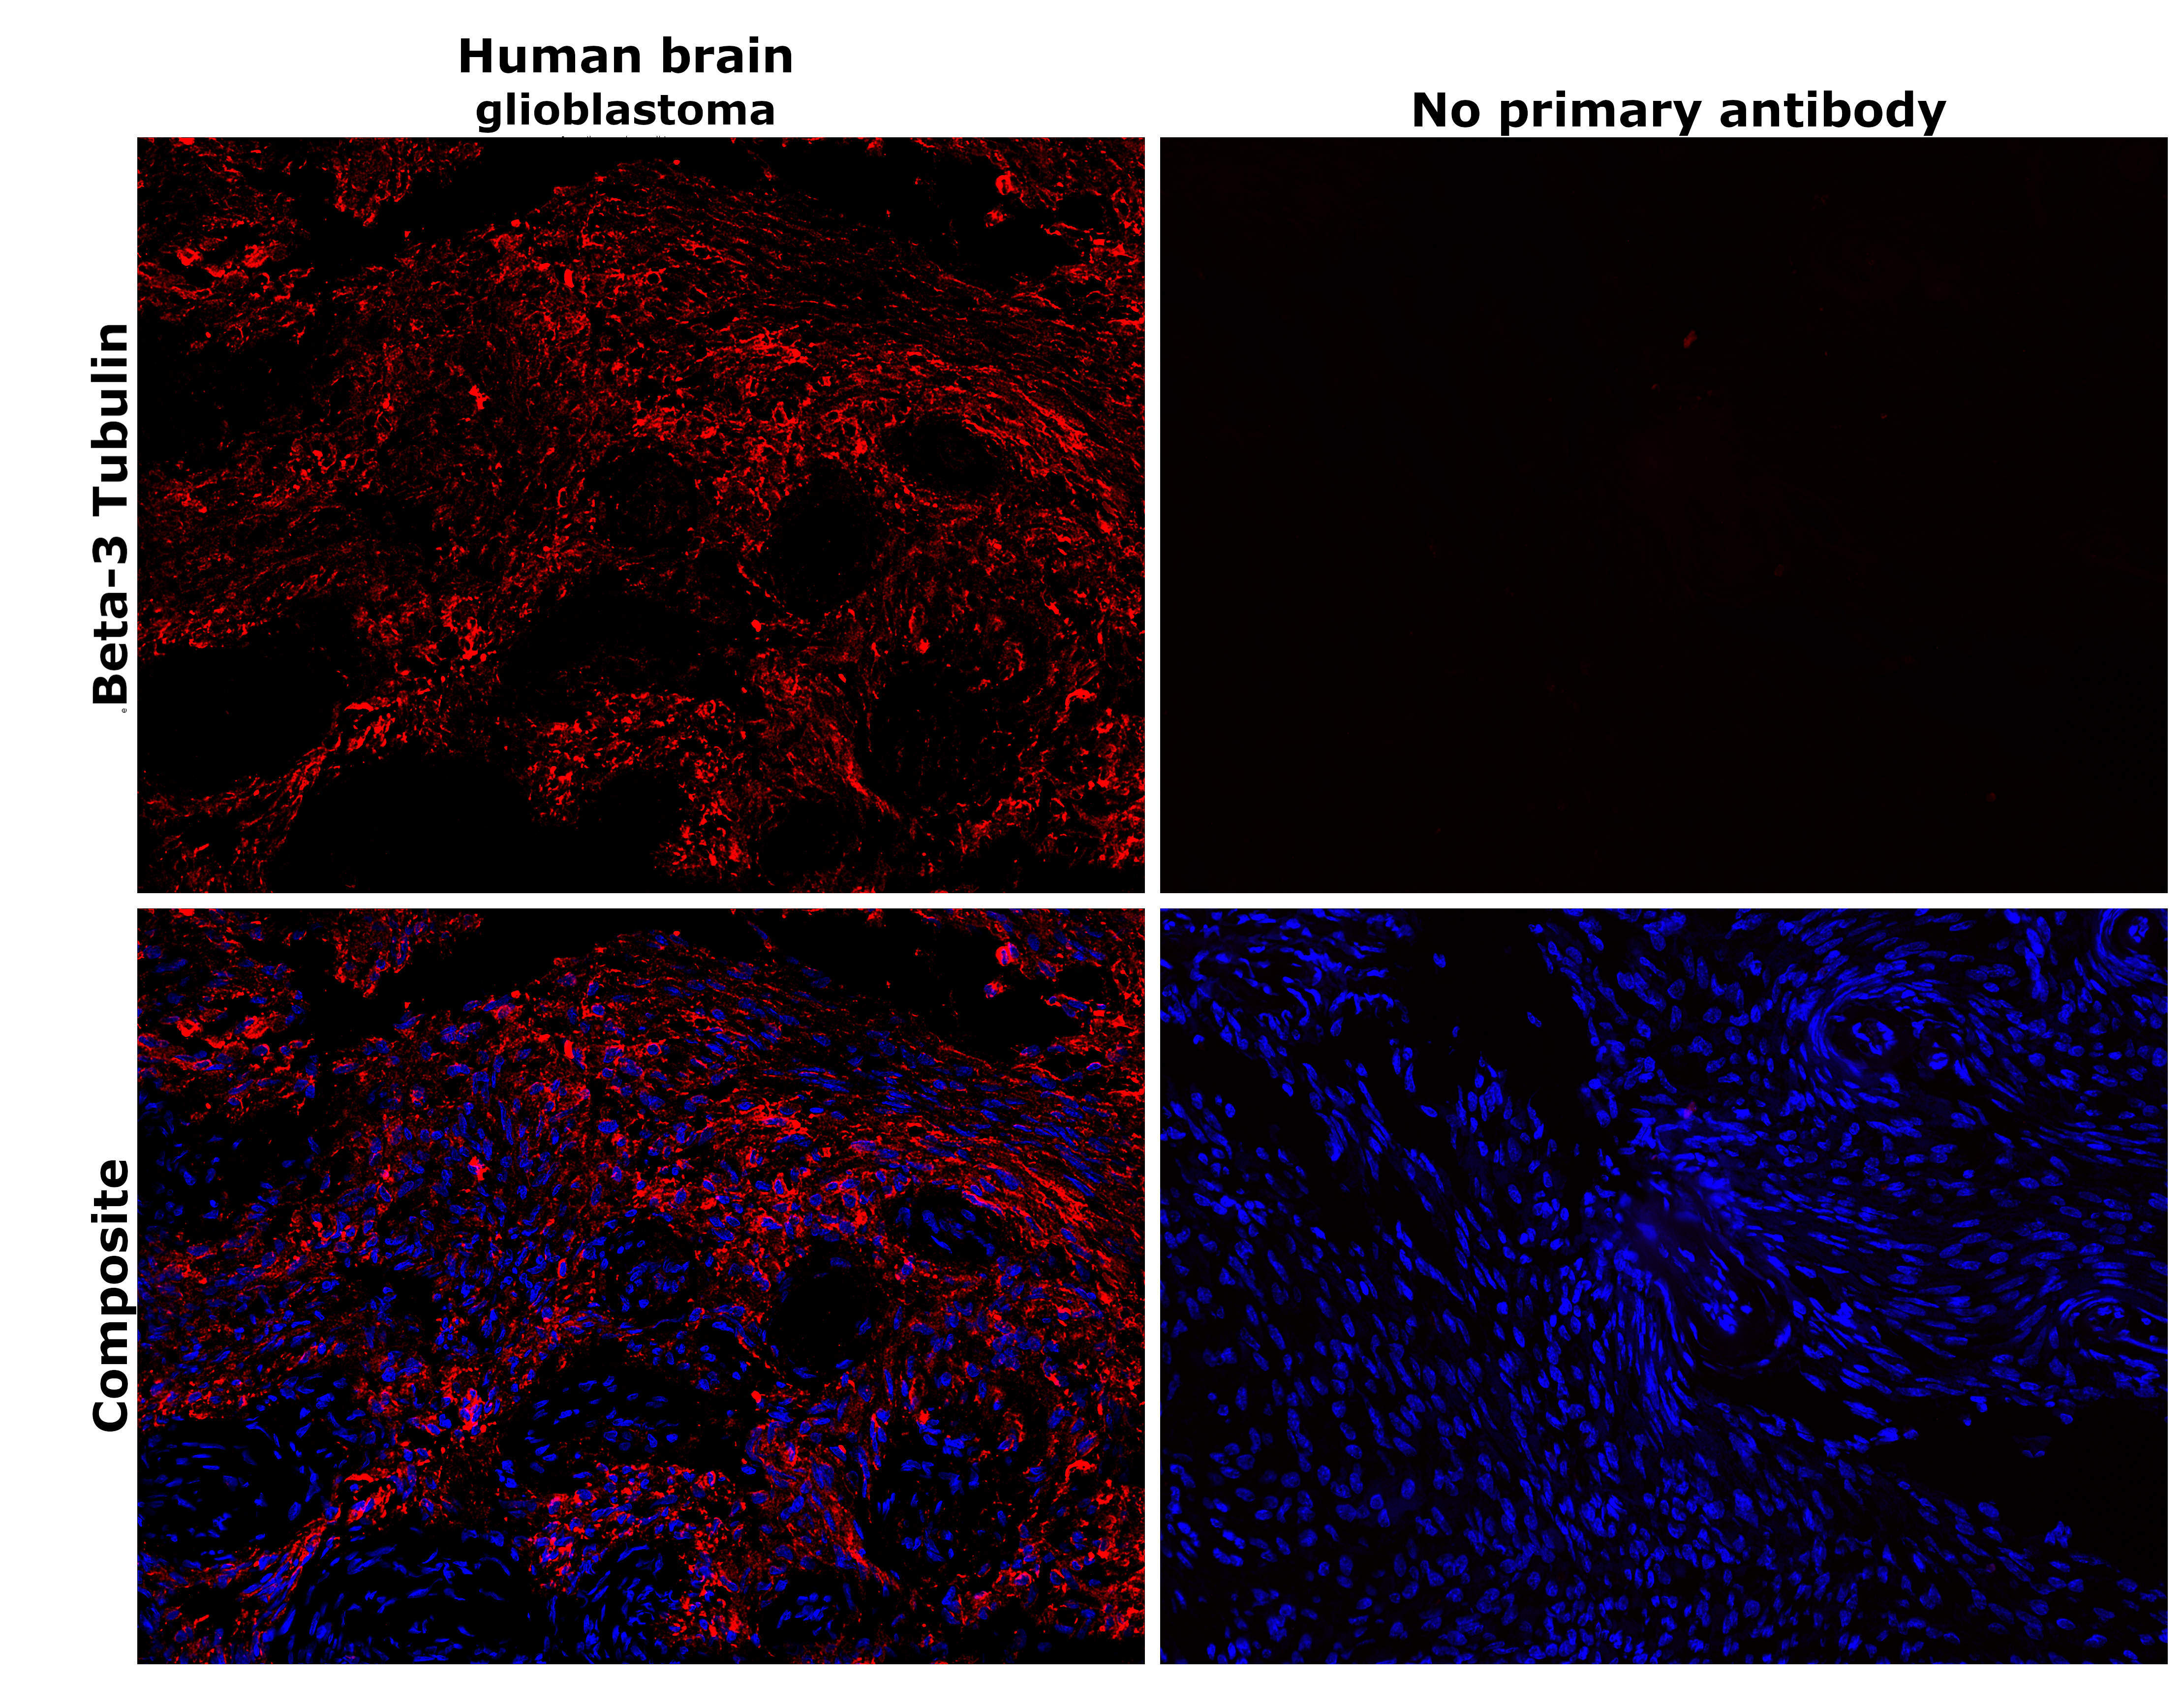
- Immunohistochemical analysis of beta-3 Tubulin was performed using formalin-fixed paraffin-embedded human brain (glioblastoma) tissue sections. To expose the target protein, heat-induced epitope retrieval was performed on de-paraffinized sections using eBioscience™ IHC Antigen Retrieval Solution - High pH (10X) (Product # 00-4956-58) diluted to 1X solution in water in a decloaking chamber at 110 degree Celsius for 15 minutes. Following antigen retrieval, the sections were blocked with 3% H2O2 for 1 hour at room temperature followed by 2% normal goat serum in 1X PBS and then probed with or without beta-3 Tubulin Monoclonal Antibody (2G10) (Product # MA1-118) at 1:500 dilution in 0.1% normal goat serum overnight at 4 degree Celsius in a humidified chamber. Detection was performed using Alexa Fluor™ 647 Tyramide SuperBoost™ Kit, goat anti-mouse IgG (Product # B40916). Nuclei were stained with DAPI (Product # D1306) and the sections were mounted using ProLong™ Glass Antifade Mountant (Product # P36984). The images were captured on EVOS™ M7000 Imaging System (Product # AMF7000) at 20X magnification and externally deconvoluted.
- Submitted by
- Invitrogen Antibodies (provider)
- Main image
- Experimental details
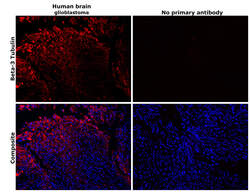
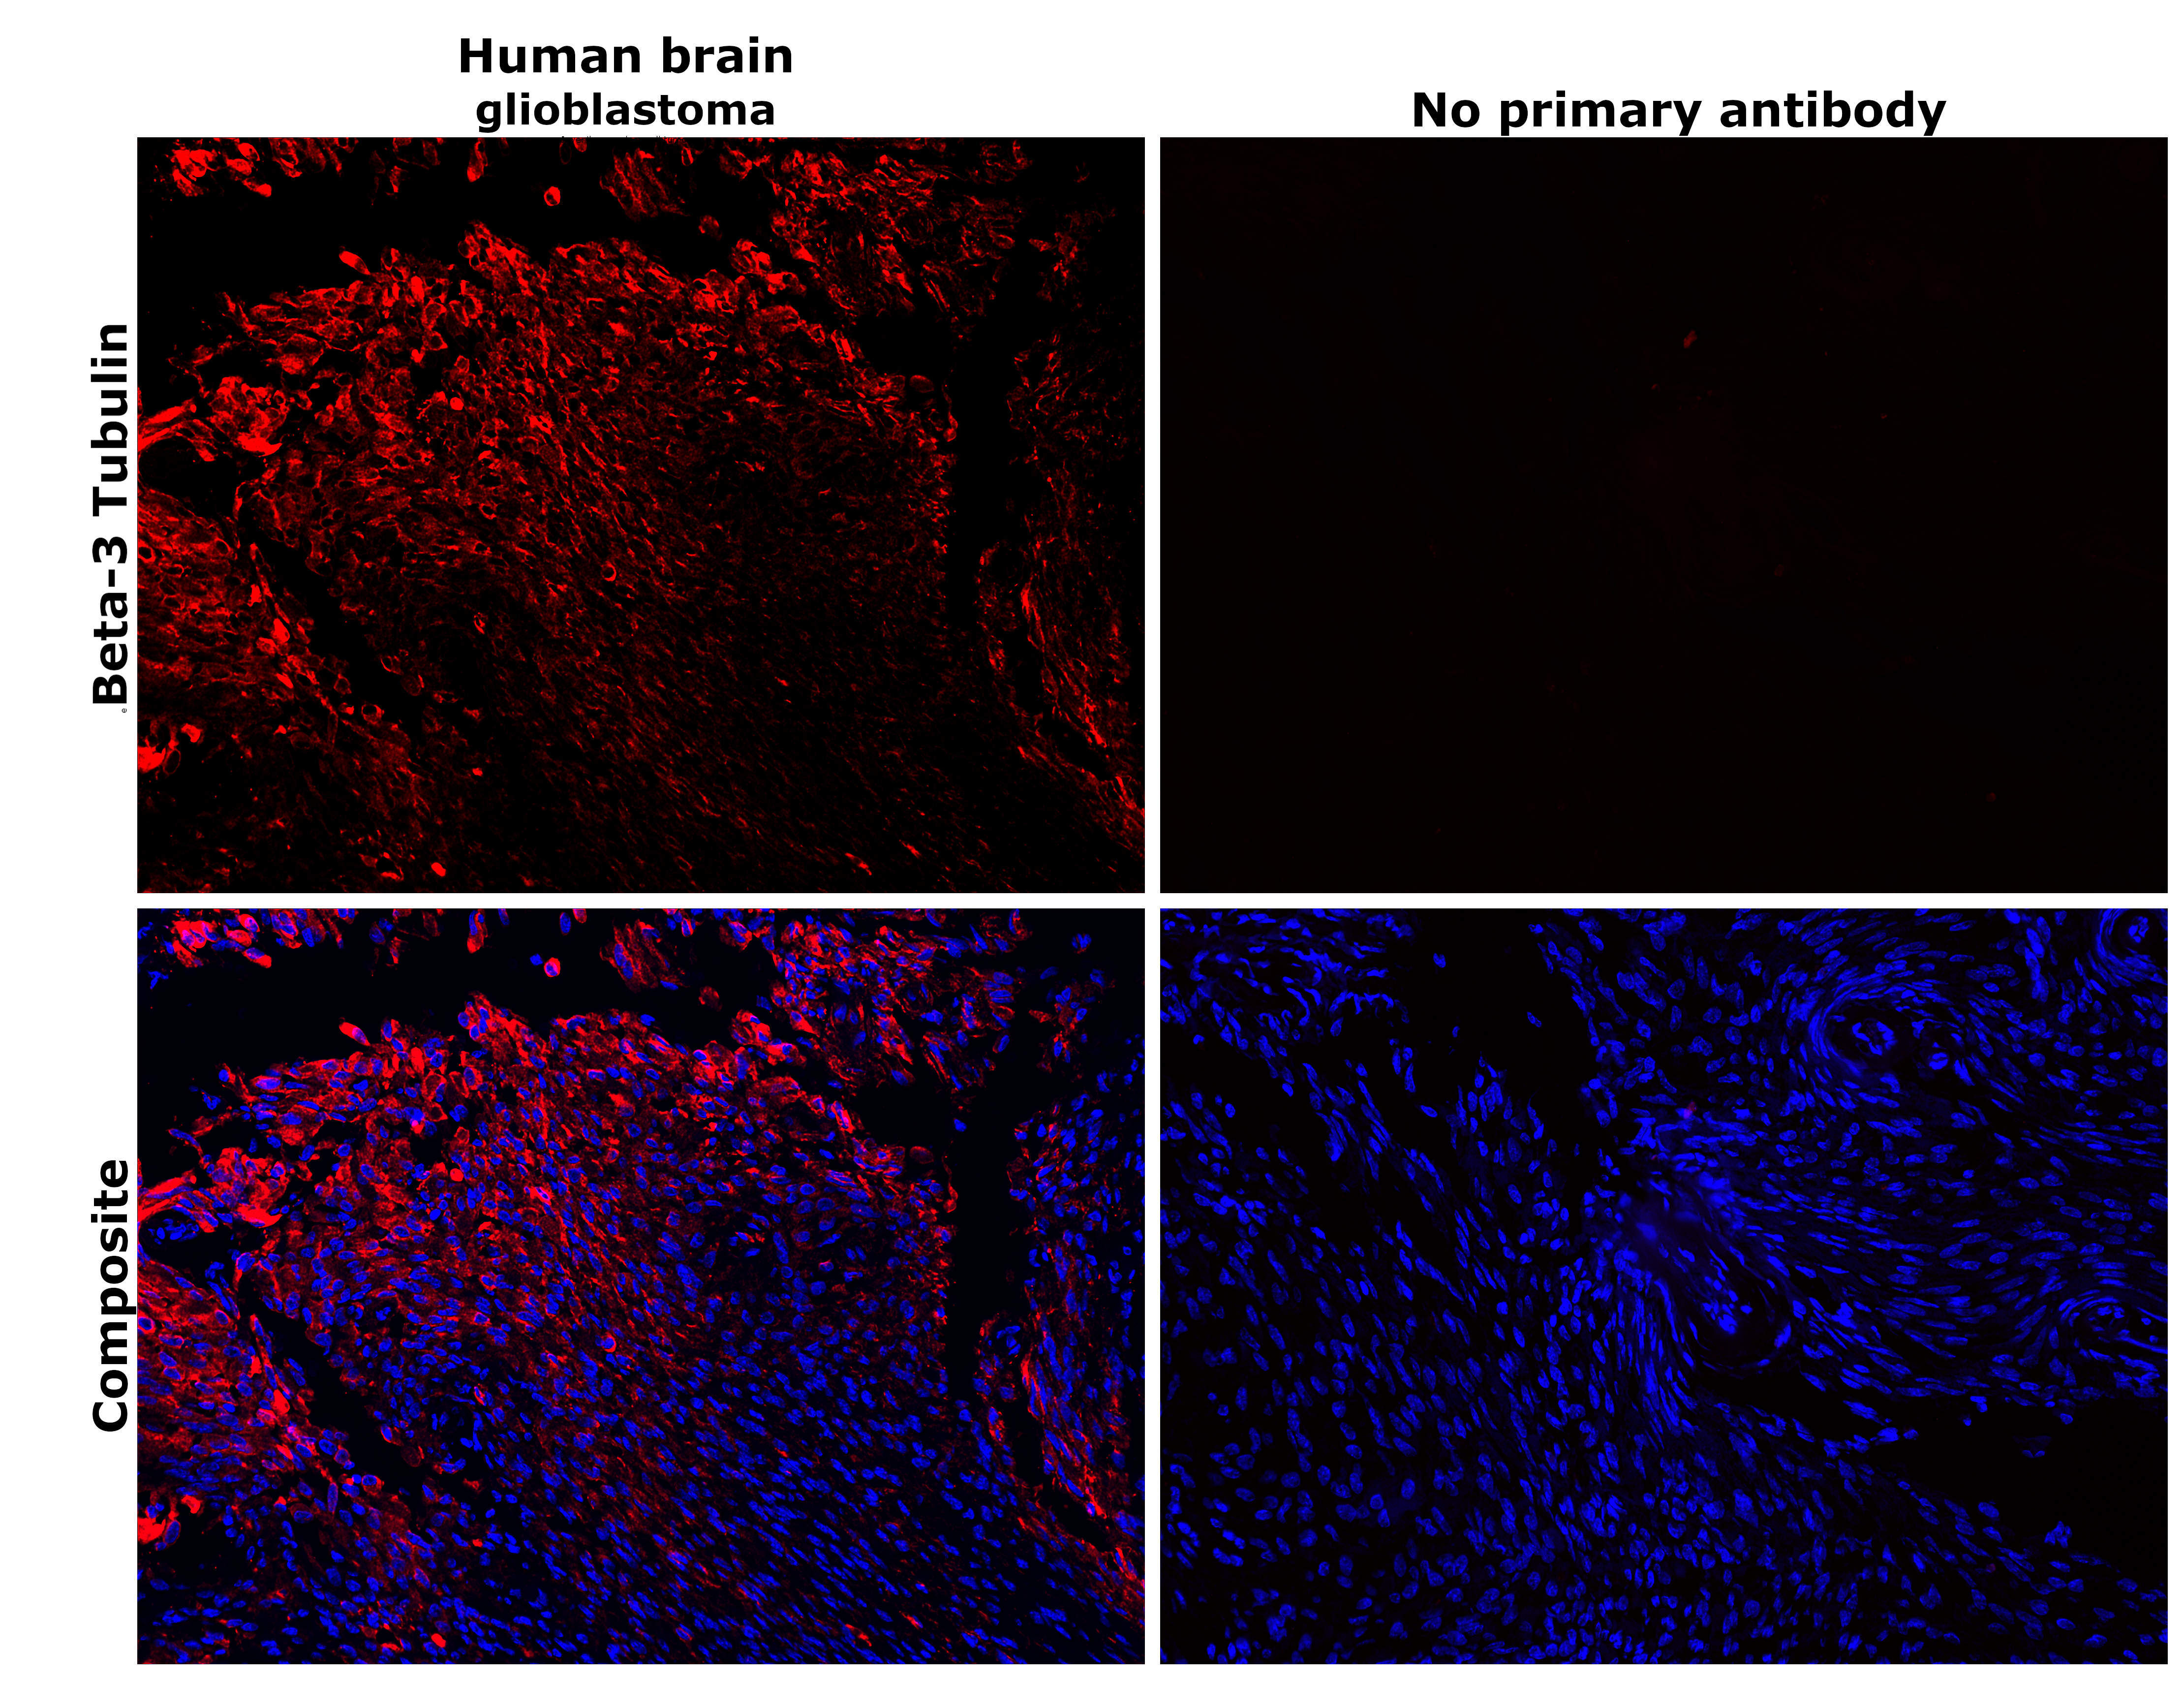
- Immunohistochemical analysis of beta-3 Tubulin was performed using formalin-fixed paraffin-embedded human brain (glioblastoma) tissue sections. To expose the target protein, heat-induced epitope retrieval was performed on de-paraffinized sections using eBioscience™ IHC Antigen Retrieval Solution - Low pH (10X) (Product # 00-4955-58) diluted to 1X solution in water in a decloaking chamber at 110 degree Celsius for 15 minutes. Following antigen retrieval, the sections were blocked with 3% H2O2 for 1 hour at room temperature followed by 2% normal goat serum in 1X PBS and then probed with or without beta-3 Tubulin Monoclonal Antibody (2G10) (Product # MA1-118) at 1:500 dilution in 0.1% normal goat serum overnight at 4 degree Celsius in a humidified chamber. Detection was performed using Alexa Fluor™ 647 Tyramide SuperBoost™ Kit, goat anti-mouse IgG (Product # B40916). Nuclei were stained with DAPI (Product # D1306) and the sections were mounted using ProLong™ Glass Antifade Mountant (Product # P36984). The images were captured on EVOS™ M7000 Imaging System (Product # AMF7000) at 20X magnification and externally deconvoluted.
- Submitted by
- Invitrogen Antibodies (provider)
- Main image
- Experimental details
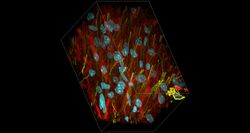
- Deep tissue imaging with non-curing, refractive index matched SlowFade™ Glass. Cryo-preserved rat brain sections (100 µm thick), stained for tubulin (red) with Mouse Anti-Beta3-Tubulin (Cat. No. MA1-118) and GFAP (yellow) Rabbit Anti-GFAP (Cat. No. OPA1-06100). Targets were detected with Alexa Fluor™ Plus 594 Goat Anti-Mouse (Cat. No. A-11032) and Alexa Fluor™ Plus 647 Goat Anti-Rabbit (Cat. No. A-32733). Nuclei (Cyan) were stained with DAPI (Cat. No. D1306). Slides were mounted with SlowFade™ Glass non-curing Antifade Mountant (Cat. No. S36917) and imaged with a Zeiss LSM 710 confocal microscope using a Plan-Apochromat 63×/1.4 NA Oil immersion objective at a rate of 71 nm in the x and y dimensions and 110 nm in the z dimension, with a pixel size of 0.07 µm. Z-projections were generated using Zeiss™ Zen software.
- Submitted by
- Invitrogen Antibodies (provider)
- Main image
- Experimental details
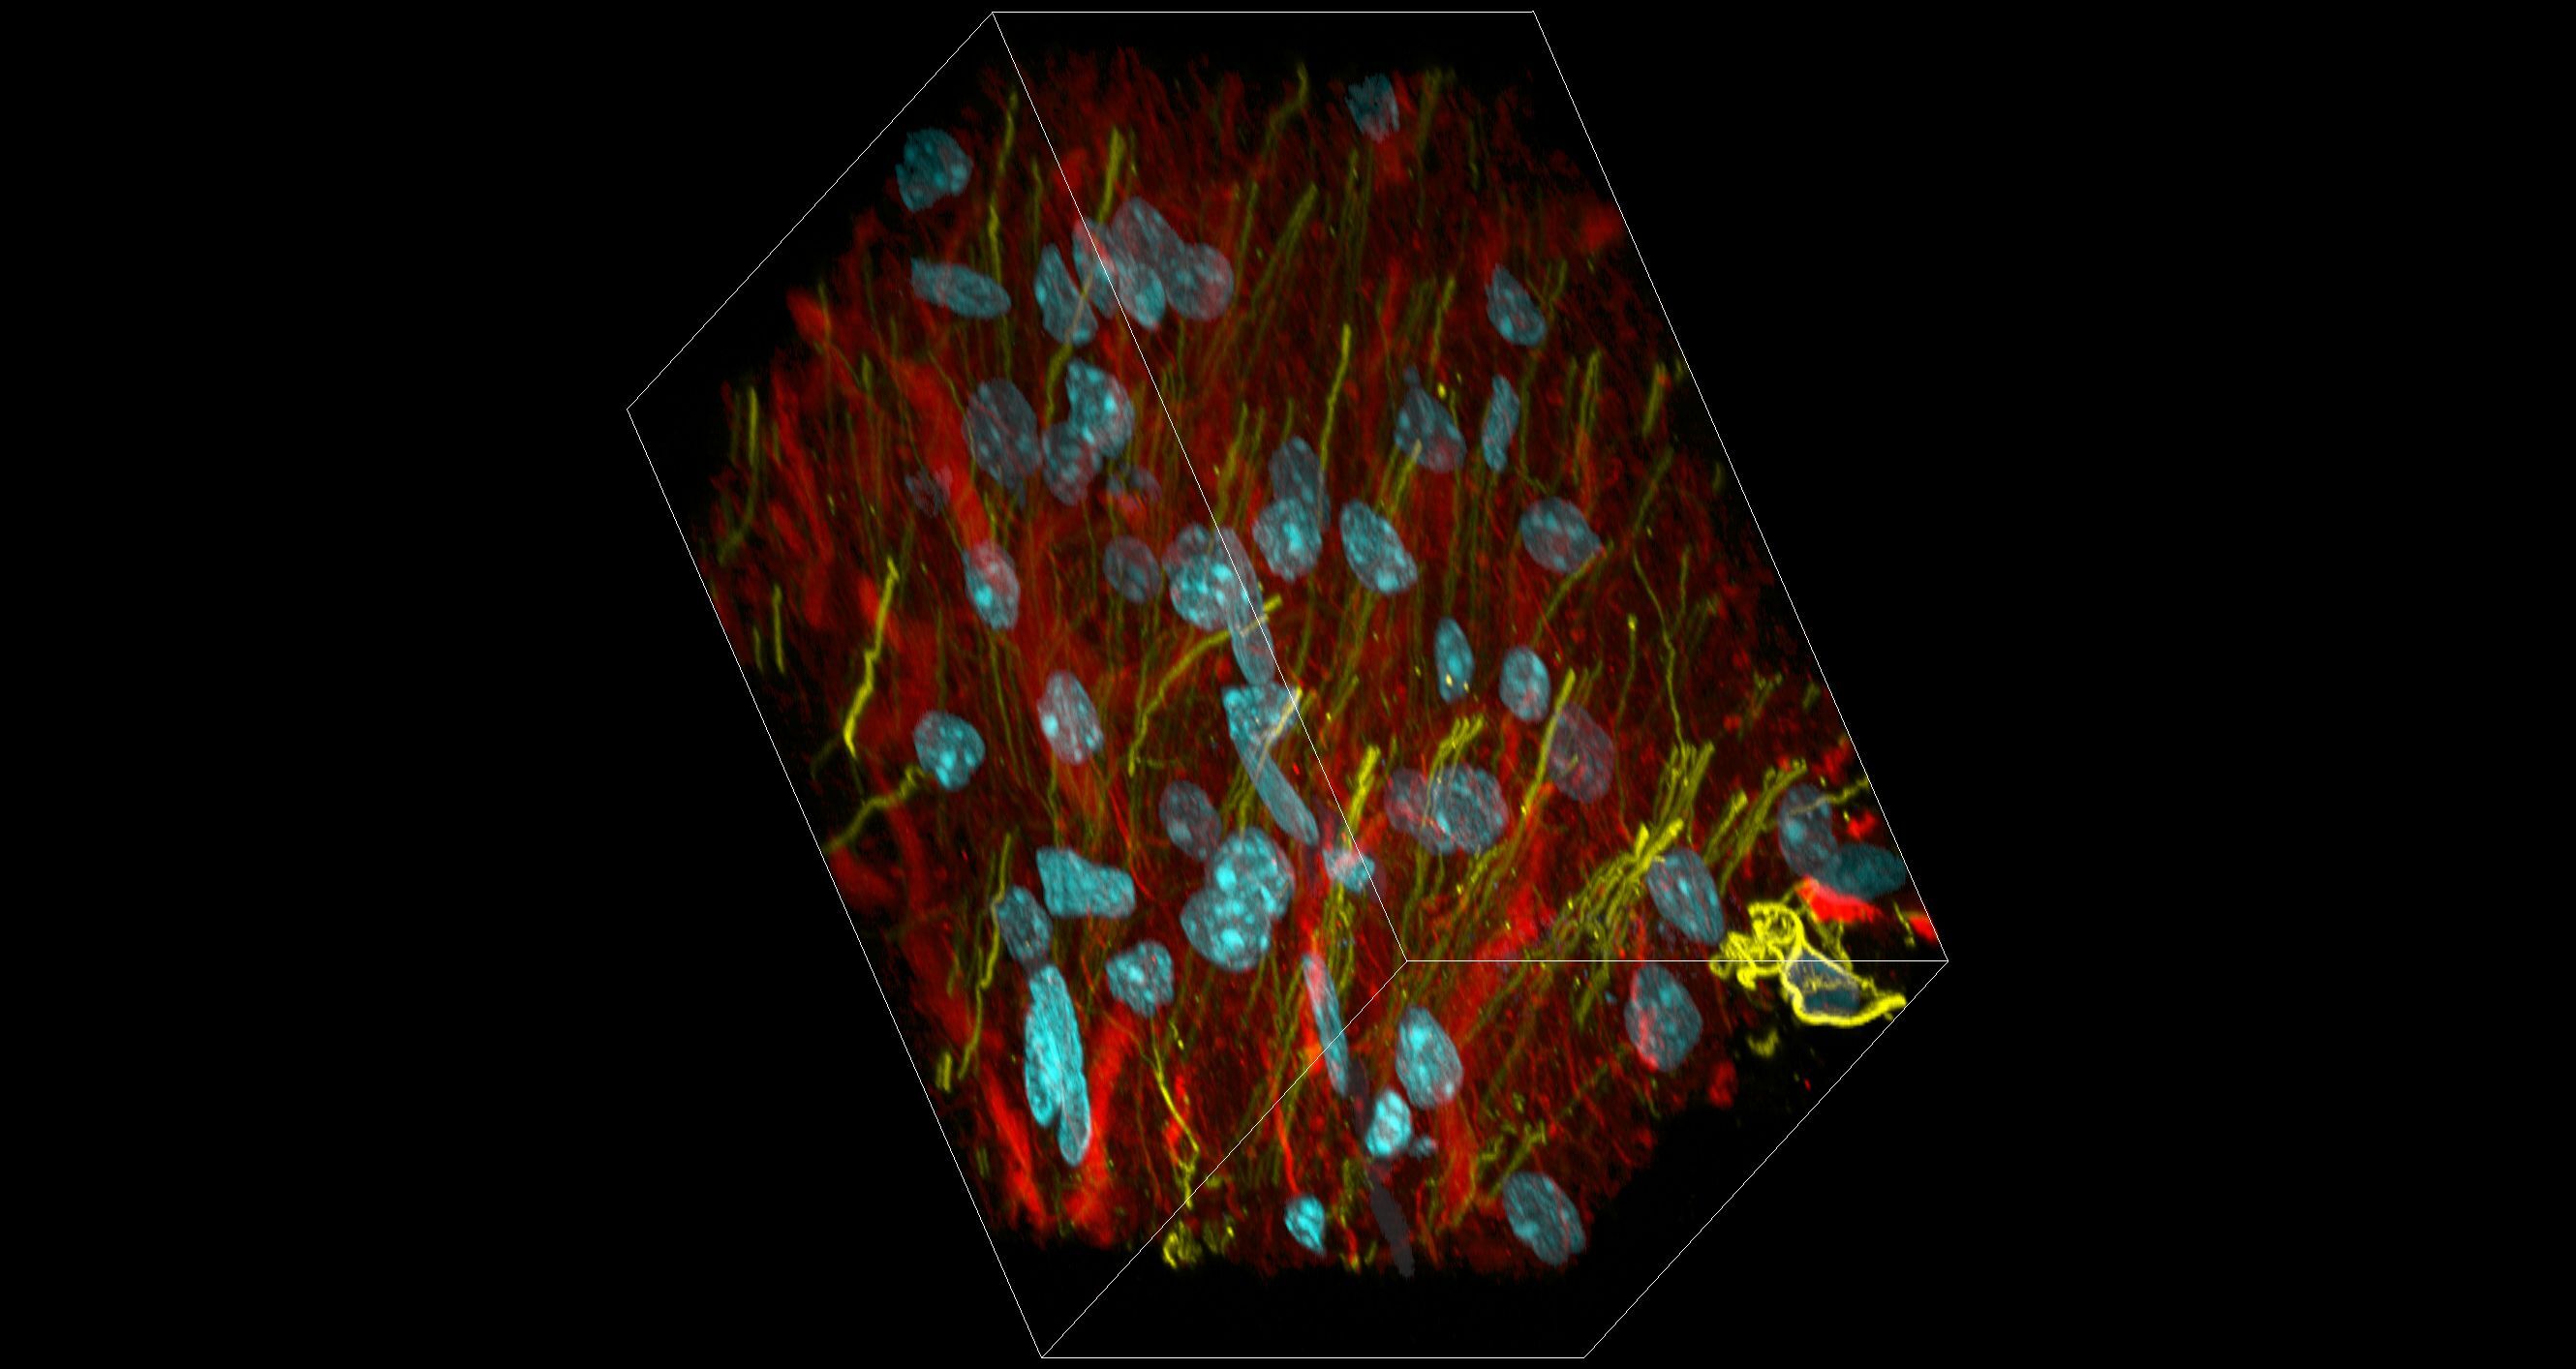
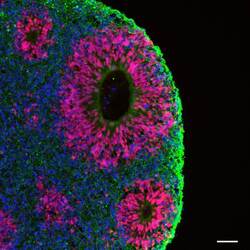
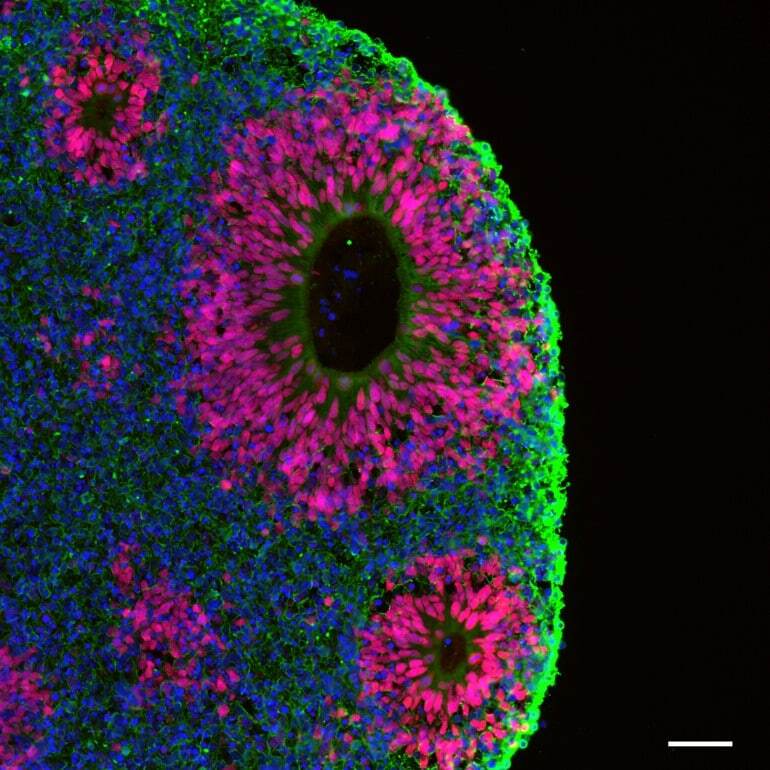
- Immunofluorescent analysis of beta-3 Tubulin (green) and PAX6 (red) in human iPSC-derived forebrain organoids derived at Day 40. The organoids were fixed with 4% PFA for 1 hour at room temperature, followed by incubation with 30% sucrose solution overnight at 4°C. The organoids were then embedded in OCT and cryosectioned at 5 µm, permeabilized with 0.2% Triton X-100 for 20 min, and blocked with 10% donkey serum in PBS for 30 min at room temperature. Organoid slices were stained with a Mouse beta-3 Tubulin monoclonal antibody (green; Product # MA1-118) at a dilution of 1:500, and a Rabbit PAX6 polyclonal antibody (red; Product # 42-6600) at a dilution of 1:500 in blocking buffer overnight at 4°C, and then incubated with Donkey anti-Mouse Alexa Fluor 488 (Product # R37114) and Donkey anti-Rabbit Alexa Fluor 568 (Product # A10042) at a dilution of 1:1000 as well as DAPI (blue; 1:25000) in blocking solution at room temperature for 1 hour. Images were taken at 20X magnification. Scale bar: 50 µm. Data courtesy of Dr. Zhexing Wen at Emory University.
Supportive validation
- Submitted by
- Invitrogen Antibodies (provider)
- Main image
- Experimental details
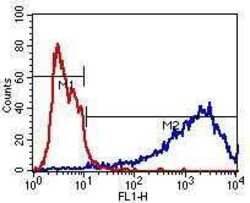
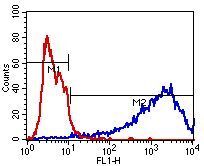
- Flow cytometry analysis of beta-3 Tubulin (blue histogram) on human SHSY5Y neuroblast cells. Cells were harvested, fixed with 4% formaldehyde, washed with PBS, and incubated with a beta-3 Tubulin monoclonal antibody (Product # MA1-118) at a 1:50 dilution or PBS alone (red histogram) for 1 hour at room temperature. For flow cytometry analysis, a 30-minute incubation with DyLight 488 goat anti-mouse IgG secondary antibody (Product # 35502) was performed and 10,000 cells were acquired for each sample.

- Submitted by
- Invitrogen Antibodies (provider)
- Main image

- Experimental details
- Flow cytometry analysis of beta-3 Tubulin (blue histogram) on human SHSY5Y neuroblast cells. Cells were harvested, fixed with 4% formaldehyde, washed with PBS, and incubated with a beta-3 Tubulin monoclonal antibody (Product # MA1-118) at a 1:50 dilution or PBS alone (red histogram) for 1 hour at room temperature. For flow cytometry analysis, a 30-minute incubation with DyLight 488 goat anti-mouse IgG secondary antibody (Product # 35502) was performed and 10,000 cells were acquired for each sample.
Supportive validation
- Submitted by
- Invitrogen Antibodies (provider)
- Main image
- Experimental details
- Immunoprecipitation of beta-3 Tubulin was performed using SHSY5Y whole cell lysate. Antigen-antibody complexes were formed by incubating 300 µg of lysate with 5 µg of a beta-3 Tubulin monoclonal antibody (Product # MA1-118) overnight on a rocking platform at 4øC. The immune complexes were captured on 50 µL Protein A/G Agarose (Product # 20421), washed extensively, and eluted with 5X Lane Marker Reducing Sample Buffer (Product # 39000). SHSY5Y cell lysate (30 µg) was loaded as a positive control (left lane). The sample was resolved on a 4-20% Tris-HCl polyacrylamide gel, transferred to a PVDF membrane, and blocked with 5% BSA/TBS-0.1%Tween for at least 1 hour. The membrane was probed with a beta-3 Tubulin monoclonal antibody (Product # MA1-118) at a dilution of 1:1000 overnight rotating at 4øC, washed in TBST, and probed with Clean-blot IP Detection Reagent (Product # 21230) at a dilution of 1:1000 for at least 1 hour. Chemiluminescent detection was performed using SuperSignal West Pico (Product # 34080).
- Submitted by
- Invitrogen Antibodies (provider)
- Main image
- Experimental details
- NULL

- Submitted by
- Invitrogen Antibodies (provider)
- Main image
- Experimental details
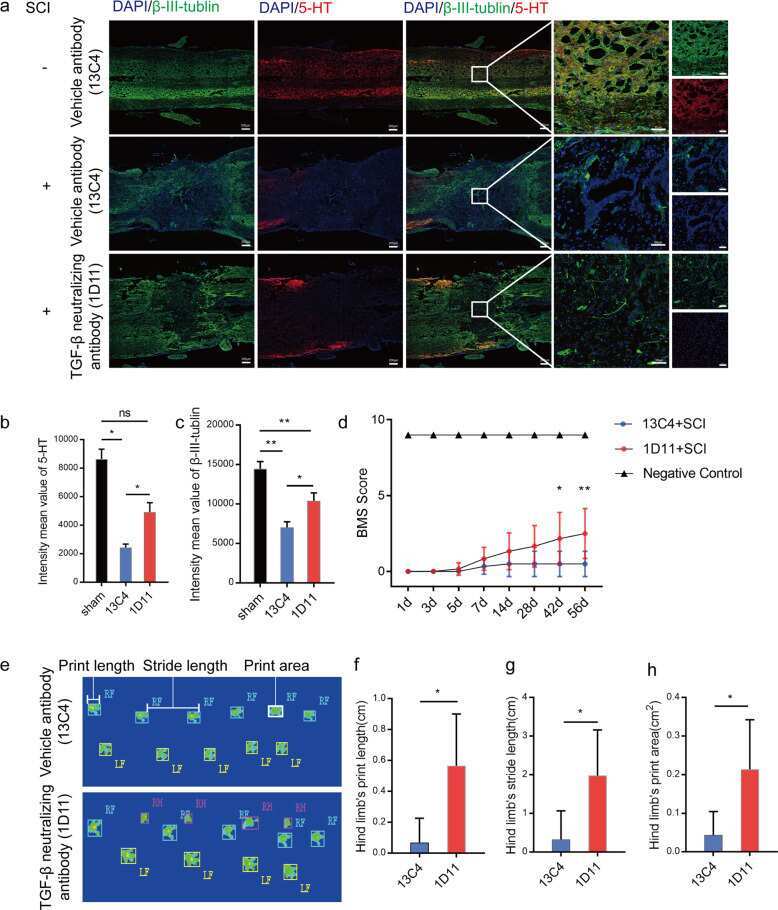
- Fig. 2 TGF-beta knockout improves functional recovery of mice after SCI. a Representative images of immunofluorescent analysis of 5-HT (red), beta-III-tublin (green) and DAPI (blue) in each group at 4 weeks after SCI. Scale bars = 200 mum. Right images are high-resolution versions of the boxed regions in the left images, scale bars = 50 um. b , c Quantitative analysis of intensity mean value of 5-HT and beta-III-tublin (* p < 0.05, ** p < 0.01, n = 4). d Quantitative analysis of BMS score between 13C4 control mice after SCI, 1D11 group mice after SCI and mice without SCI (* p < 0.05, ** p < 0.01, n = 6). e - h Quantitative analysis of catwalk, including print length, stride length, and print area (* p < 0.05, n = 6). LF left front paw, RF right front paw, RH right hind paw. Statistical significance was determined by multifactorial ANOVA, and all data are shown as means +- standard deviations.
- Submitted by
- Invitrogen Antibodies (provider)
- Main image
- Experimental details
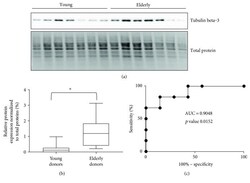
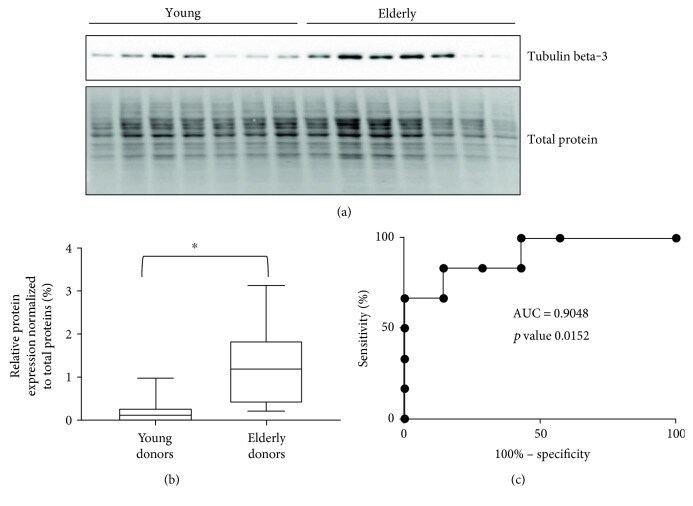
- Figure 2 (a) Western blot analysis of protein extract from young and elderly keratinocytes with tubulin beta-3 chain. (b) Box plots of relative protein expression of tubulin beta-3 chain in young and elderly donors (based on western blot data by considering the relative intensity of the specific antibodies on the membrane versus the amount of protein loaded on the gel for young and elderly donors, * significant p value < 0.05 ( p value 0.0152)). (c) Receiver operating characteristic curve (ROC curve) with an AUC of 0.9048.
- Submitted by
- Invitrogen Antibodies (provider)
- Main image
- Experimental details
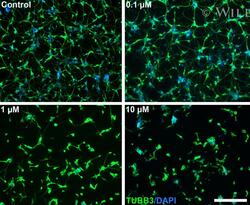
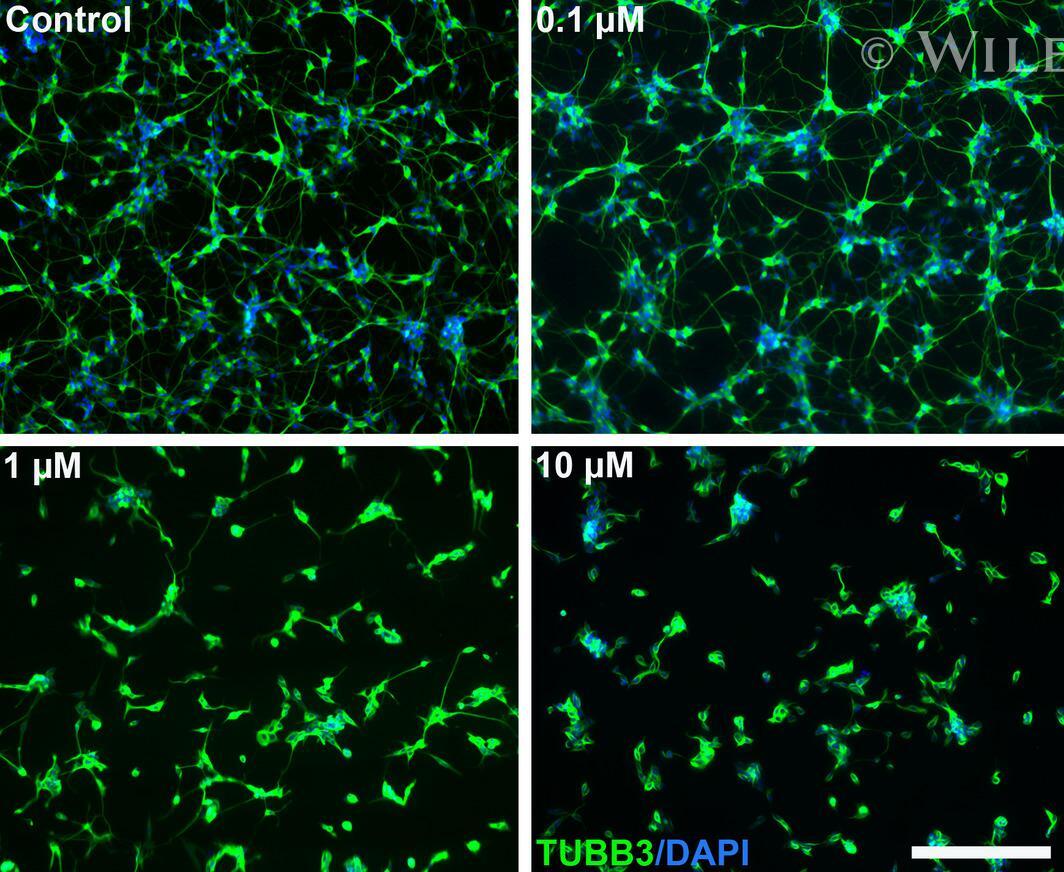
- 1 Figure Paclitaxel causes dose-dependent reduced neuronal networks in SH-SY5Y-derived neurons. Fully differentiated SH-SY5Y cells were treated with the indicated concentrations of paclitaxel for 24 hours. The cells were stained for beta-tubulin (TUBB3) and nuclei (DAPI). Scale bar represents 200 um.
- Submitted by
- Invitrogen Antibodies (provider)
- Main image
- Experimental details
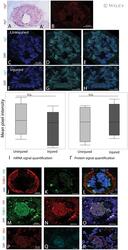
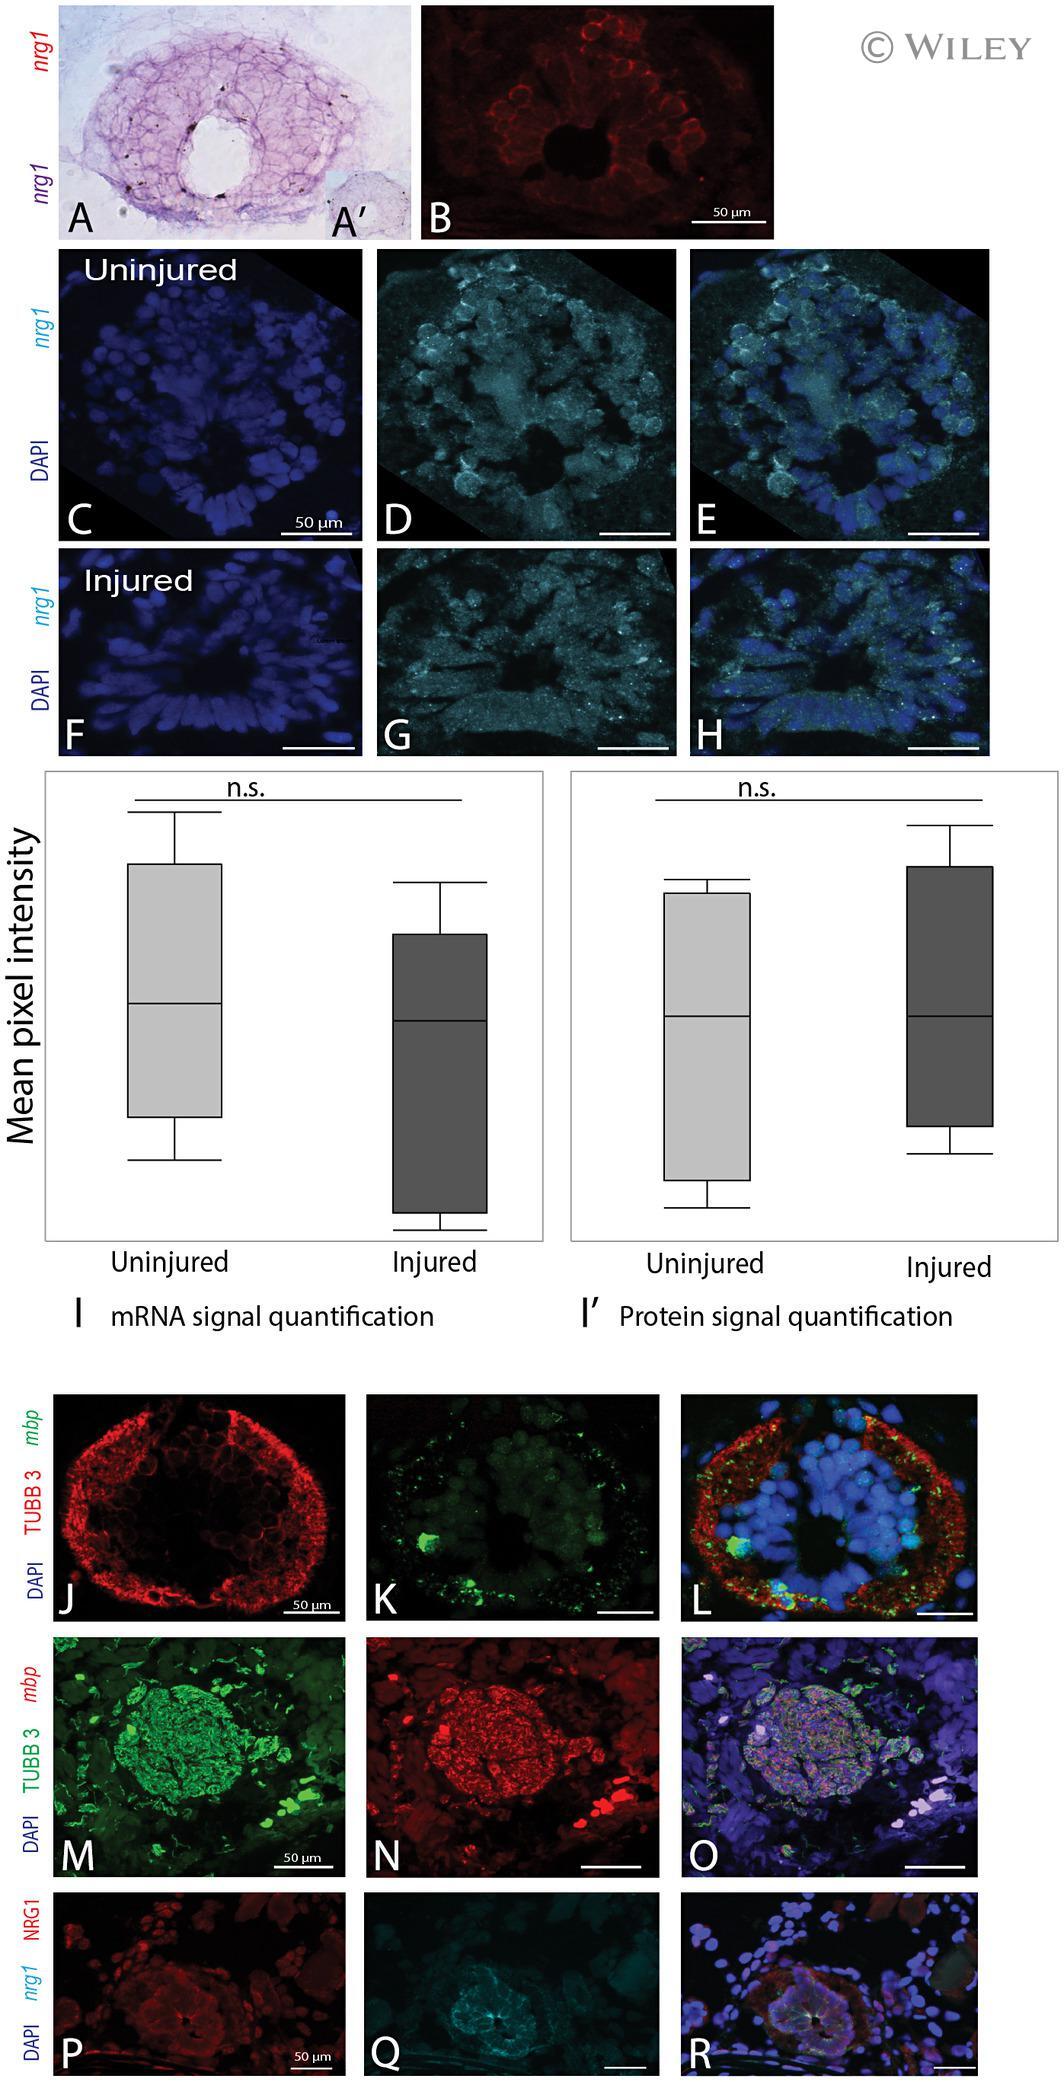
- In situ HCR adaptation in axolotls (A) Classic digoxigenin-based enzymatic in situ hybridization using a probe for nrg1 . A' shows the sense probe for nrg1 . (B) An example of HCR in situ hybridization using a probe for nrg1. (C-E) A cross section of an uninjured tail stained for nrg1 mRNA. (F-H) A cross section of a regenerating tail 14 dpa probed for nrg1 mRNA. (I) Quantification of nrg1 signal in the uninjured and regenerating axolotl spinal cord showed no significant change between conditions. (I') Quantification of Nrg1 signal in the uninjured and regenerating axolotl spinal cord showed no significant change between conditions. (J-L) In situ HCR and IHC staining for mbp in red and TUBB3 in green in a cross section of an uninjured axolotl spinal cord. (M-O) In situ HCR and IHC staining for mbp in red and TUBB3 in green in a cross section of a brachial nerve in the axolotl forelimb. (P-R) In situ HCR and IHC staining for NRG1 in red and nrg1 in magenta in a cross section of an uninjured axolotl spinal cord. [Colour figure can be viewed at wileyonlinelibrary.com ]
- Submitted by
- Invitrogen Antibodies (provider)
- Main image
- Experimental details
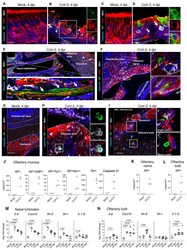
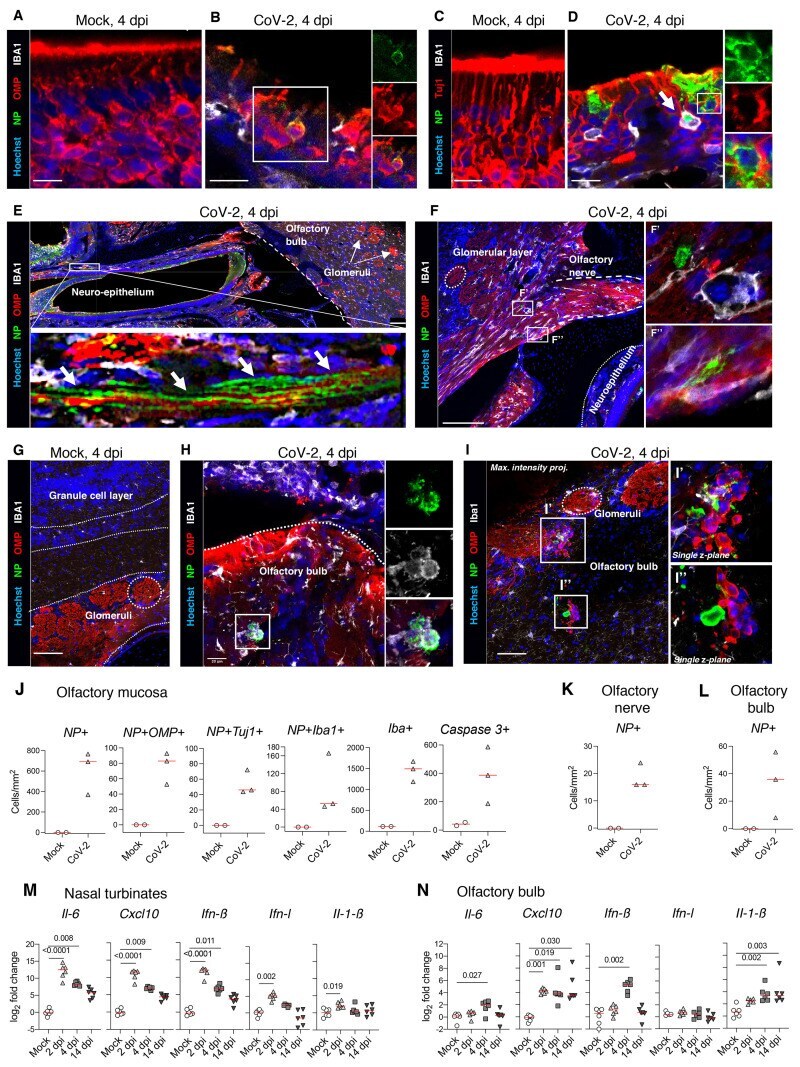
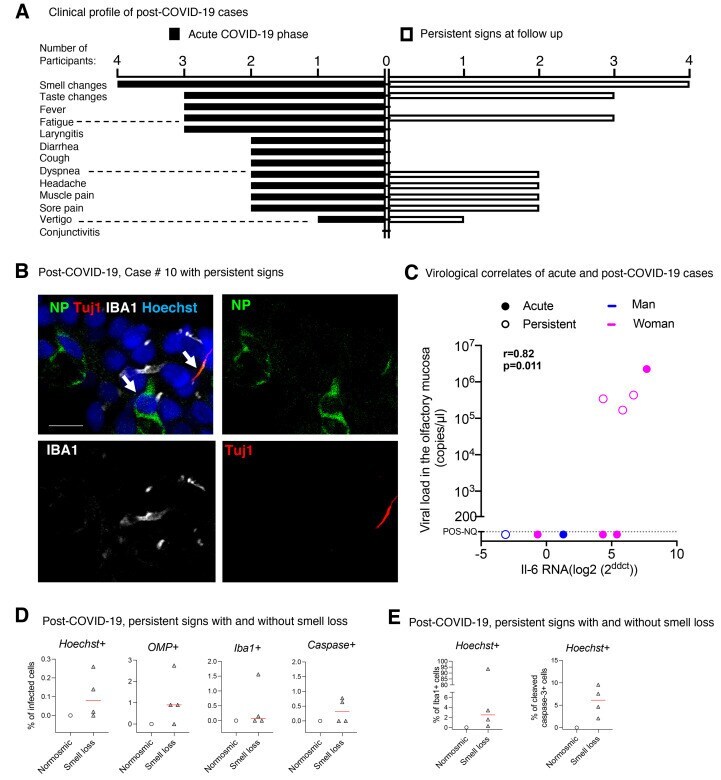
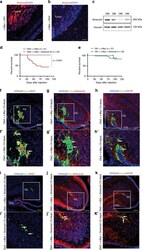
- Fig. 6 SARS-CoV-2 antigens detection and cytokine/chemokine transcripts quantification in the olfactory system of hamsters. ( A-D ) Olfactory epithelium of mock- ( A, C ) and SARS-CoV-2 ( B, D ) infected hamsters at 4 dpi. Insets show infected OMP + mature olfactory sensory neurons ( B ), or infected Tuj1 + immature olfactory sensory neurons ( D ). The arrow in D indicates an infected Iba1+ cell. ( E ) Sagittal section showing nasal turbinates and olfactory bulb of SARS-CoV-2 infected hamster at 4 dpi. Inset depicts SARS-CoV-2 staining in olfactory sensory neuron axons. ( F ) Olfactory sensory axons projecting into glomeruli in the olfactory bulb of SARS-CoV-2 inoculated hamsters at 4 dpi. Insets ( F', F'' ) show infected cells. ( G-I ) Olfactory bulb of mock-( G ) or SARS-CoV-2 ( H, I ) infected hamsters at 4 dpi. Iba1 + infected cells are shown in ( H ) and several infected cells are observed in ( I ). SARS-CoV-2 is detected by antibodies raised against the viral nucleoprotein (NP). Scale bars: 20mum (A-D, H), 100mum (E, F), 50mum (G, I). Images are single z-planes (A-H) or maximum intensity projection over a 6mum depth (I). ( J ) Number of NP+ cells, NP+OMP+ cells, NP+Tuj1+ cells, NP+Iba1+, Iba1+ cells and cleaved caspase 3+ cells in the olfactory mucosa. ( K, L ) Number of NP+ cells in the olfactory nerve (K) and the olfactory bulb (L). ( M, N ) Cytokines and chemokines transcripts in the nasal turbinates ( M ) and in the olfactory bulb ( N ) at 2, 4 and 14 dpi. Mann-Whit
- Submitted by
- Invitrogen Antibodies (provider)
- Main image
- Experimental details
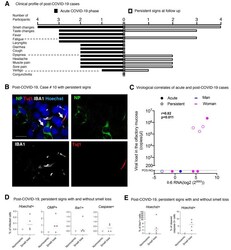
- Fig. 8 SARS-CoV-2 is present in the olfactory mucosa from patients with persistent loss of smell post-COVID-19 . ( A ) Clinical profile of the 4 patients with prolonged loss of smell post-COVID-19. The general symptoms at the acute phase and at the follow up (inclusion in CovidSmell study) are shown. ( B ) Immunofluorescence of infected cells in the olfactory mucosa of the case #10 presenting with persistent olfactory dysfunction at 196 days after COVID-19 onset. The left arrow indicates an infected cell with viral NP staining. The right arrow indicates a Tuj1-NP co-labeling in another cell. ( C ) Graph depicting the correlation between the IL-6 mRNA expression and the viral load in the 9 patients with acute COVID-19 (""acute"": n=5) or persistent olfactory dysfunction post-COVID-19 (""persistent"", n=4). ( D, E ) Fraction of infected cells among: Hoechst+ cells, OMP+ cells, Iba1+ cells and cleaved caspase 3+ cells (D), and fraction of Iba1+ cells among Hoechst+ cells (left), and fraction of cleaved caspase 3 + cells among Hoechst+ cells (right) in the olfactory mucosa of patients with persistent loss of smell post COVID-19 (n=4) and the patient #7 (post-COVID-19, persistent signs without loss of smell). ( E ) Viral load values were assessed by Taqman qPCR; when not quantifiable (nq:
- Submitted by
- Invitrogen Antibodies (provider)
- Main image
- Experimental details
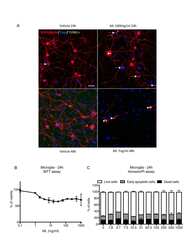
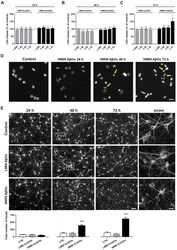
- Effect of Abeta42 oligomers on neuronal cell toxicity. Primary cortical neurons were cultured from E17 rat embryos and after 7 days in vitro were exposed to a serial dilution of LMW or HMW Abeta42Os (1:200, 1:40, 1:20, and 1:10) for 24 ( A ), 48 ( B ), or 72 ( C ) h. At the end of incubation, cell viability was determined by LDH assay. Results are expressed as percentage of LDH release relative to control cells (dashed lines). Data are means +- SEM of 3 independent experiments, each performed in triplicate. * p < 0.05 versus control cells. Two-way ANOVA, followed by Tukey's multiple comparison test. ( D ) Primary neurons were treated with HMW Abeta42Os (1:10 dilution) for 24, 48, or 72 h. Cells were then processed for DAPI staining. Yellow arrows indicate cells with small, fragmented, and condensed nuclei. Experiments were performed 3 times and representative fluorescence microscopy images are shown. The scale bar is 10 um. ( E ) Primary neurons were treated with LMW or HMW Abeta42Os (1:10 dilution) for 24, 48, or 72 h. Cells were then processed for betaIII-tubulin immunostaining. Experiments were performed 3 times and representative fluorescence microscopy images are shown. The scale bar on the left is 50 um. In the zoomed images, the scale bar is 10 um. Quantification of neuritic beading, performed using ImageJ software, is shown at the bottom of the corresponding images. Data are means +- SEM from five random fields of 3 independent experiments. *** p < 0.001 versus contro
- Submitted by
- Invitrogen Antibodies (provider)
- Main image
- Experimental details
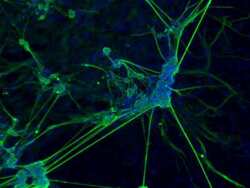
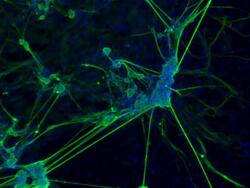
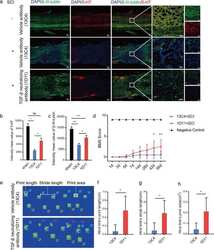
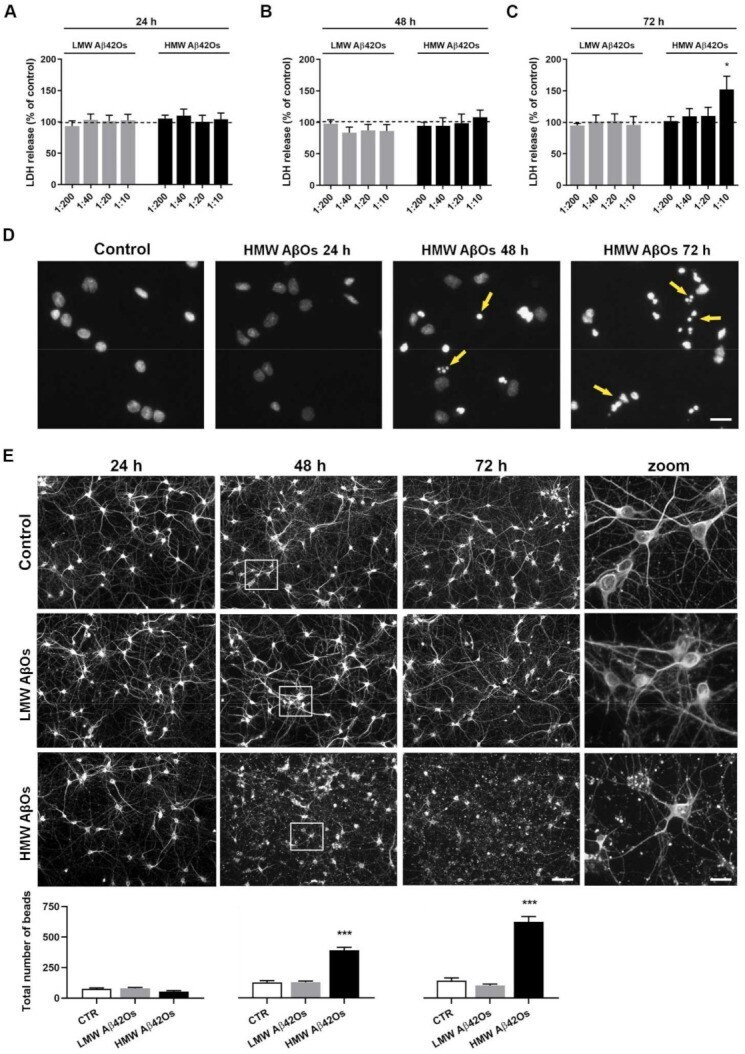
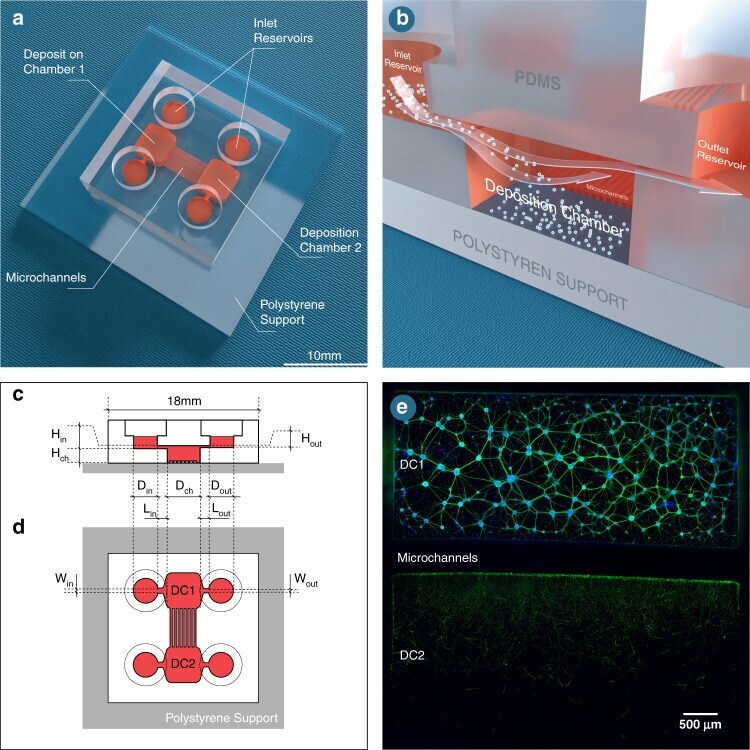
- Overview of connected deposition chambers. a Schematic representation of a dual deposition chamber connected with microchannels. b Schematic representation of the deposition chamber (DC) technology. Illustrations of the c side and d top views of the model indicating which dimensions of the structural components are used to calibrate the flow profile within the culture compartments. e Immunofluorescent pictures of 18 DIV embryonic rat hippocampal with anti-BIII-Tubulin (Green) and with DAPI (bleu), seeded in a 10 5 rectangular deposition chamber (DC1) connected via 450 mum long microchannels with another (DC2). Image was obtained using a x10 objective. The scale bar represents 500 um
- Submitted by
- Invitrogen Antibodies (provider)
- Main image
- Experimental details
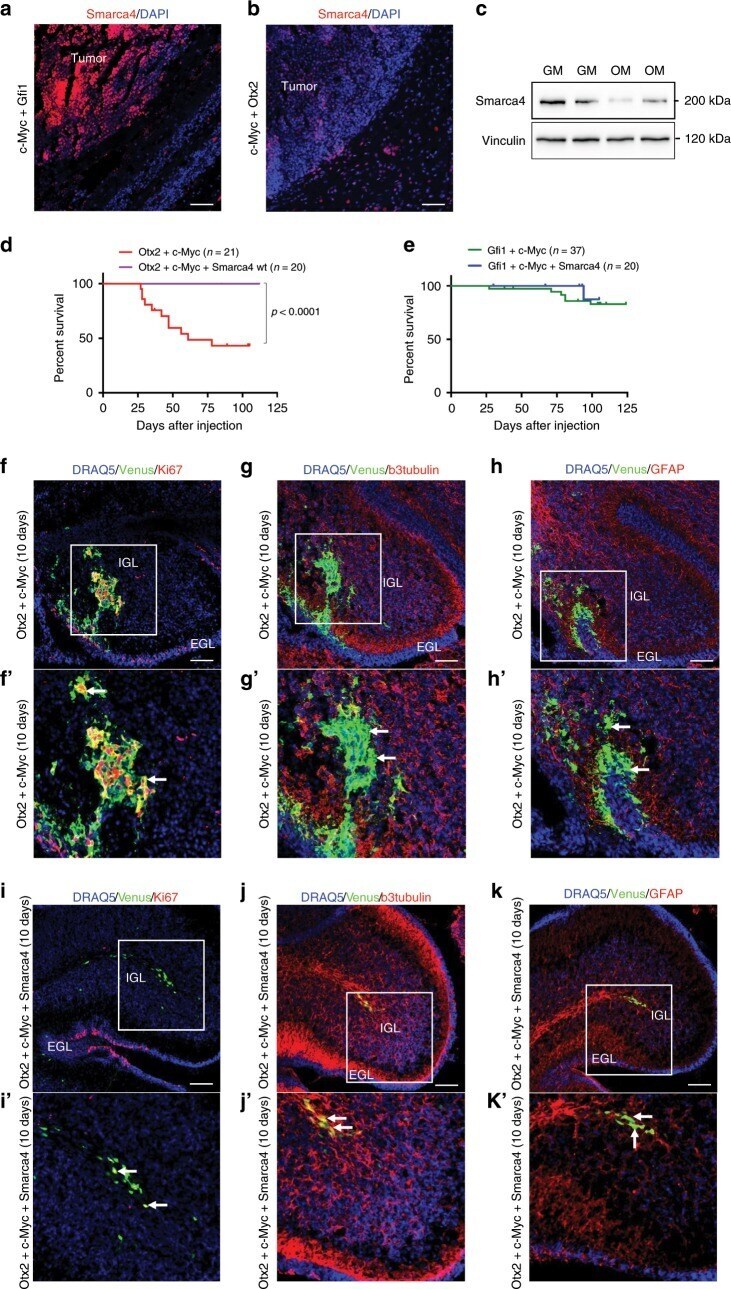
- Fig. 3 SMARCA4 represses Otx2 / c-MYC induced Group 3 medulloblastoma. a DAPI staining and Smarca4 immunofluorescence of sagittal brain tumor section of CD1 mouse 3 months after transfection with pPBase + pPBMyc + pPBGfi1 + pPBVenus at P0. b DAPI staining and Smarca4 immunofluorescence of sagittal brain tumor section of CD1 mouse 1 month after transfection with pPBase + pPBMyc + pPBOtx2 + pPBVenus at P0. c Western blot of brain tumors of CD1 mice after transfection with pPBase + pPBMyc + pPBGfi1 + pPBVenus (GM) and pPBase + pPBMyc + pPBOtx2 + pPBVenus (OM). d Kaplan-Meier survival curve of mice injected at P0 with Otx2 + c-Myc and Otx2 + c-Myc + Smarca4. e Kaplan-Meier survival curve of mice injected at P0 with Gfi1 + c-Myc and Gfi1 + c-Myc + Smarca4. f - h Confocal images of GFP (Venus) and Ki67 ( f ), beta3-tubulin ( g ), GFAP ( h ) immunofluorescence of transfected cell clusters in CD1 mouse 10 days after transfection with pPBase + pPBMyc + pPBOtx2 + pPBVenus at P0. The white squares in ( f , g , h ) mark the region shown at higher magnification in ( f ', g ', h '). i - k Confocal images of GFP (Venus) and Ki67 ( i ), beta3-tubulin ( j ), GFAP ( k ) immunofluorescence of transfected cell clusters in CD1 mouse 10 days after transfection with pPBase + pPBMyc + pPBOtx2 + pPBSmarca4 + pPBVenus at P0. The white squares in ( i , j , k ) mark the region shown at higher magnification in ( i ', j ', k '). Arrows point to double-positive cells. Scale bars 100 um.
- Submitted by
- Invitrogen Antibodies (provider)
- Main image
- Experimental details
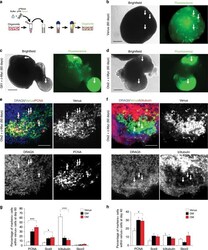
- Fig. 4 Cerebellar organoids electroporation with Gfi1 / c-MYC and Otx2 / c-MYC induces overproliferation. a Schematic representation of organoids electroporation. b Brightfield and fluorescence images of cerebellar organoids at day 60 electroporated at day 35 with pPBVenus. c Brightfield and fluorescence images of cerebellar organoids at day 60 electroporated at day 35 with pPBase + pPBMyc + pPBGfi1 + pPBVenus. d Brightfield and fluorescence images of cerebellar organoids at day 60 electroporated at day 35 with pPBase + pPBMyc + pPBOtx2 + pPBVenus. Arrows in ( b , c , d ) indicate Venus-positive cells. e Confocal images of GFP (Venus) and PCNA immunofluorescence of cerebellar organoids at day 60 electroporated at day 35 with pPBase + pPBVenus + pPBMyc and pPBOtx2. Arrows indicate double-positive cells. f Confocal images of GFP (Venus) and beta3-tubulin immunofluorescence of cerebellar organoids at day 60 electroporated at day 35 with pPBase + pPBMyc + pPBOtx2 + pPBVenus. Arrows indicate beta3-tubulin-negative cells. g Quantification of cerebellar organoids at day 60, electroporated at day 35 with either pPBVenus or pPBase + pPBMyc + pPBOtx2 + pPBVenus (OM) or pPBase + pPBMyc + pPBGfi1 + pPBVenus (GM). n = 6 biologically independent organoids. h Quantification of cerebellar organoids at day 40, electroporated at day 35 with either pPBVenus or pPBase + pPBMyc + pPBOtx2 + pPBVenus (OM) or pPBase + pPBMyc + pPBGfi1 + pPBVenus (GM). n = 6 biologically independent organoids. Error
