 Explore
 Validate
 Learn
Learn Western blot
 Immunocytochemistry
Antibody data
- Antibody Data
- Antigen structure
- References [1]
- Comments [0]
- Validations
- Immunocytochemistry [2]
- Immunohistochemistry [2]
- Other assay [4]
Submit
Validation data
Reference
Comment
Report error
- Product number
- PA5-34723 - Provider product page

- Provider
- Invitrogen Antibodies
- Product name
- C6orf97 Polyclonal Antibody
- Antibody type
- Polyclonal
- Antigen
- Recombinant full-length protein
- Description
- Recommended positive controls: A549. IHC notes, Requires antigen retrieval using heat mediated 10mM Citrate buffer (pH6.0) or Tris-EDTA buffer (pH8.0) Store product as a concentrated solution. Centrifuge briefly prior to opening the vial.
- Reactivity
- Human
- Host
- Rabbit
- Isotype
- IgG
- Vial size
- 100 μL
- Concentration
- 1 mg/mL
- Storage
- Store at 4°C short term. For long term storage, store at -20°C, avoiding freeze/thaw cycles.
Submitted references CCDC170 affects breast cancer apoptosis through IRE1 pathway.
Wang Q, Zhao Y, Zheng H, Wang Q, Wang W, Liu B, Han H, Zhang L, Chen K
Aging 2020 Dec 3;13(1):1332-1356
Aging 2020 Dec 3;13(1):1332-1356
No comments: Submit comment
Supportive validation
- Submitted by
- Invitrogen Antibodies (provider)
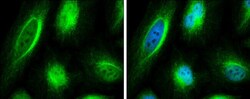
- Main image

- Experimental details
- Immunocytochemistry-Immunofluorescence analysis of C6orf97 was performed in HeLa cells fixed in 4% paraformaldehyde at RT for 15 min. Green: C6orf97 Polyclonal Antibody (Product # PA5-34723) diluted at 1:200. Blue: Hoechst 33342 staining.

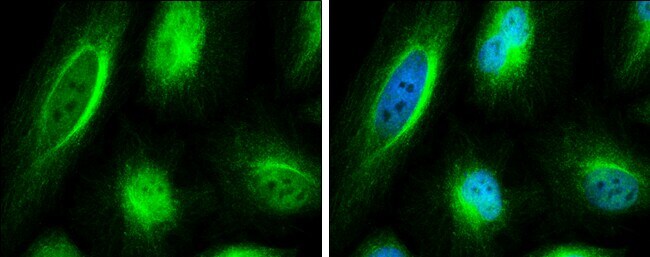
- Submitted by
- Invitrogen Antibodies (provider)
- Main image
- Experimental details
- Immunocytochemistry-Immunofluorescence analysis of C6orf97 was performed in HeLa cells fixed in 4% paraformaldehyde at RT for 15 min. Green: C6orf97 Polyclonal Antibody (Product # PA5-34723) diluted at 1:200. Blue: Hoechst 33342 staining.
Supportive validation
- Submitted by
- Invitrogen Antibodies (provider)
- Main image
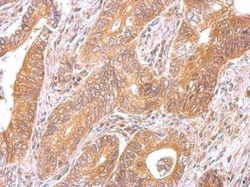
- Experimental details
- C6orf97 Polyclonal Antibody detects C6orf97 protein at cytosol on human gastric cancer by immunohistochemical analysis. Sample: Paraffin-embedded gastric cancer. C6orf97 Polyclonal Antibody (Product # PA5-34723) dilution: 1:500. Antigen Retrieval: EDTA based buffer, pH 8.0, 15 min.

- Submitted by
- Invitrogen Antibodies (provider)
- Main image
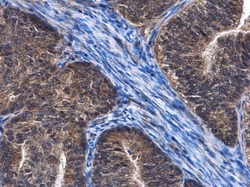
- Experimental details
- Immunohistochemistry (Paraffin) analysis of C6orf97 was performed in paraffin-embedded human endometrial cancer tissue using C6orf97 Polyclonal Antibody (Product # PA5-34723) at a dilution of 1:500.

Supportive validation
- Submitted by
- Invitrogen Antibodies (provider)
- Main image
- Experimental details
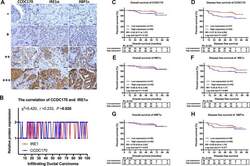
- Figure 2 IHC stain and the prognosis value of CCDC170, IRE1alpha and XBP1s in breast cancer tissues. ( A ) Representative IHC staining of CCDC170, IRE1alpha and XBP1s. Scale bar: 50mum. ( B ) The correlation between CCDC170 and IRE1alpha levels in breast cancer tissues (r = 0.233, P = 0.020). 1, 2 represented low expression (0-2 staining index) and high expression (3-12 staining index) respectively. n = 100 cases. ( C, D ) The CCDC170 high-expression group exhibited better DFS ( P = 0.037), but no significance in OS ( P = 0.183). ( E, F ) The expression of IRE1alpha showed no significance in OS ( P = 0.530) and DFS ( P = 0.094). ( G, H ) The expression of XBP1s showed no significance in OS ( P = 0.678) and DFS ( P = 0.377).

- Submitted by
- Invitrogen Antibodies (provider)
- Main image
- Experimental details
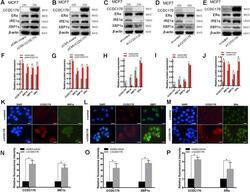
- Figure 3 The protein expression of CCDC170, IRE1alpha and XBP1s in MCF7 breast cancer cells. Representative western blot bands and analysis at 24h ( A, F ) and 48h ( B, G ) of CCDC170 up-regulation, 24h ( C, H ) and 48h ( D, I ) of CCDC170 down-regulation. Representative western blot bands ( E ) and analysis ( J ) in MCF7 breast cancer cells that stably overexpressed CCDC170. beta -actin was used as a reference for calculating the relative protein expression. Representative immunofluorescence images and analysis of IRE1alpha ( K, N ), XBP1s ( L, O ) and ERalpha ( M , P ) in CCDC170-stably-overexpressing MCF7 cells. Scale bar: 50mum. pCMV-CCDC170(control) represented CCDC170-transiently-overexpressing MCF7 cells and controls. v-CCDC170(control) represented CCDC170-stably-overexpressing MCF7 cells and controls. si-CCDC170(control) represented cells with siRNA-mediated knockdown of CCDC170 and the controls. The error bars presented as mean +- Standard Error of Mean (SEM) with analysis of unpaired Student's t-test. * P < 0.05, compared with control group.
- Submitted by
- Invitrogen Antibodies (provider)
- Main image
- Experimental details
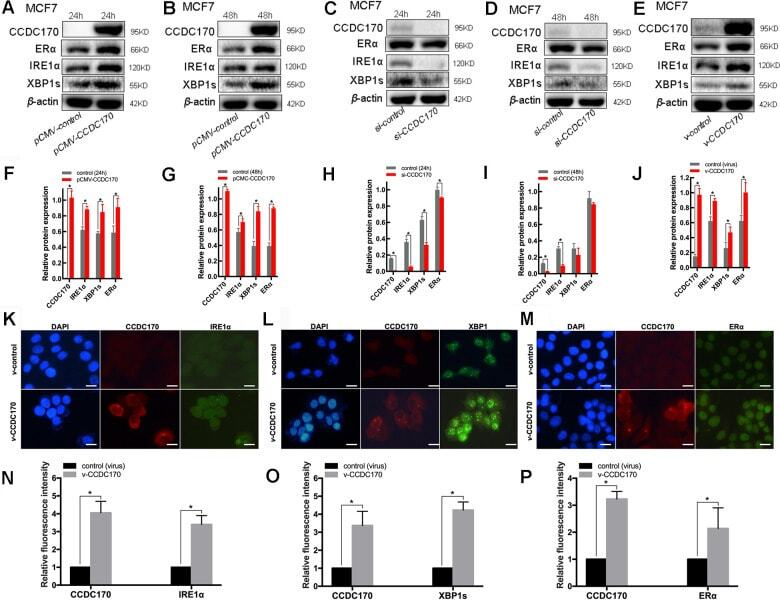
- Figure 4 CCDC170 promoted cell apoptosis in MCF7 breast cancer cells. ( A, C ) Representative images of flow cytometry (FCM) using Annexin V-FITC and PI staining. Column bar graph showing a dramatically bigger early and late apoptosis ratio in CCDC170-transiently-overexpressing MCF7 cells than the control cells ( B ). The cell apoptosis ratio was significantly lower in the cells with CCDC170 knockdown compared with the control cells ( D ). Each group was independently repeated three times, 3000 cells were calculated. ( E ) Representative images were taken with nuclear stain DAPI (blue) and apoptosis stain TUNEL (green). ( F ) The result depicts the percentage of TUNEL positive nuclei of MCF-7 cells after CCDC170 upregulation. Scale bar, 50 mum. ( G, I ) Representative western blot bands of Caspase12 in MCF7 cells with CCDC170 up-regulated transiently ( H ) and stably ( J ). pCMV-CCDC170(control) represented CCDC170-transiently-overexpressing MCF7 cells and controls. v-CCDC170(control) represented CCDC170-stably-overexpressing MCF7 cells and controls. beta-actin was used as a reference for calculating the relative protein expression. The error bars presented as mean +- Standard Error of Mean (SEM) with analysis of unpaired Student's t-test. * P < 0.05, compared with control group.

- Submitted by
- Invitrogen Antibodies (provider)
- Main image

- Experimental details
- Figure 5 CCDC170 promoted cell apoptosis under ER stress. ( A ) IF showed that protein localization of CCDC70 overlapped Calnexin partially. Scale bar: 50mum. ( B, D ) Representative western blot bands of Cleaved PARP, Caspase7, Bcl-2 in MCF7 cells when CCDC170 up-regulated transiently ( C ) and stably ( E ) under TG treatment. pCMV-CCDC170(control) represented CCDC170-transiently-overexpressing MCF7 cells and controls. v-CCDC170(control) represented CCDC170-stably-overexpressing MCF7 cells and controls. beta -actin was used as a reference for calculating the relative protein expression. TG: Thapsigargin (300 nm). ( F ) Representative images of flow cytometry using Annexin V-FITC and PI staining, ( G ) Column bar graph showing an increased proportion of early and late apoptotic cells after CCDC170 overexpression in MCF7 cells treated with TG. 3000 cells were calculated. ( H ) Representative images of flow cytometry using Annexin V-FITC and PI staining, ( I ) Column bar graph showing a decreased proportion of early and late apoptotic cells after IRE1 knockdown in MCF7 cells with CCDC170 overexpression. 3000 cells were calculated. CCDC170 OE : MCF7 cells that transiently overexpressed CCDC170. Detection of cell viability via MTT assay. Transient ( J ) or stable ( K ) overexpression CCDC170, the growth of the cell was suppressed in MCF7 breast cancer cells. ( L ) The cell viability of CCDC170-stably-overexpressing MCF7 cells was significantly lower than that of control cells tre
