Explore
 Validate
 Learn
Learn Immunohistochemistry
Antibody data
- Antibody Data
- Antigen structure
- References [1]
- Comments [0]
- Validations
- Immunohistochemistry [1]
- Other assay [1]
Submit
Validation data
Reference
Comment
Report error
- Product number
- PA5-60719 - Provider product page

- Provider
- Invitrogen Antibodies
- Product name
- TMEM62 Polyclonal Antibody
- Antibody type
- Polyclonal
- Antigen
- Recombinant protein fragment
- Description
- Immunogen sequence: DAKTKEQLGS RQHEVEWQTY QGILKKTRVM EKTKWLDIKG NHDAFNIPSL DSIKNYYRKY SAVRRDGSFH YVHSTPFGNY SFICVDATVN PGPKRPYNFF GILDKKKMEE LLLLAKESSR SNHTIWFGHF TTSTILSPSP GIRS Highest antigen sequence identity to the following orthologs: Mouse - 84%, Rat - 85%.
- Reactivity
- Human
- Host
- Rabbit
- Isotype
- IgG
- Vial size
- 100 μL
- Concentration
- 0.05 mg/mL
- Storage
- Store at 4°C short term. For long term storage, store at -20°C, avoiding freeze/thaw cycles.
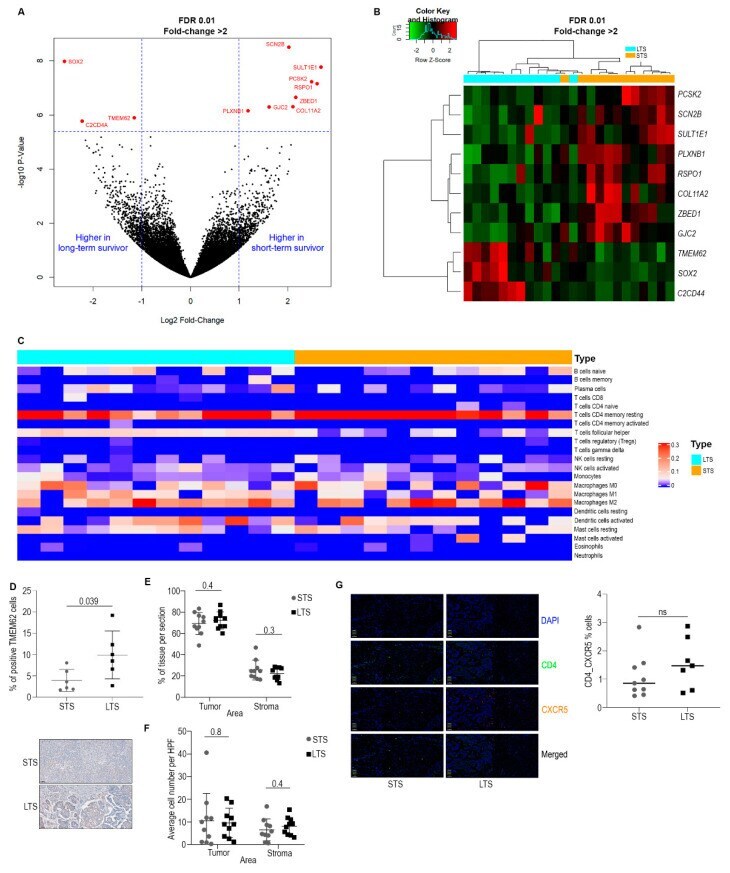
Submitted references Molecular Analysis of Short- versus Long-Term Survivors of High-Grade Serous Ovarian Carcinoma.
Stur E, Bayraktar E, Dal Molin GZ, Wu SY, Mangala LS, Yao H, Wang Y, Ram PT, Corvigno S, Chen H, Liang H, Tworoger SS, Levine DA, Lutgendorf SK, Liu J, Moore KN, Baggerly KA, Karlan BY, Sood AK
Cancers 2022 Aug 30;14(17)
Cancers 2022 Aug 30;14(17)
No comments: Submit comment
Supportive validation
- Submitted by
- Invitrogen Antibodies (provider)
- Main image
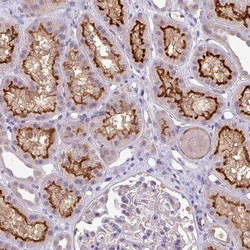
- Experimental details
- Immunohistochemical analysis of TMEM62 in human kidney using TMEM62 Polyclonal Antibody (Product # PA5-60719) shows strong membranous positivity in cells in tubules.
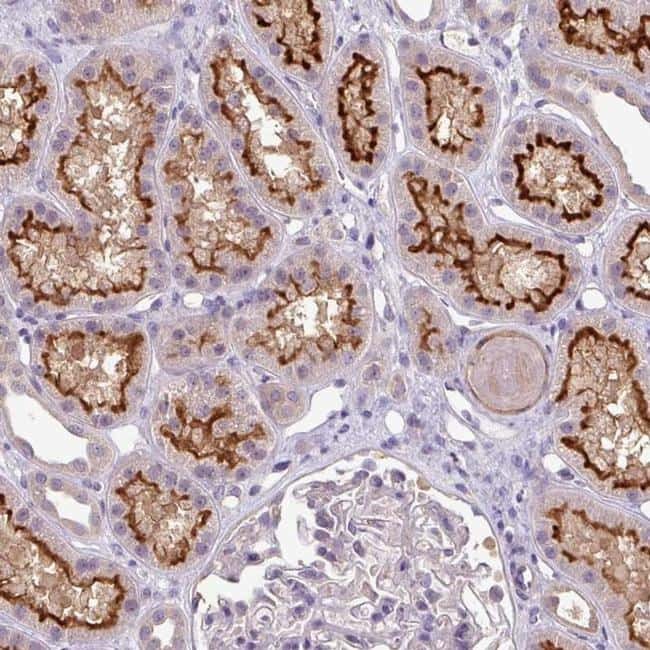
Supportive validation
- Submitted by
- Invitrogen Antibodies (provider)
- Main image

- Experimental details
- Molecular analysis of high-grade serous ovarian carcinoma (HGSC) samples from patients with long-term survival (LTS) or short-term survival (STS). ( A ) Volcano plot from RNASeq data showing the genes with highest expression in both groups. ( B ) Heat map showing the expression levels of genes highly expressed in LTS. ( C ) CIBERSORT analysis from patients with LTS or STS. ( D ) IHC validation of higher expression of TMEM62 in the LTS group. Top: IHC quantification using Visiopharm. Bottom: Representative images of LTS and STS groups stained with TMEM62 antibody. Scale: 50 um ( E ) Percentages of tissue area (tumor and stroma). ( F ) Number of infiltrating CD8 cells per tissue area. ( G ) Percentage of positive T FH per group. Right: OPAL staining using CD4 and CXCR5 antibodies. Left: Percentage of positive double stained cells in the whole tissue area.