Explore
 Validate
 Learn
Learn Immunohistochemistry
Antibody data
- Antibody Data
- Antigen structure
- References [2]
- Comments [0]
- Validations
- Immunohistochemistry [5]
- Other assay [1]
Submit
Validation data
Reference
Comment
Report error
- Product number
- PA5-62505 - Provider product page

- Provider
- Invitrogen Antibodies
- Product name
- TMEM119 Polyclonal Antibody
- Antibody type
- Polyclonal
- Antigen
- Recombinant protein fragment
- Description
- Immunogen sequence: GDGARMVEGR GAEEEEKGSQ EGDQEVQGHG VPVETPEAQE EPCSGVLEGA VVAGEGQGEL EGSLLLAQEA QGPVGPPESP CACSSVHPS Highest antigen sequence identity to the following orthologs: Mouse - 52%, Rat - 46%.
- Reactivity
- Human
- Host
- Rabbit
- Isotype
- IgG
- Vial size
- 100 μL
- Concentration
- 0.10 mg/mL
- Storage
- Store at 4°C short term. For long term storage, store at -20°C, avoiding freeze/thaw cycles.
Submitted references Detection and Functional Evaluation of the P2X7 Receptor in hiPSC Derived Neurons and Microglia-Like Cells.
Age-related changes in brain phospholipids and bioactive lipids in the APP knock-in mouse model of Alzheimer's disease.
Francistiová L, Vörös K, Lovász Z, Dinnyés A, Kobolák J
Frontiers in molecular neuroscience 2021;14:793769
Frontiers in molecular neuroscience 2021;14:793769
Age-related changes in brain phospholipids and bioactive lipids in the APP knock-in mouse model of Alzheimer's disease.
Emre C, Do KV, Jun B, Hjorth E, Alcalde SG, Kautzmann MI, Gordon WC, Nilsson P, Bazan NG, Schultzberg M
Acta neuropathologica communications 2021 Jun 29;9(1):116
Acta neuropathologica communications 2021 Jun 29;9(1):116
No comments: Submit comment
Supportive validation
- Submitted by
- Invitrogen Antibodies (provider)
- Main image
- Experimental details
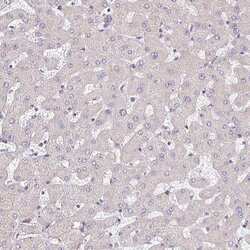
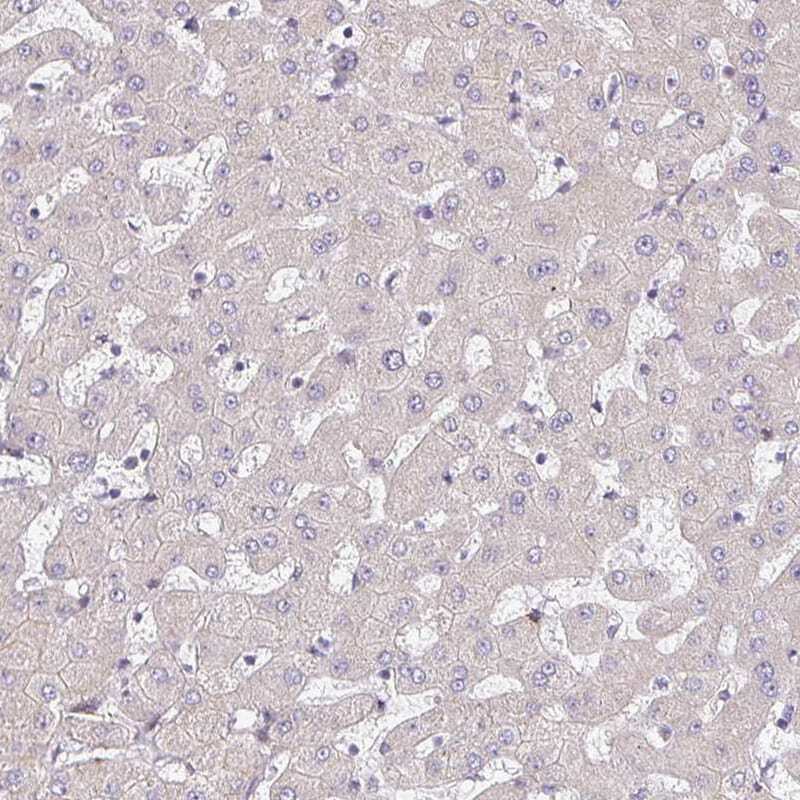
- Immunohistochemical staining of TM119 in human liver using a TM119 Polyclonal Antibody (Product # PA5-62505) shows no positivity in hepatocytes as expected.
- Submitted by
- Invitrogen Antibodies (provider)
- Main image
- Experimental details
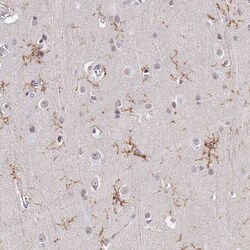
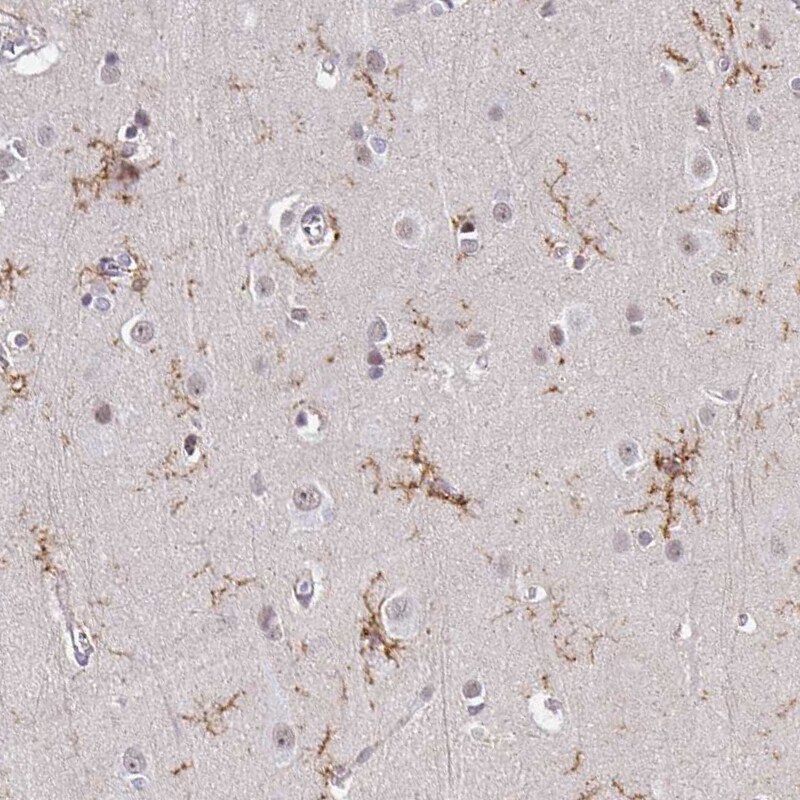
- Immunohistochemical staining of TM119 in human cerebral cortex using a TM119 Polyclonal Antibody (Product # PA5-62505) shows moderate to strong membranous positivity in microglia.
- Submitted by
- Invitrogen Antibodies (provider)
- Main image
- Experimental details
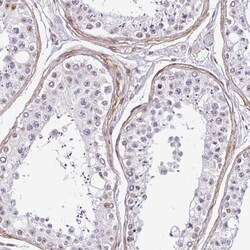
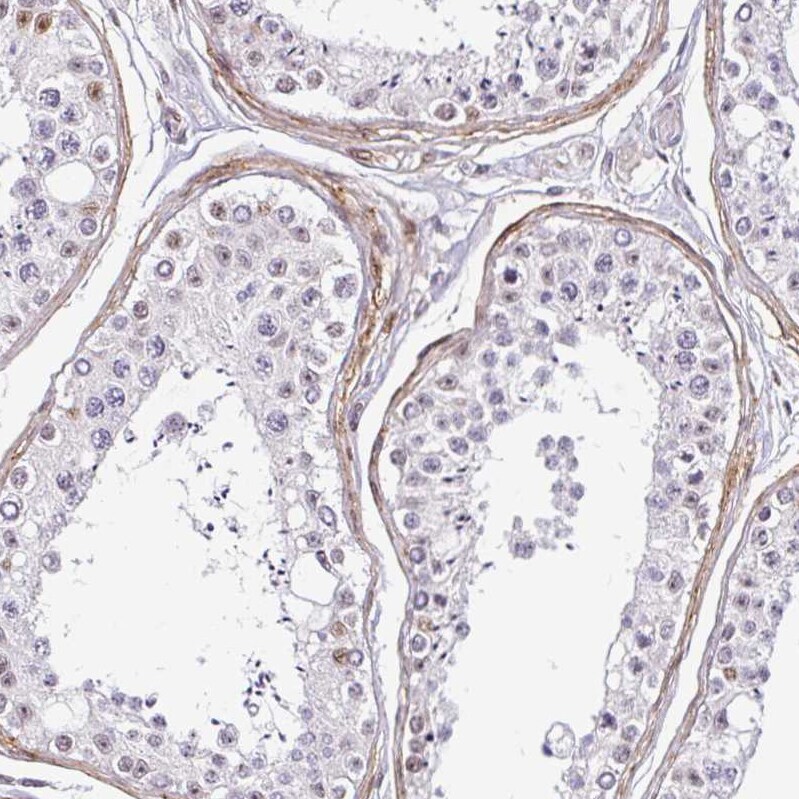
- Immunohistochemical staining of TM119 in human testis using TM119 Polyclonal Antibody (Product # PA5-62505) shows moderate cytoplasmic positivity in peritubular myoid cells.
- Submitted by
- Invitrogen Antibodies (provider)
- Main image
- Experimental details
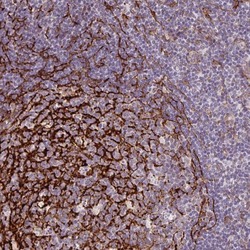
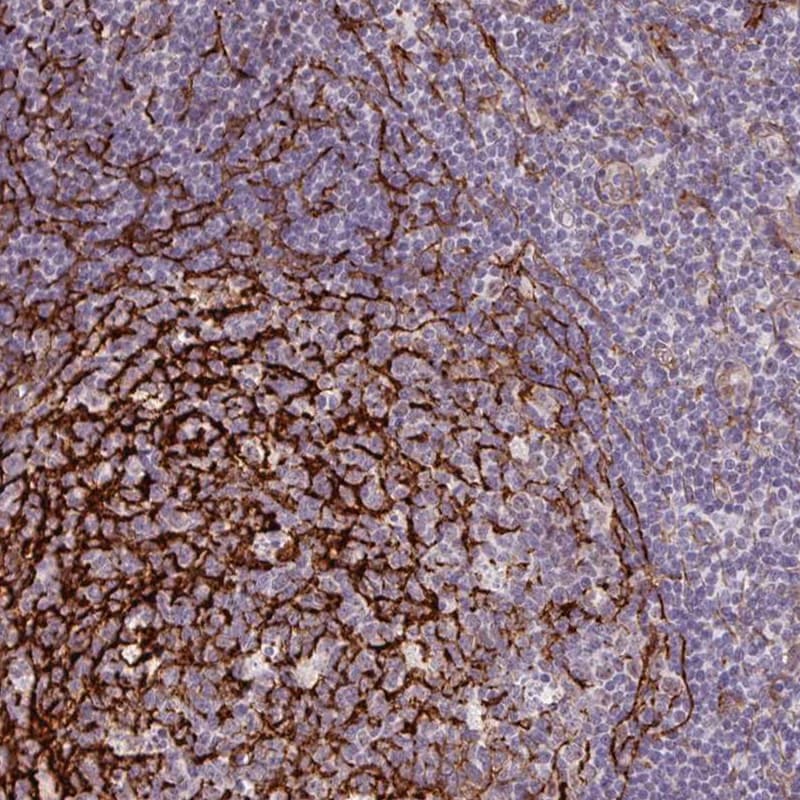
- Immunohistochemical staining of TM119 in human tonsil using a TM119 Polyclonal Antibody (Product # PA5-62505) shows strong positivity in reticular fibers in germinal center.
- Submitted by
- Invitrogen Antibodies (provider)
- Main image
- Experimental details
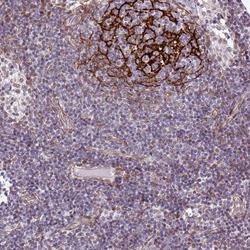
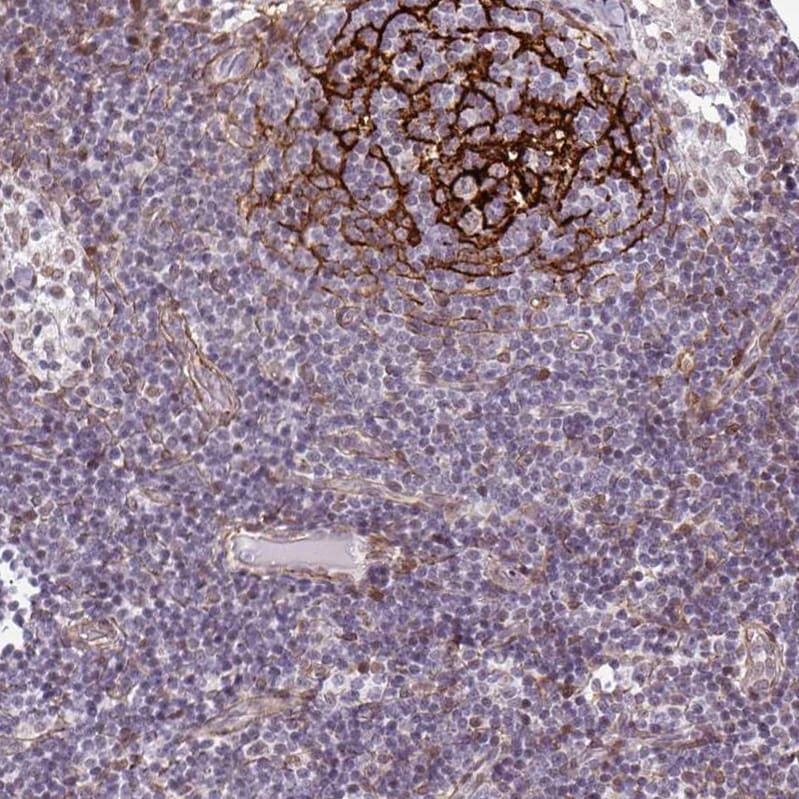
- Immunohistochemical staining of TM119 in human lymph node strong positivity in reticular fibers in germinal center cells. using TM119 Polyclonal Antibody (Product # PA5-62505).
Supportive validation
- Submitted by
- Invitrogen Antibodies (provider)
- Main image

- Experimental details
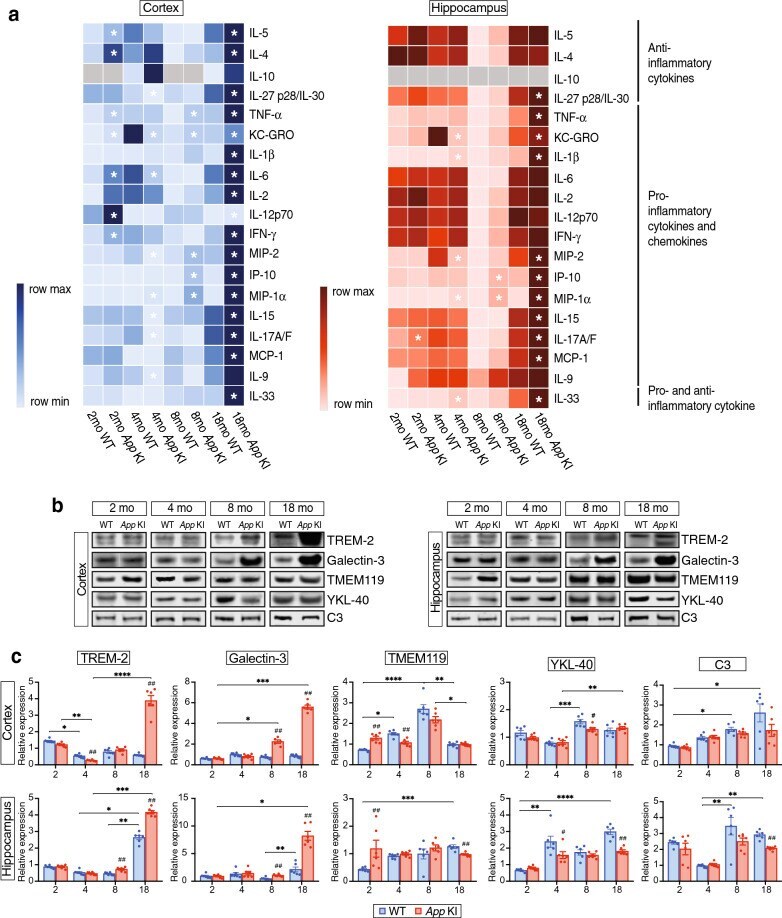
- Fig. 6 App KI mice show most marked changes in inflammatory factors at 18 months of age. a Cytokines and chemokines were analyzed in homogenates of cerebral cortex and hippocampus by Meso scale v-plex assay. Rows in the heat map represent cytokines/chemokines and the columns represent different ages of WT and App KI mice. The colours represent mean of normalized concentration values (light blue and light red are low and dark blue and dark red are high). Grey colour represents undetected values. Sample size in each group was 5-6. Asterisks denote statistical significance between WT and App KI mice, where P < 0.05 using Mann-Whitney U test. b Western blot analysis of TREM-2, Gal-3, TMEM119, YKL-40 and C3 in cortex and hippocampus of 2-, 4-, 8- and 18-months-old mice (n = 6/group). c Densitometric analysis of bands after normalization with total protein and internal control. Intergroup comparisons were performed with Mann-Whitney U test ( # P < 0.05, ## P < 0.01, ### P < 0.001). Multiple comparisons were performed with Kruskal-Wallis one-way analysis of variance test and Dunn's post hoc test (* P < 0.05, ** P < 0.01, *** P < 0.001, **** P < 0.0001). TREM-2 = triggering receptor expressed on myeloid cells 2, Gal-3 = galectin-3, TMEM119 = transmembrane protein 119, YKL-40 = chitinase-3-like protein 1, C3 = complement component 3