Explore
 Validate
 Learn
Learn Western blot
 Immunocytochemistry
Antibody data
- Antibody Data
- Antigen structure
- References [1]
- Comments [0]
- Validations
- Immunocytochemistry [2]
- Immunohistochemistry [4]
- Flow cytometry [1]
- Other assay [3]
Submit
Validation data
Reference
Comment
Report error
- Product number
- PA5-78811 - Provider product page

- Provider
- Invitrogen Antibodies
- Product name
- Aquaporin 3 Polyclonal Antibody
- Antibody type
- Polyclonal
- Antigen
- Synthetic peptide
- Description
- Reconstitute with 0.2 mL of distilled water to yield a concentration of 500 µg/mL. Positive Control - WB: human Hela whole cell, rat kidney tissue, mouse kidney tissue. IHC: mouse kidney tissue, rat kidney tissue, human bladder cancer tissue. ICC/IF: A431 cell. Flow: RT4 cell.
- Reactivity
- Human, Mouse, Rat
- Host
- Rabbit
- Isotype
- IgG
- Vial size
- 100 μg
- Concentration
- 500 μg/mL
- Storage
- -20°C
Submitted references Unsaturated fatty acid-enriched extract from Hippophae rhamnoides seed reduces skin dryness through up-regulating aquaporins 3 and hyaluronan synthetases 2 expressions.
Yao Q, Jia T, Qiao W, Gu H, Kaku K
Journal of cosmetic dermatology 2021 Jan;20(1):321-329
Journal of cosmetic dermatology 2021 Jan;20(1):321-329
No comments: Submit comment
Supportive validation
- Submitted by
- Invitrogen Antibodies (provider)
- Main image
- Experimental details
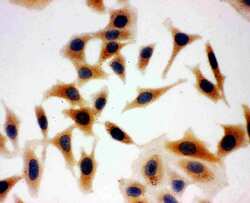
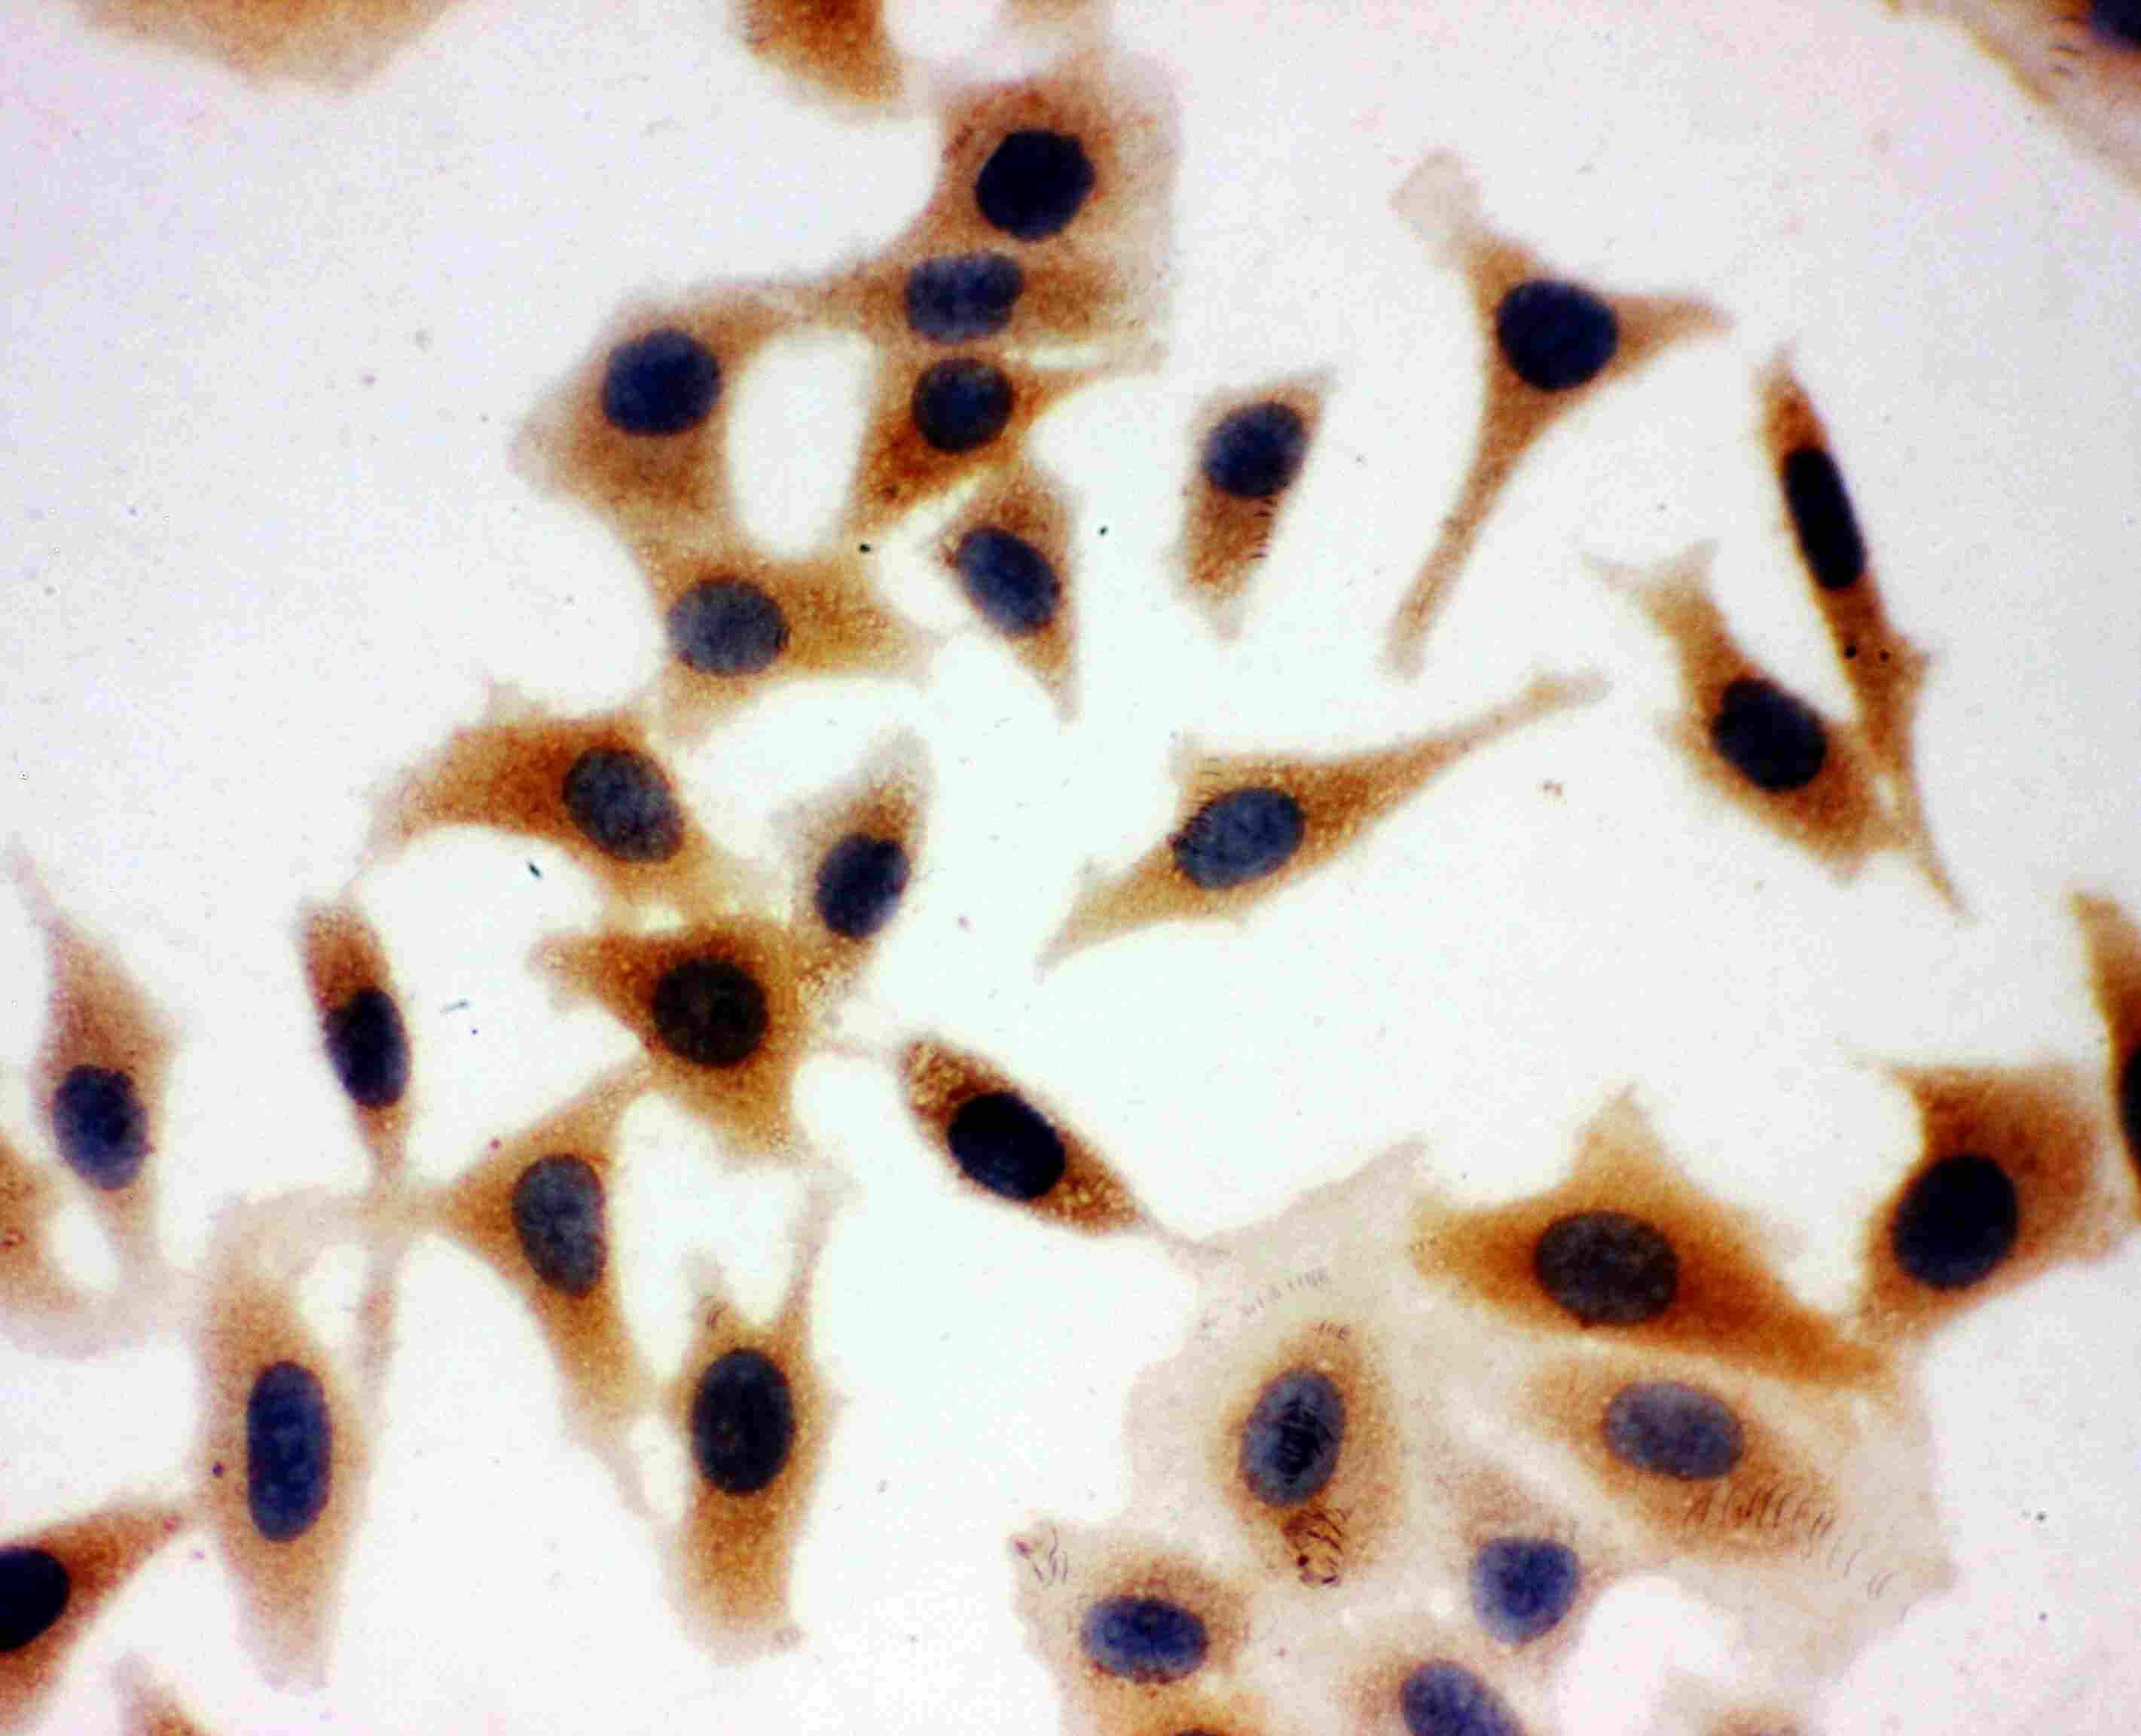
- Immunocytochemistry analysis of Aquaporin 3 on HeLa cells. Antigen retrieval was performed using citrate buffer (pH6, epitope retrieval solution) for 20 mins. Sample was blocked using 10% goat serum, incubated with Aquaporin 3 polyclonal antibody (Product# PA5-78811) with a dilution of 1 µg/mL (overnight at 4°C). Development was performed using Streptavidin-Biotin-Complex (SABC) with DAB chromogen method.
- Submitted by
- Invitrogen Antibodies (provider)
- Main image
- Experimental details
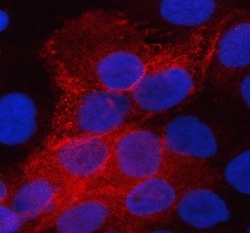
- Immunocytochemistry/Immunofluorescence analysis of Aquaporin 3 in A431 cells using Aquaporin 3 Polyclonal Antibody (Product # PA5-78811). Enzyme antigen retrieval was performed using IHC enzyme antigen retrieval reagent for 15 mins. The cells were blocked with 10% goat serum and incubated with the primary antibody at 5 µg/mL. Cy3 conjugated goat anti-rabbit IgG was used as secondary antibody at 1:500 dilution and incubated for 30 minutes at 37°C. The section was counterstained with DAPI. Visualize using a fluorescence microscope and filter sets appropriate for the label used.

Supportive validation
- Submitted by
- Invitrogen Antibodies (provider)
- Main image
- Experimental details
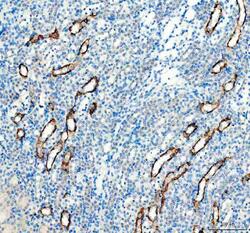
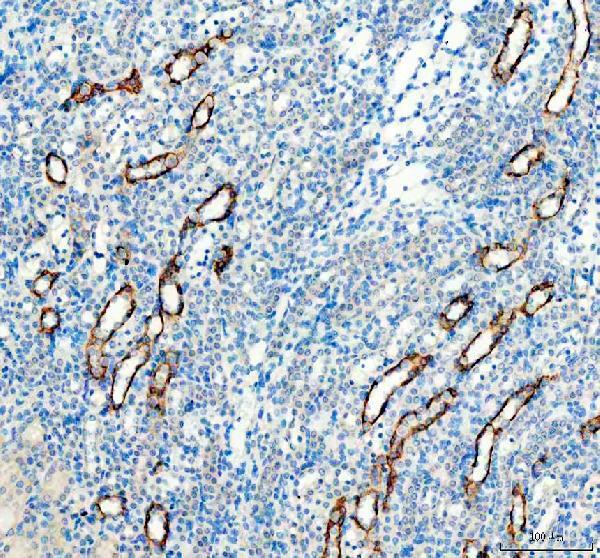
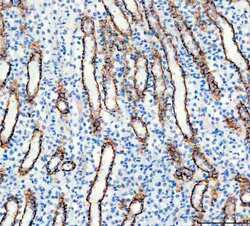
- Immunohistochemistry (Paraffin) analysis of Aquaporin 3 in paraffin-embedded section of mouse kidney tissue using Aquaporin 3 Polyclonal Antibody (Product # PA5-78811). Heat mediated antigen retrieval was performed in EDTA buffer (pH 8.0, epitope retrieval solution). The tissue section was blocked with 10% goat serum. The tissue section was then incubated with the primary antibody at a 2 µg/mL dilution overnight at 4°C. Peroxidase conjugated goat anti-rabbit IgG was used as secondary antibody and incubated for 30 minutes at 37°C. The tissue section was developed using HRP Conjugated Rabbit IgG Super Vision Assay Kit with DAB as the chromogen.
- Submitted by
- Invitrogen Antibodies (provider)
- Main image
- Experimental details
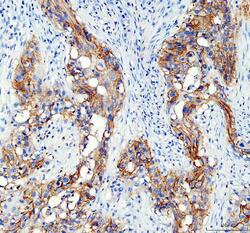
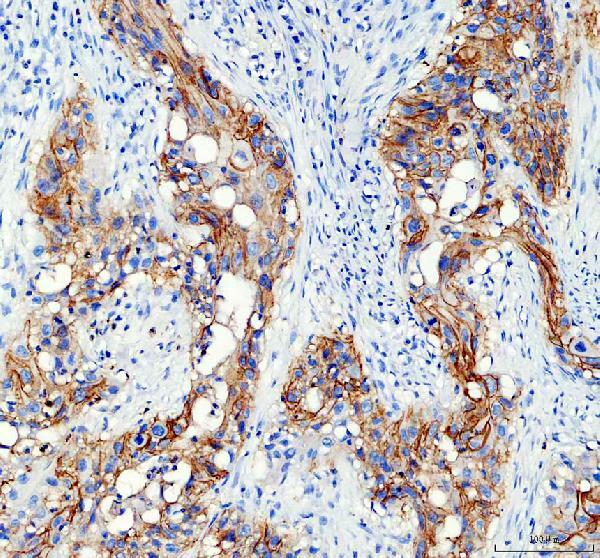
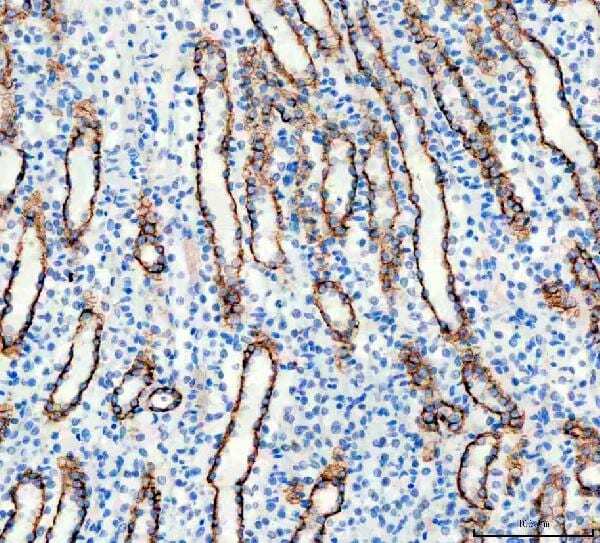
- Immunohistochemistry (Paraffin) analysis of Aquaporin 3 in paraffin-embedded section of human bladder cancer tissue using Aquaporin 3 Polyclonal Antibody (Product # PA5-78811). Heat mediated antigen retrieval was performed in EDTA buffer (pH 8.0, epitope retrieval solution). The tissue section was blocked with 10% goat serum. The tissue section was then incubated with the primary antibody at a 2 µg/mL dilution overnight at 4°C. Peroxidase conjugated goat anti-rabbit IgG was used as secondary antibody and incubated for 30 minutes at 37°C. The tissue section was developed using HRP Conjugated Rabbit IgG Super Vision Assay Kit with DAB as the chromogen.
- Submitted by
- Invitrogen Antibodies (provider)
- Main image
- Experimental details
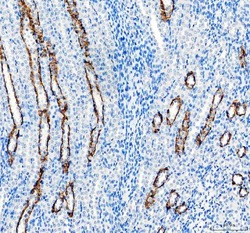
- Immunohistochemistry (Paraffin) analysis of Aquaporin 3 in paraffin-embedded section of rat kidney tissue using Aquaporin 3 Polyclonal Antibody (Product # PA5-78811). Heat mediated antigen retrieval was performed in EDTA buffer (pH 8.0, epitope retrieval solution). The tissue section was blocked with 10% goat serum. The tissue section was then incubated with the primary antibody at a 2 µg/mL dilution overnight at 4°C. Peroxidase conjugated goat anti-rabbit IgG was used as secondary antibody and incubated for 30 minutes at 37°C. The tissue section was developed using HRP Conjugated Rabbit IgG Super Vision Assay Kit with DAB as the chromogen.
- Submitted by
- Invitrogen Antibodies (provider)
- Main image
- Experimental details
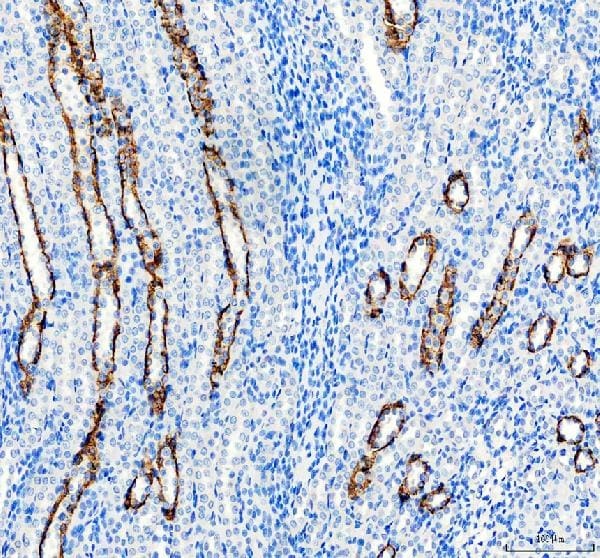
- Immunohistochemistry (Paraffin) analysis of Aquaporin 3 in paraffin-embedded section of rat kidney tissue using Aquaporin 3 Polyclonal Antibody (Product # PA5-78811). Heat mediated antigen retrieval was performed in EDTA buffer (pH 8.0, epitope retrieval solution). The tissue section was blocked with 10% goat serum. The tissue section was then incubated with the primary antibody at a 2 µg/mL dilution overnight at 4°C. Peroxidase conjugated goat anti-rabbit IgG was used as secondary antibody and incubated for 30 minutes at 37°C. The tissue section was developed using HRP Conjugated Rabbit IgG Super Vision Assay Kit with DAB as the chromogen.
Supportive validation
- Submitted by
- Invitrogen Antibodies (provider)
- Main image
- Experimental details
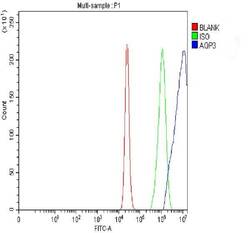
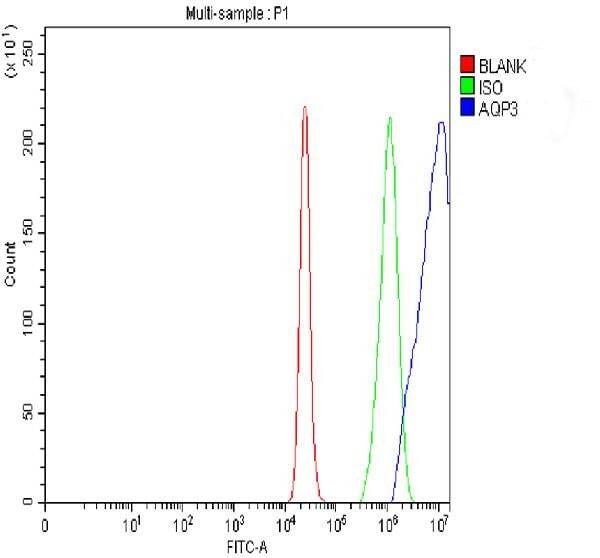
- Flow cytometry analysis of Aquaporin 3 in RT4 cells using Aquaporin 3 Polyclonal Antibody (Product # PA5-78811), shown in overlay histogram (blue line). The cells were fixed with 4% paraformaldehyde and blocked with 10% normal goat serum, and incubated with the primary antibody (1 μg/1x10^6 cells) for 30 min at 20°C. DyLight 488 conjugated goat anti-rabbit IgG (5-10 µg/1x10^6 cells) was used as secondary antibody for 30 minutes at 20°C. Isotype control antibody (Green line) was rabbit IgG (1 µg/1x10^6) used under the same conditions. Unlabelled sample without incubation with primary antibody and secondary antibody (Red line) was used as a blank control.
Supportive validation
- Submitted by
- Invitrogen Antibodies (provider)
- Main image
- Experimental details
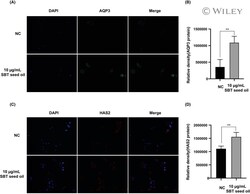
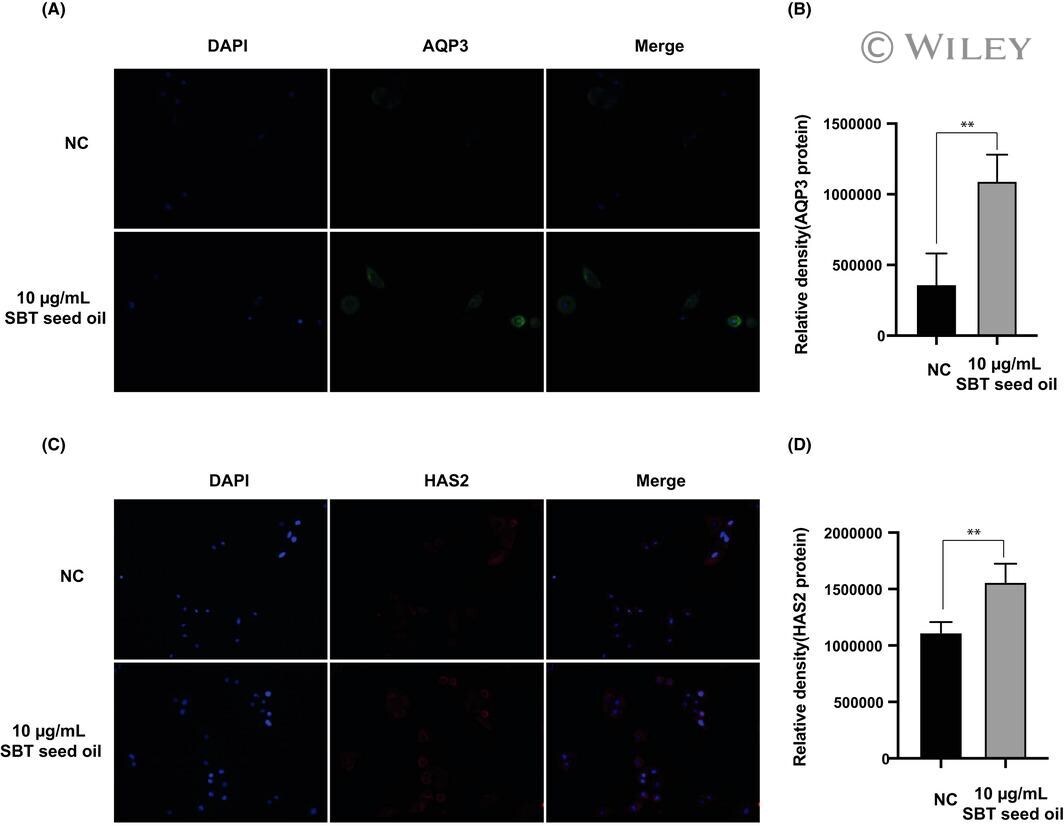
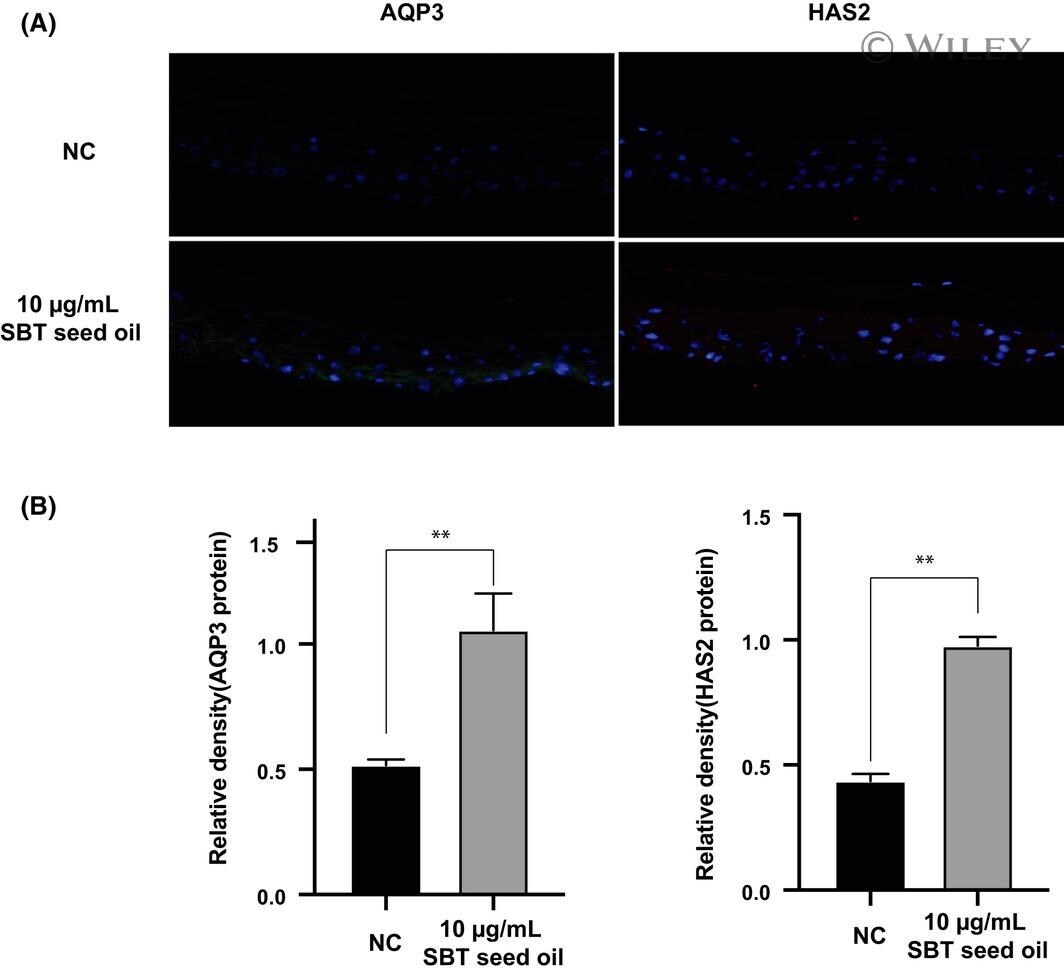
- 3 Figure SBT seed oil treatment evidently up-regulated AQP3 and HAS2 protein expressions based on result of IF. A, Immunohistofluorescence analysis was executed for AQP3 in NHEK cells. B, Relative optical densities of AQP3. C, IF analysis was executed to HAS2 in NHEK cells. D, Relative optical densities of HAS2. Magnification 20x, data are expressed as mean +- standard deviation (SD). Compared with the negative control, ** represents P < .01. HAS2, Hyaluronic acid synthase 2. Green represents AQP3 protein, red represents HAS2 protein, and blue represents DAPI stained cell nucleus
- Submitted by
- Invitrogen Antibodies (provider)
- Main image
- Experimental details
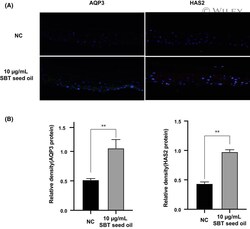
- 5 Figure Treating with SBT seed oil remarkably enhanced AQP3 and HAS2 protein expressions in reconstructed skin model compared with NC. A, IF analysis was used to investigate protein level of AQP3 and HAS2, in reconstructed skin model. Green represents AQP3 protein, red represents HAS2 protein, and blue represents DAPI stained cell nucleus. B, Relative optical densities of AQP3 and HAS2. Magnification 20x, data are expressed as mean +- standard deviation (SD). Compared with the negative control, * represents P < .01
- Submitted by
- Invitrogen Antibodies (provider)
- Main image
- Experimental details
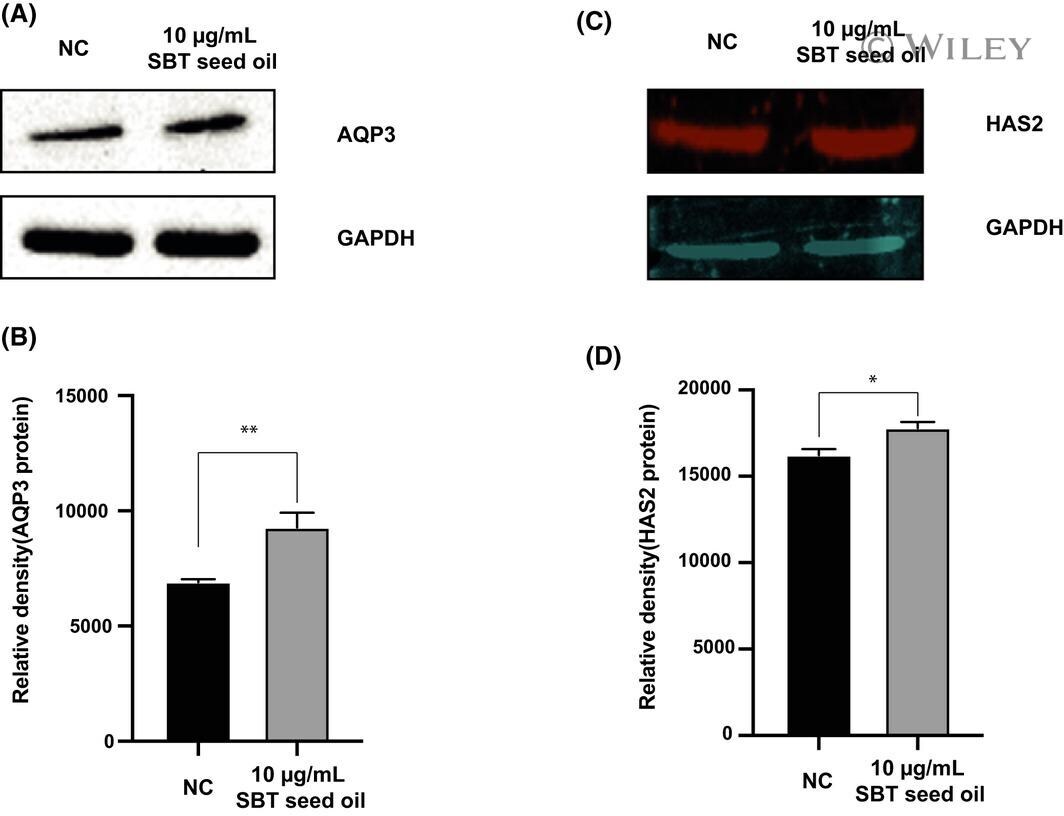
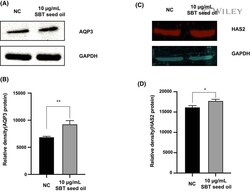
- 4 Figure SBT seed oil treatment evidently up-regulated AQP3 and HAS2 protein expressions based on result of Western blot. A, Western blot analysis was used to investigate protein level of AQP3 in NHEK cells. B, Relative optical densities of AQP3. C, Western blot analysis was used to investigate protein level of HAS2 in NHEK cells. D, Relative optical densities of HAS2. Data are expressed as mean +- standard deviation (SD). Compared with the negative control, * represents P < .05, ** represents P < .01