Explore
 Validate
 Learn
LearnMA5-15493
antibody from Invitrogen Antibodies
Targeting: APOO
FAM121B, MGC4825, Mic23, MIC26, MICOS26, My025
 Western blot
 ELISA
ELISA Immunohistochemistry
Antibody data
- Antibody Data
- Antigen structure
- References [4]
- Comments [0]
- Validations
- Immunohistochemistry [1]
- Other assay [5]
Submit
Validation data
Reference
Comment
Report error
- Product number
- MA5-15493 - Provider product page

- Provider
- Invitrogen Antibodies
- Product name
- Apolipoprotein O Monoclonal Antibody (2F1)
- Antibody type
- Monoclonal
- Antigen
- Purifed from natural sources
- Description
- MA5-15493 targets ApoO in indirect ELISA, IHC and WB applications and shows reactivity with Human and mouse samples. The MA5-15493 immunogen is purified recombinant fragment of ApoO expressed in E. Coli. . MA5-15493 detects ApoO which has a predicted molecular weight of approximately 22.2kDa.
- Reactivity
- Human, Mouse
- Host
- Mouse
- Isotype
- IgG
- Antibody clone number
- 2F1
- Vial size
- 100 μL
- Concentration
- Conc. Not Determined
- Storage
- Store at 4°C short term. For long term storage, store at -20°C, avoiding freeze/thaw cycles.
Submitted references MIC26 and MIC27 cooperate to regulate cardiolipin levels and the landscape of OXPHOS complexes.
Cristae undergo continuous cycles of membrane remodelling in a MICOS-dependent manner.
Mic13 Is Essential for Formation of Crista Junctions in Mammalian Cells.
The non-glycosylated isoform of MIC26 is a constituent of the mammalian MICOS complex and promotes formation of crista junctions.
Anand R, Kondadi AK, Meisterknecht J, Golombek M, Nortmann O, Riedel J, Peifer-Weiß L, Brocke-Ahmadinejad N, Schlütermann D, Stork B, Eichmann TO, Wittig I, Reichert AS
Life science alliance 2020 Oct;3(10)
Life science alliance 2020 Oct;3(10)
Cristae undergo continuous cycles of membrane remodelling in a MICOS-dependent manner.
Kondadi AK, Anand R, Hänsch S, Urbach J, Zobel T, Wolf DM, Segawa M, Liesa M, Shirihai OS, Weidtkamp-Peters S, Reichert AS
EMBO reports 2020 Mar 4;21(3):e49776
EMBO reports 2020 Mar 4;21(3):e49776
Mic13 Is Essential for Formation of Crista Junctions in Mammalian Cells.
Anand R, Strecker V, Urbach J, Wittig I, Reichert AS
PloS one 2016;11(8):e0160258
PloS one 2016;11(8):e0160258
The non-glycosylated isoform of MIC26 is a constituent of the mammalian MICOS complex and promotes formation of crista junctions.
Koob S, Barrera M, Anand R, Reichert AS
Biochimica et biophysica acta 2015 Jul;1853(7):1551-63
Biochimica et biophysica acta 2015 Jul;1853(7):1551-63
No comments: Submit comment
Supportive validation
- Submitted by
- Invitrogen Antibodies (provider)
- Main image

- Experimental details
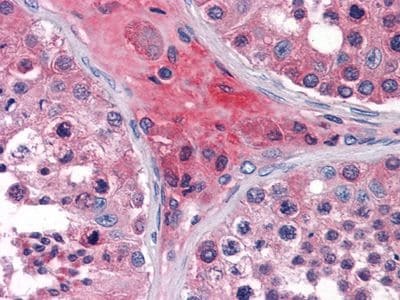
- Immunohistochemical analysis of paraffin-embedded human testis tissues using ApoO monoclonal antibody (Product # MA5-15493).
Supportive validation
- Submitted by
- Invitrogen Antibodies (provider)
- Main image
- Experimental details
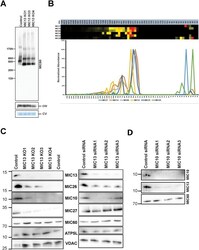
- Fig 4 MIC13 knockout results in smaller but assembled MICOS complexes. (A) Protein complexes were isolated by blue-native electrophoresis (BNE) on 3 to 18% acrylamide gradient gels immuno-decorated against MIC60, subunit coxVIa/b of complex IV and ATP synthase was shown on blot to demonstrate equal loading of samples and no effect. In control HEK293 cells, MICOS is detected around 500 KDa. Deletion of MIC13 leads to smaller MICOS complex. (B) Complexome profiling of the MICOS complex in MIC13 KO cells demonstrate the smaller MICOS complex (subcomplex) comprises of MIC60, MIC19 and MIC25. (C) Immnuoblot showing the steady state levels of various MICOS components in MIC13 KO cells as well as cells treated with MIC13 siRNA. There is reduction of MIC10, MIC27 and MIC26 upon deletion of MIC13. (D) Immunoblot from the cells depleted of MIC10 and probed for MIC13 and MIC60.

- Submitted by
- Invitrogen Antibodies (provider)
- Main image
- Experimental details
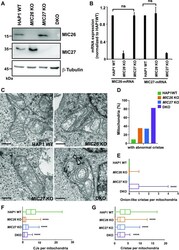
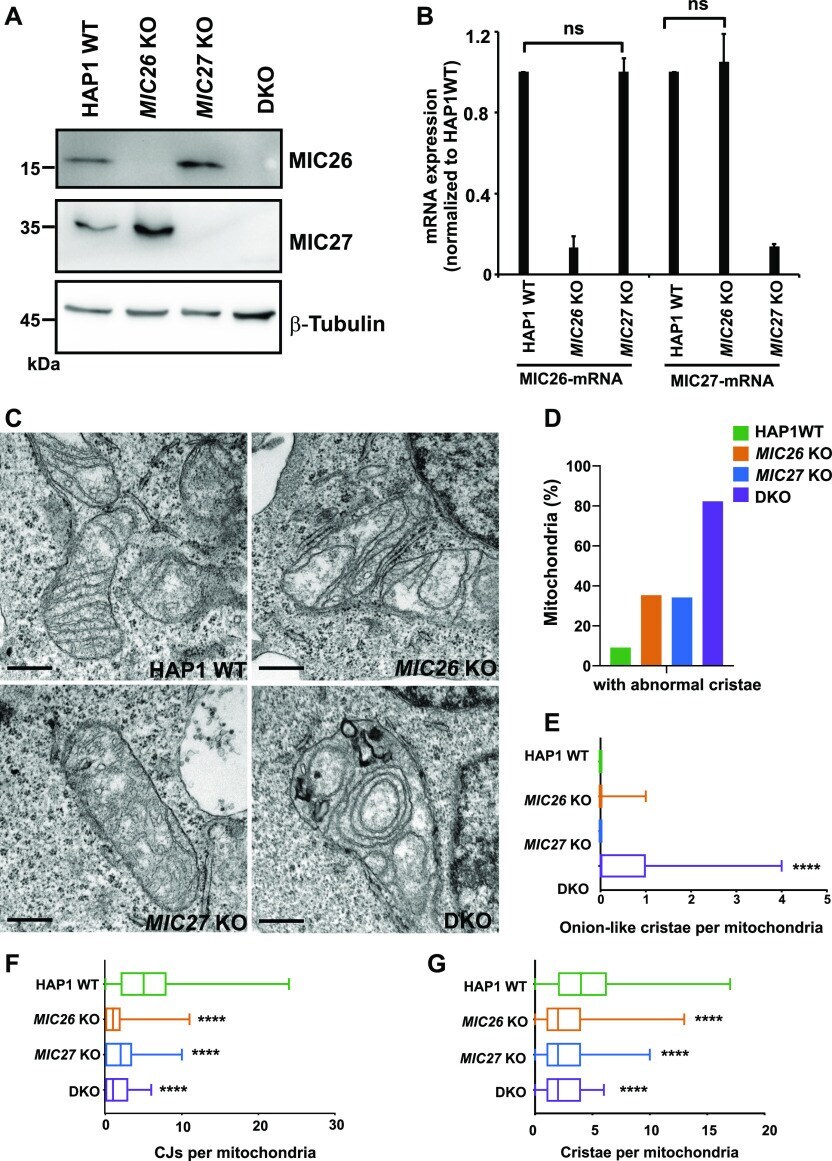
- Figure 1. MIC26 and MIC27 cooperatively determine cristae morphology and are required for formation of crista junctions (CJs). (A) Western blots from total cell lysates from HAP1 WT, MIC26 KO, MIC27 KO or double knockout (DKO) cells show loss of respective protein and increased level of the respective other protein (reciprocal regulation). DKO cells lacking MIC26 and MIC27 show virtually a complete loss of both full-length proteins. (B) Quantification from qRT-PCR using HAP1 WT, MIC26 KO or MIC27 KO cells and probed for the mRNA levels of MIC26 or MIC27 using specific primers. The house-keeping genes HPRT1 and GAPDH were used as controls. Data from three independent experiments represented as mean +- SEM. P -values calculated using t test show no significant differences (ns). (C) Representative images from electron microscopy in HAP1 WT, MIC26 KO, MIC27 KO, or DKO cells show accumulation of concentric cristae in DKO cells and loss of CJs in single knockouts (SKOs) and DKO cells. Scale bar 0.5 mum. (D) Bar graph show the percentage of mitochondria that have abnormal cristae in respective cell lines. Data from total of 60-90 mitochondrial sections of two independent experiments are represented. (E) Box plot showing the number of concentric onion-like cristae per mitochondrial section. DKO cells show high accumulation of concentric cristae. Data from total of 60-90 mitochondrial section of two independent experiments. **** P -value
- Submitted by
- Invitrogen Antibodies (provider)
- Main image
- Experimental details
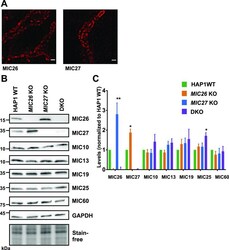
- Figure 3. MIC26 and MIC27 are not required for the stability of other MICOS subunits. (A) Representative STED super-resolution images of MIC26 or MIC27 in control cells show the punctae rail-like arrangement within mitochondria that resemble the staining from MIC60 or MIC10 (see also Fig 4A ). Scale bar 0.5 mum. (B) Western blots of total cell lysates from HAP1 WT, MIC26 KO, MIC27 KO, or double knockout (DKO) cells probed for various subunits of the MICOS complex. (C) Densitometric quantification of Western blots from four independent experiments (mean +- SEM) in HAP1 WT, MIC26 KO, MIC27 KO, or DKO cells that are normalized to levels of each MICOS subunits to the HAP1 WT. Except MIC26 or MIC27 levels (showing reciprocal change), steady-state levels of other MICOS subunits were not drastically reduced in single knockouts or DKO cells of MIC26 and MIC27 . One sample t test was used for comparison. Marginal increase in MIC25 was found in DKO cells. * P -value

- Submitted by
- Invitrogen Antibodies (provider)
- Main image
- Experimental details
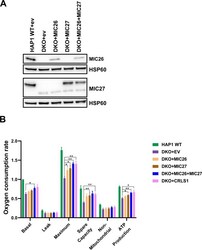
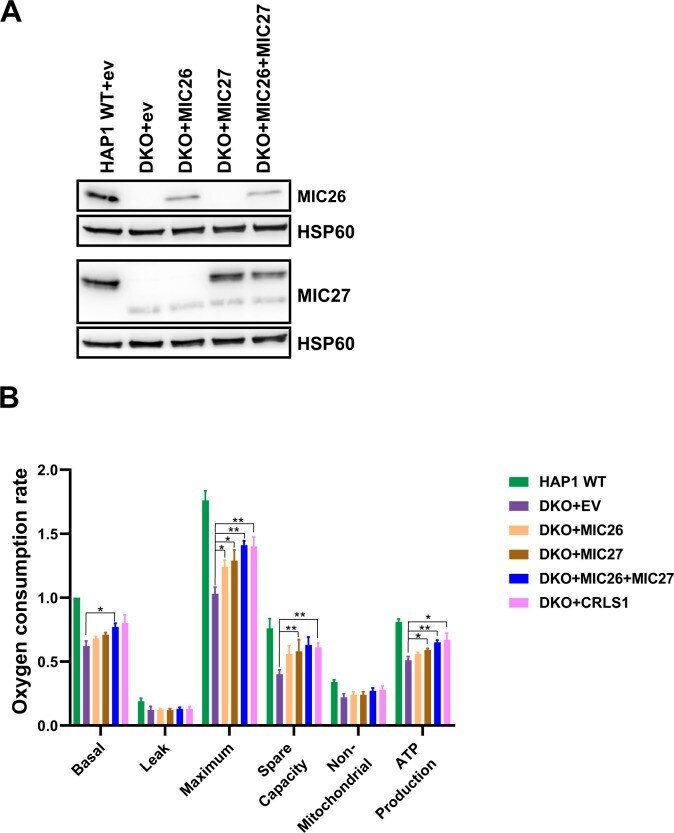
- Figure S1. Stable expression of MIC26 or/and MIC27 in double knockout (DKO) cell lines rescue respiration. (A) Western blot showing the expression level of MIC26 or/and MIC27 in the stable cell lines of HAP1 WT expressing empty vector (ev) and DKO that contain either of the following constructs, ev (pMSCVpuro), pMSCVpuro-MIC26, pMSCVpuro-MIC27, and both pMSCVpuro-MIC26 and pMSCVpuro-MIC27 together. (B) Oxygen consumption rates (pmol O 2 /s), including basal respiration (Basal), proton leak, maximal respiration (Maximum) after uncoupling by FCCP, spare respiratory capacity (Spare capacity), non-mitochondrial respiration (Non-mitochondrial), and ATP production are shown for HAP1 WT+EV (empty vector) and DKO+EV, DKO+MIC26, DKO+MIC27, DKO+MIC26+MC27, and DKO+CRLS1. Data are normalized to basal respiration from HAP1 WT+EV and the mean +- SEM from three independent experiments is shown. Overexpression of both MIC26 and MIC27 in DKO cells significantly rescued respiration of DKO cells. * P -value
- Submitted by
- Invitrogen Antibodies (provider)
- Main image
- Experimental details
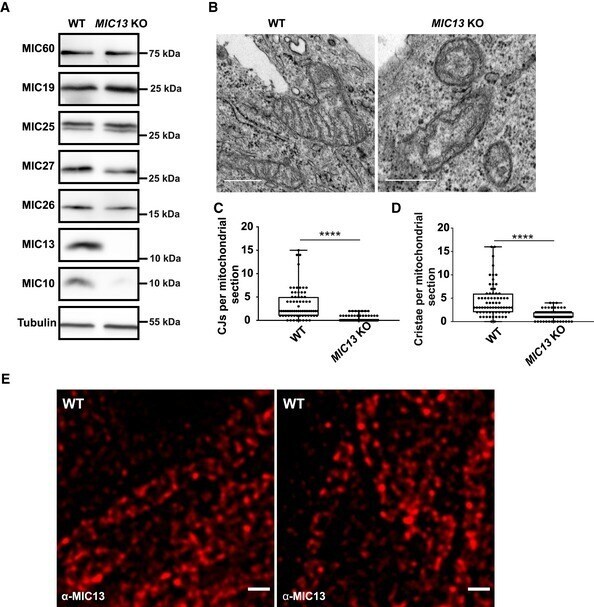
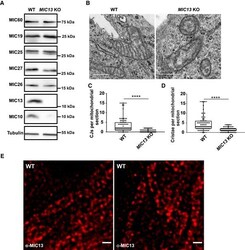
- Figure EV1 Deletion of MIC13 in HeLa cells leads to a loss of crista junctions A Western blot analysis of WT and MIC13 KO HeLa cells showing a reduction in MIC10, MIC26 and MIC27 protein levels in MIC13 KOs. B Representative electron micrographs of WT and MIC13 KO HeLa cells show loss of CJs in MIC13 KOs. Scale bar 500 nm. C Boxplot showing quantification of CJs per mitochondrial section from different mitochondria in WT and MIC13 KO HeLa cells represented as boxplots. Boxplots show median and interquartile range from 25 to 75 percentile, and whiskers represent minimum and maximum value. Data from n = 70-90 mitochondria (from two independent experiments) are shown as data points in the boxplots. **** P < 0.0001 (WT versus MIC13 KO), unpaired Student's t -test. D Boxplot showing quantification of cristae per mitochondrial section in WT and MIC13 KO HeLa cells represented as boxplots. Boxplots show median and interquartile range from 25 to 75 percentile, and whiskers represent minimum and maximum value. Data from n = 70-90 mitochondria (from two independent experiments) are shown as data points in the boxplots. **** P < 0.0001, unpaired Student's t -test. E Representative STED super-resolution images of WT HeLa cells stained with anti-MIC13 antibody shows punctate distribution of MIC13. Scale bar 500 nm.