Explore
 Validate
 Learn
Learn50-1839-42
antibody from Invitrogen Antibodies
Targeting: CXCR3
CD183, CKR-L2, CMKAR3, GPR9, IP10-R, MigR
 Flow cytometry
Antibody data
- Antibody Data
- Antigen structure
- References [2]
- Comments [0]
- Validations
- Flow cytometry [1]
- Other assay [1]
Submit
Validation data
Reference
Comment
Report error
- Product number
- 50-1839-42 - Provider product page

- Provider
- Invitrogen Antibodies
- Product name
- CD183 (CXCR3) Monoclonal Antibody (CEW33D), eFluor™ 660, eBioscience™
- Antibody type
- Monoclonal
- Antigen
- Other
- Description
- Description: The CEW33D monoclonal antibody reacts with human CD183. CD183, also known as CXCR3, is a G protein-coupled chemokine receptor that interacts with ligands CXCL9 (MIG), CXCL10 (IP-10), and CXCL11 (I-TAC). Strongly associated with type 1 immunity, CD183 is induced in naive T cells upon activation and remains upregulated in T helper type (Th)1 cells, CD8 effector cells, NK cells and NKT cells. CD183-ligand interactions mediate infiltration of inflamed tissues in normal type 1 immune responses as well as in many inflammatory and autoimmune diseases. CD183 is also expressed on some B cells and plasmacytoid DC. Applications Reported: This CEW33D antibody has been reported for use in flow cytometric analysis. Applications Tested: This CEW33D antibody has been pre-titrated and tested by flow cytometric analysis of normal human peripheral blood cells. This can be used at 5 µL (0.5 µg) per test. A test is defined as the amount (µg) of antibody that will stain a cell sample in a final volume of 100 µL. Cell number should be determined empirically but can range from 10^5 to 10^8 cells/test. eFluor® 660 is a replacement for Alexa Fluor® 647. eFluor® 660 emits at 659 nm and is excited with the red laser (633 nm). Please make sure that your instrument is capable of detecting this fluorochome. Excitation: 633-647 nm; Emission: 668 nm; Laser: Red Laser. Filtration: 0.2 µm post-manufacturing filtered.
- Reactivity
- Human
- Host
- Mouse
- Isotype
- IgG
- Antibody clone number
- CEW33D
- Vial size
- 100 Tests
- Concentration
- 5 µL/Test
- Storage
- 4° C, store in dark, DO NOT FREEZE!
Submitted references High Numbers of Circulating CD57(+) NK Cells Associate with Resistance to HER2-Specific Therapeutic Antibodies in HER2(+) Primary Breast Cancer.
Subsets of human CD4(+) regulatory T cells express the peripheral homing receptor CXCR3.
Muntasell A, Servitja S, Cabo M, Bermejo B, Pérez-Buira S, Rojo F, Costa-García M, Arpí O, Moraru M, Serrano L, Tusquets I, Martínez MT, Heredia G, Vera A, Martínez-García M, Soria L, Comerma L, Santana-Hernández S, Eroles P, Rovira A, Vilches C, Lluch A, Albanell J, López-Botet M
Cancer immunology research 2019 Aug;7(8):1280-1292
Cancer immunology research 2019 Aug;7(8):1280-1292
Subsets of human CD4(+) regulatory T cells express the peripheral homing receptor CXCR3.
Hoerning A, Koss K, Datta D, Boneschansker L, Jones CN, Wong IY, Irimia D, Calzadilla K, Benitez F, Hoyer PF, Harmon WE, Briscoe DM
European journal of immunology 2011 Aug;41(8):2291-302
European journal of immunology 2011 Aug;41(8):2291-302
No comments: Submit comment
Supportive validation
- Submitted by
- Invitrogen Antibodies (provider)
- Main image

- Experimental details
- Staining of normal human peripheral blood cells with Anti-Human CD3 eFluor® 450 (Product # 48-0037-42) and Mouse IgG1 K Isotype Control eFluor® 660 (Product # 50-4714-82) (left) or Anti-Human CD183 (CXCR3) eFluor® 660 (right). Cells in the lymphocyte gate were used for analysis.

Supportive validation
- Submitted by
- Invitrogen Antibodies (provider)
- Main image

- Experimental details
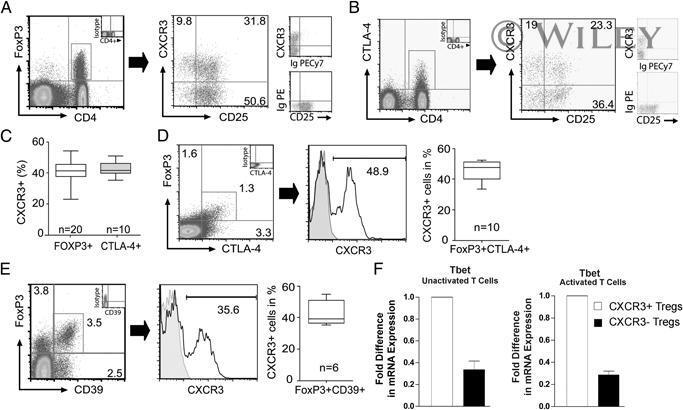
- 3 Co-expression of CXCR3 with FOXP3, CTLA-4 and CD39 on CD4 + T cells. (A and B) Representative flow cytometry plots illustrating co-expression of CXCR3 and CD25 on (A) the CD4 + FOXP3 + T-cell subset and (B) the CD4 + CTLA-4 + subset. Staining with isotype control antibodies is shown on the right of each dot plot. (C) Median, 25th and 75th percentile and range of CXCR3 expression on CD4 + FOXP3 + or CD4 + CTLA-4 + subsets. (D and E) Representative flow cytometry plots of CXCR3 expression on (D) double positive FOXP3 + CTLA-4 + cells and (E) FOXP3 + CD39 + cells after gating on CD4 + cells. The box plot on the right of each panel illustrates median, 25th and 75th percentile and range of expression in multiple experiments. (F) Fold difference (mean+SEM) in mRNA expression for Tbet in sorted populations of CD4 + CD25 hi CXCR3 pos cells (white bars) or CD4 + CD25 hi CXCR3 neg Tregs (black bars). Expression was evaluated in unactivated Tregs (left panel) or in Tregs following 6 h activation with anti-CD3/anti-CD28 (right panel). Representative of n =3 experiments with similar results.